
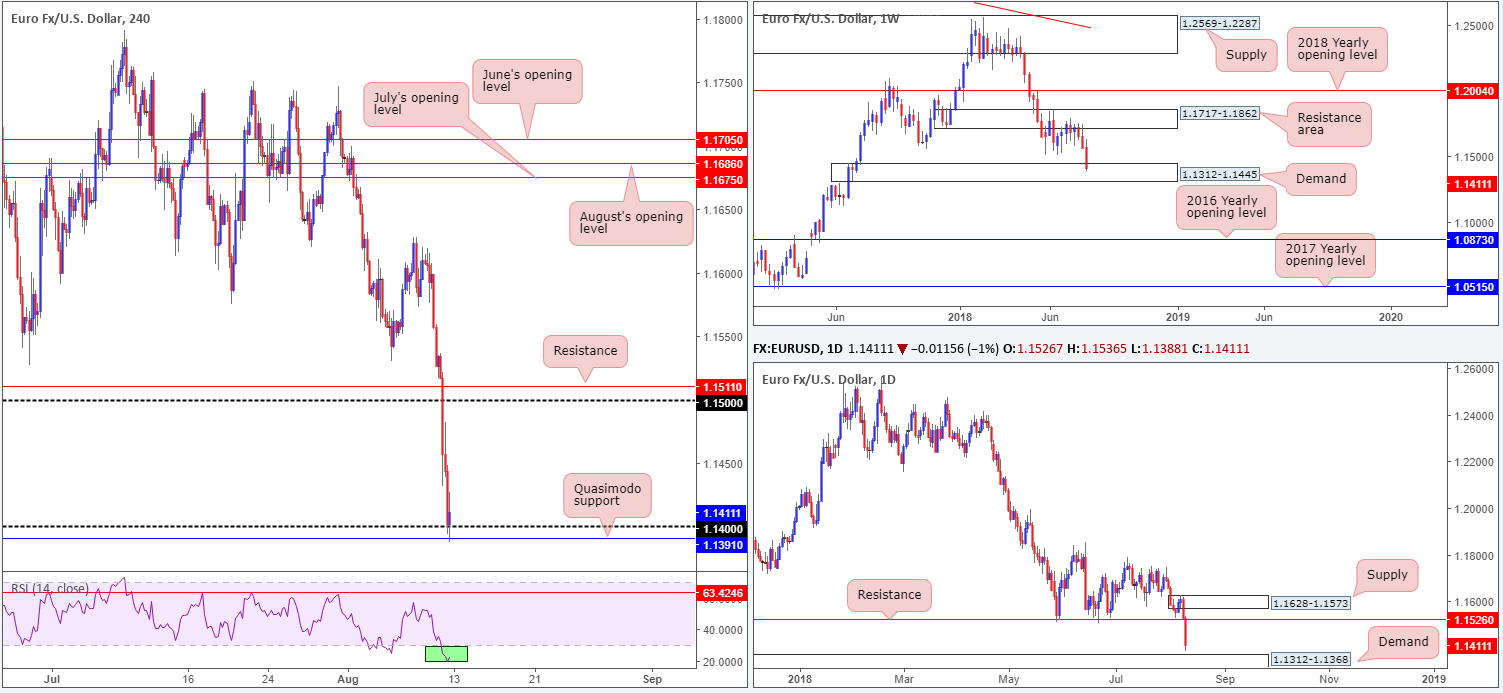
EUR/USD:
Weekly Closing price: 1.1411
Weekly perspective
It was another depressing week for the euro, dropping in excess of 150 pips against its US counterpart and recording its third consecutive weekly loss. As a result of this, a strong-looking demand at 1.1312-1.1445 (formed on the break of the August 15 high [2016] at 1.1366) elbowed its way into the spotlight.
Daily perspective:
Key support at 1.1526 was engulfed in the later stages of last week, resulting in price closing the week out just north of a demand zone coming in at 1.1312-1.1368. Seen positioned within the lower limits of weekly demand mentioned above at 1.1312-1.1445, we may see a response from this base early this week. In the event price continues to probe lower, though, support at 1.1285 is considered the next downside objective on the daily scale (not seen on the screen).
H4 perspective:
A quick recap of Friday’s movement on the H4 chart shows the single currency clocked its lowest levels since July 2017. Trending lower since the beginning of the second quarter, the meltdown in Turkey ignited additional selling, opening the door for a test of the 1.14 handle and nearby Quasimodo support at 1.1391. Beyond this neighborhood, H4 demand is seen at 1.1329-1.1354 (not seen on the screen), which happens to be located within both weekly and daily demands highlighted above. Also worth noting is the H4 RSI is currently trading within oversold territory.
Areas of consideration:
While the fundamentals clearly echo a bearish tone at the moment, all three timeframes display supportive structures on the radar.
A long from the H4 demand mentioned above at 1.1329-1.1354 is an option this week, with the choice of either placing stops beneath this said zone or beyond the daily/weekly demands lower edge at 1.1312. A close above 1.14 from the H4 base would be an ideal cue to begin thinking about reducing risk to breakeven and taking partial profits off the table.
Today’s data points: Limited.
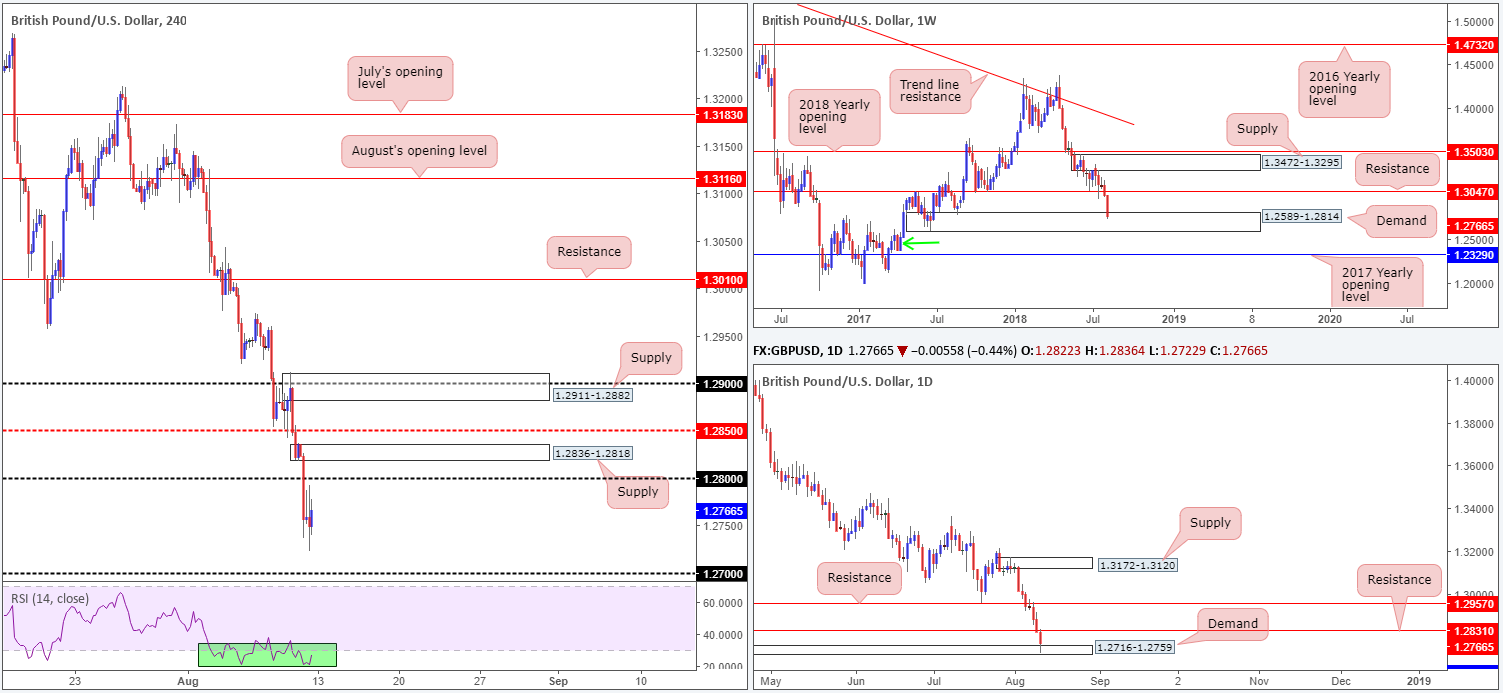
GBP/USD:
Weekly Gain/Loss: -1.82%
Weekly Closing price: 1.2766
Weekly perspective:
Another big loser on the week amid a mix of ongoing Brexit uncertainty, political upheaval and BoE policy perceptions as ‘no-deal’ prospects increased. Erasing in excess of 230 pips last week, cable eventually shook hands with demand located at 1.2589-1.2814. Having seen this area tested once already in August 2017, further selling could be seen. Beyond the current zone, demand marked with a green arrow at 1.2365-1.2555 is likely the next hurdle in the firing range, but with the 2017 yearly opening level lurking just beneath it at 1.2329, price could possibly fake lower to bring in buyers from this hurdle.
Daily perspective:
Demand at 1.2716-1.2759 (fixed within the walls of weekly demand mentioned above at 1.2589-1.2814), as you can see, was brought into the fray going into the week’s end. To the upside, resistance stands at 1.2831, with little seen above this angle until we reach 1.2957, another level of resistance. Beneath the current demand, nevertheless, a Quasimodo support at 1.2635 is seen (not seen on the screen).
H4 perspective:
Largely upbeat UK macroeconomic data led a modest rebound on Friday, but struggled to print anything of note amid persistent USD buying. Intraday action finished the week consolidating just south of the 1.28 handle, a level breached during Asia hours. Above 1.28, traders may have noticed fresh supply stands out at 1.2836-1.2818, whereas to the downside, the 1.27 handle is likely the next port of call.
Areas of consideration:
In view of current weekly and daily demands, buying may take shape in the early stages of this week, likely bringing 1.28 on the H4 timeframe back into the fold. A large portion of intraday sellers will be looking to short this number on the retest. While a sell from here could work out, a fakeout through this number (common viewing around psychological levels to run stops) is just as likely, in our view.
Given the H4 supply at 1.2836-1.2818 boasts strong momentum to the downside and daily resistance at 1.2831 is seen positioned within the walls of this area, a sell from this supply is potentially the better option. The only grumble here, of course, is weekly buyers could theoretically push the market as far north as weekly resistance at 1.3047 (the next upside target on the weekly scale). In light of this threat, should H4 price respond from the said H4 supply and print a H4 close beneath 1.28, consider reducing risk to breakeven as soon as possible.
Today’s data points: Limited.
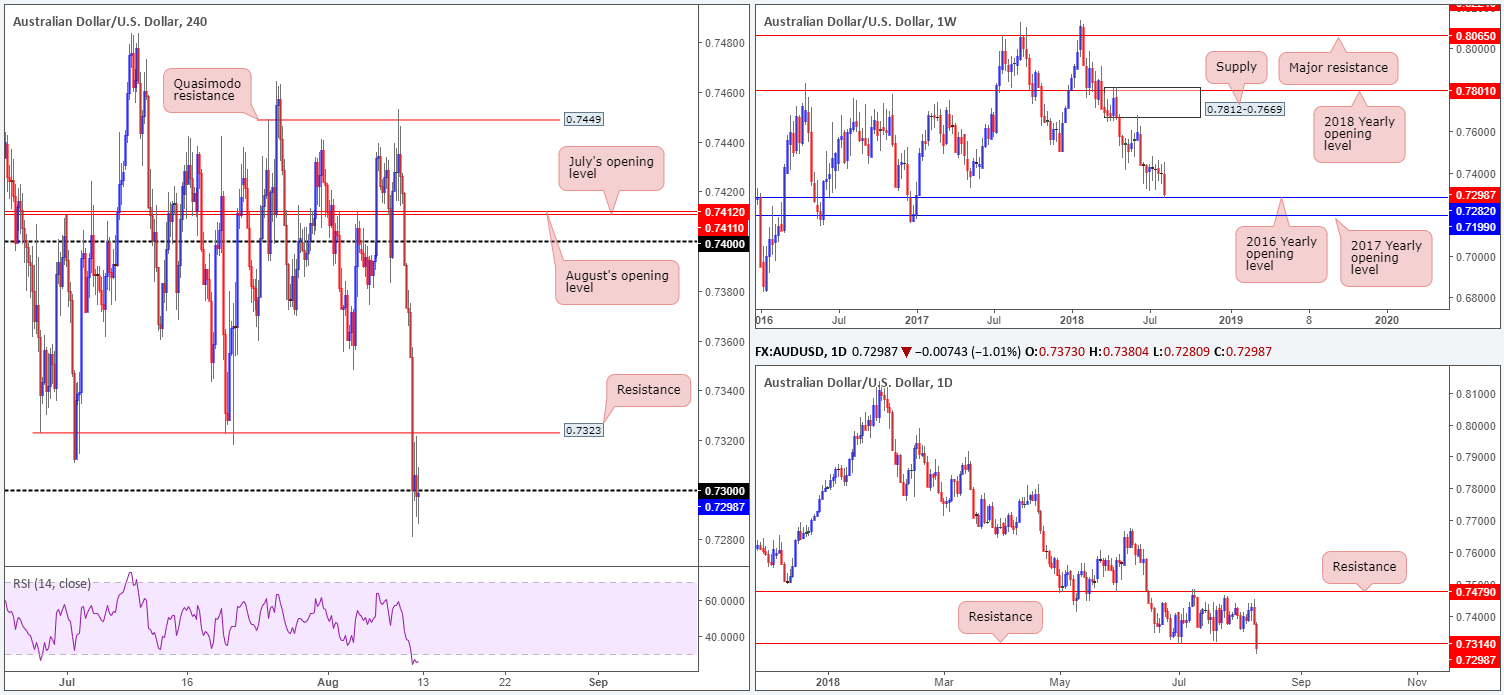
AUD/USD:
Weekly Gain/Loss: -1.41%
Weekly Closing price: 0.7298
Weekly perspective:
After nearly two months of monotonous consolidation, the commodity currency broke out to the downside last week. The move, molded in the form of a near-full-bodied bearish candle, guided the pair into the 2016 yearly opening level at 0.7282. It may also be worth noting here that should this level give way this week, the 2017 yearly opening level is penciled in nearby at 0.7199.
Daily perspective:
Support at 0.7314 witnessed a mild break (close) to the downside in the later stages of last week, opening the window to further selling. Assuming sellers remain defensive, demand at 0.7179-0.7216 (not seen on the screen) is likely the next support target (the 2017 yearly opening level mentioned above on the weekly timeframe at 0.7199 is housed within this demand).
H4 perspective:
Commodity currencies were hit hard on Friday. The first leg of the move happened after the RBNZ surprised markets by pushing out a projected rate hike for another year and saying a cut was still possible. Turkey’s fallout triggered a second wave of selling.
The H4 candles, as you can see, wrapped up the week toying with the 0.73 handle. With stop-loss orders beneath this number triggered, and breakout sellers’ orders now likely filled, a move south to demand at 0.7215-0.7240 may be on the horizon today/early this week.
Areas of consideration:
In a nutshell, the technical structure of this market can be boiled down to the following:
- Weekly support in play (2017 yearly opening level) at 0.7282.
- Daily support at 0.7314 recently breached, therefore could act as resistance going forward.
- H4 price lurking beneath 0.73, with a clear run seen to H4 demand 0.7215-0.7240.
Entering into a sell position based on H4 and daily technicals is a chancy move, given we’re trading from weekly support right now. Likewise, a buy from weekly support is just as problematic, with little room seen to maneuver on the H4 and daily scales.
On account of the above, opting to remain on the sidelines may be the better path to take for the time being.
Today’s data points: Limited.
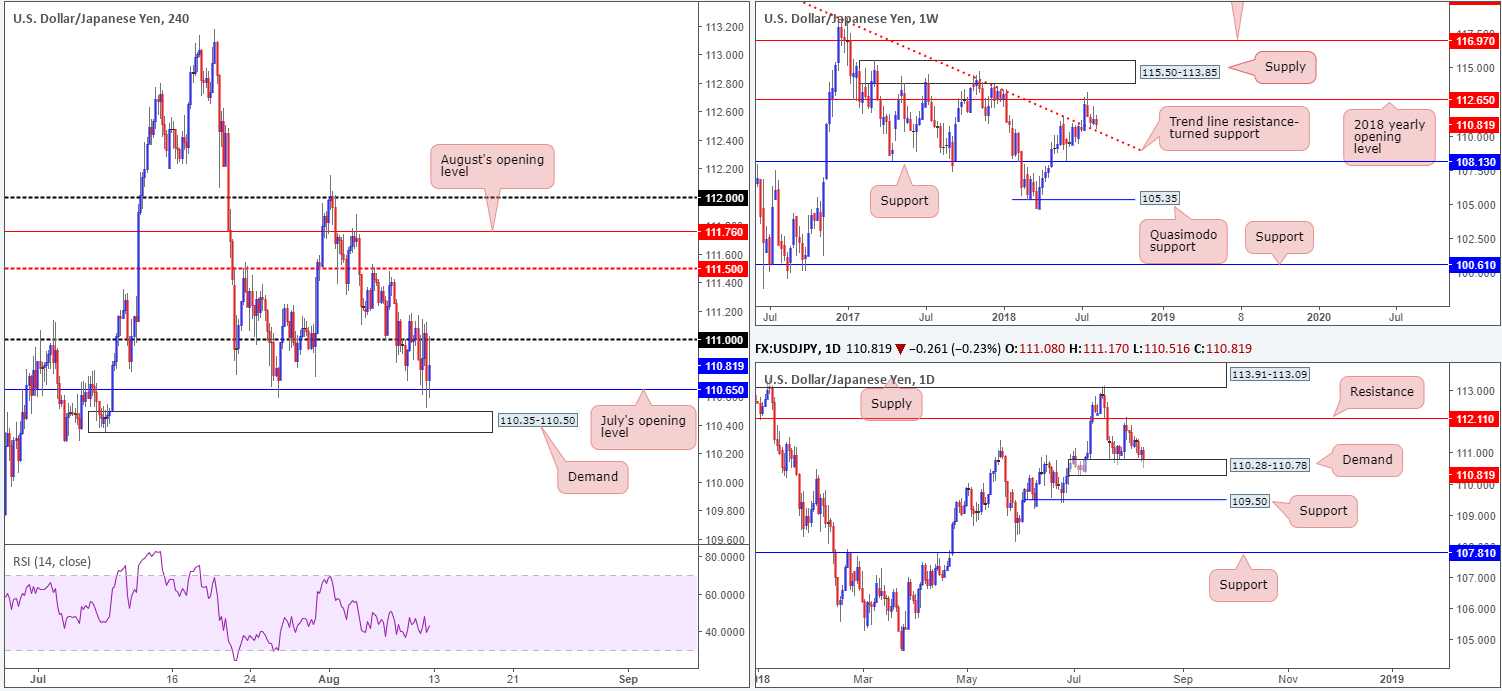
USD/JPY:
Weekly Gain/Loss: -0.41%
Weekly Closing price: 110.81
Weekly perspective:
Weekly movement recently crossed swords with a trend line resistance-turned support (taken from the high 123.57). Having seen the current trend line hold firm as resistance on a number of occasions in the past, it’s likely to remain a defensive barrier going forward. Further buying from current price has the 2018 yearly opening level at 112.65 to target.
Daily perspective:
Supporting the current weekly trend line is a daily demand base coming in at 110.28-110.78. As you can see, this area has held firm once already but failed to sustain gains beyond nearby resistance at 112.11. A break of the demand area this week may call for a move towards support priced in at 109.50.
H4 perspective:
The Turkish crisis dominated the financial markets on Friday, but did little to drive any safe-haven flows towards the Japanese yen. Upside momentum was capped by the 111 handle, while to the downside, July’s opening level at 110.65 continued to provide a floor to this market, followed closely by nearby demand at 110.35-110.50 (sited within the current daily demand zone).
Areas of consideration:
Despite global tensions in play, daily demand at 110.28-110.78 and its partner demand seen on the H4 timeframe at 110.35-110.50 (along with weekly trend line support) echoes a bullish tone.
Longs from the aforementioned H4 demand, therefore, are of interest, with conservative stops placed beneath the daily demand at 110.28. A H4 close above July’s opening level mentioned above at 110.65 from the H4 demand is likely a strong enough cue to reduce risk to breakeven and target the underside of 111 as the initial take-profit zone.
Today’s data points: Limited.
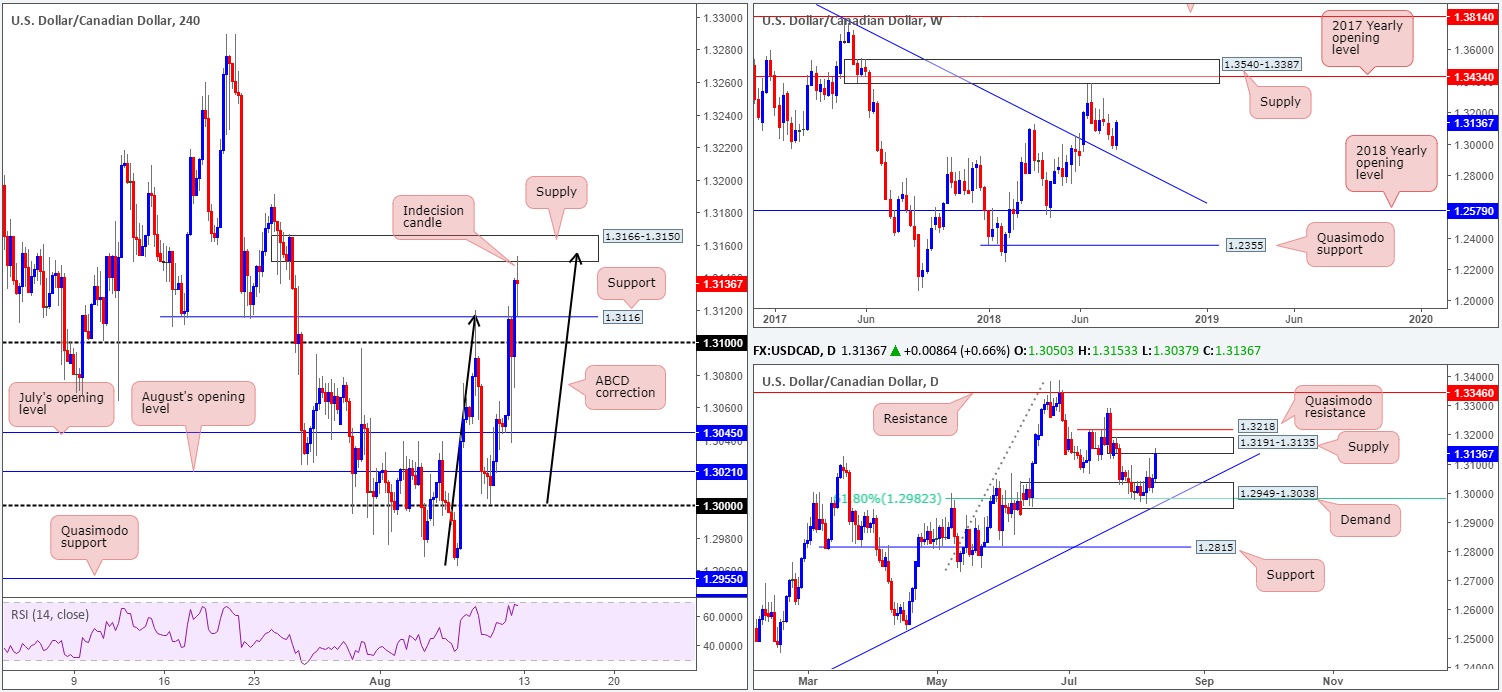
USD/CAD:
Weekly Gain/Loss: +1.13%
Weekly Closing price: 1.3136
Weekly perspective:
Leaving the trend line resistance-turned support (etched from the high 1.4689) unchallenged, last week’s activity produced a bullish engulfing candle of note that erased two weeks’ worth of losses. Continued buying from this point could eventually place the unit within touching distance of supply coming in at 1.3540-1.3387, which happens to house a 2017 yearly opening level at 1.3434.
Daily perspective:
In terms of daily action, demand at 1.2949-1.3038, more specifically, the 61.8% Fib support value seen within it at 1.2982, held ground last week, lifting the pair towards supply marked at 1.3191-1.3135. Another level worth noting on this scale is the Quasimodo resistance seen directly above it at 1.3218.
H4 perspective:
USD/CAD bulls were on fire amid Friday’s sessions, breaking through both the 1.31 handle and resistance level at 1.3116 and eventually connecting with supply at 1.3166-1.3150. What’s notable here is not only is this area seen housed within the current daily supply, the approach formed in the shape of an ABCD bearish pattern (see black arrows). Interestingly, though, price wrapped up the day forming an indecision candle that tapped the underside of the said supply and the recently engulfed resistance, now acting support at 1.3116.
Areas of consideration:
Traders looking to initiate long positions based on the recently formed weekly bullish engulfing candle have a number of competing themes to contend with on the H4 and daily timeframes!
Despite the appealing confluence seen off the current H4 supply, selling this market is also problematic. Aside from the weekly bullish engulfing candle, nearby H4 support at 1.3116, followed closely by the 1.31 handle are likely to hinder downside today/early this week. It would only be once the unit breaks through 1.31 would space to move lower be observed: to July’s opening level at 1.3045.
Assuming our read is correct, neither a long nor short is appealing at the moment.
Today’s data points: Limited.
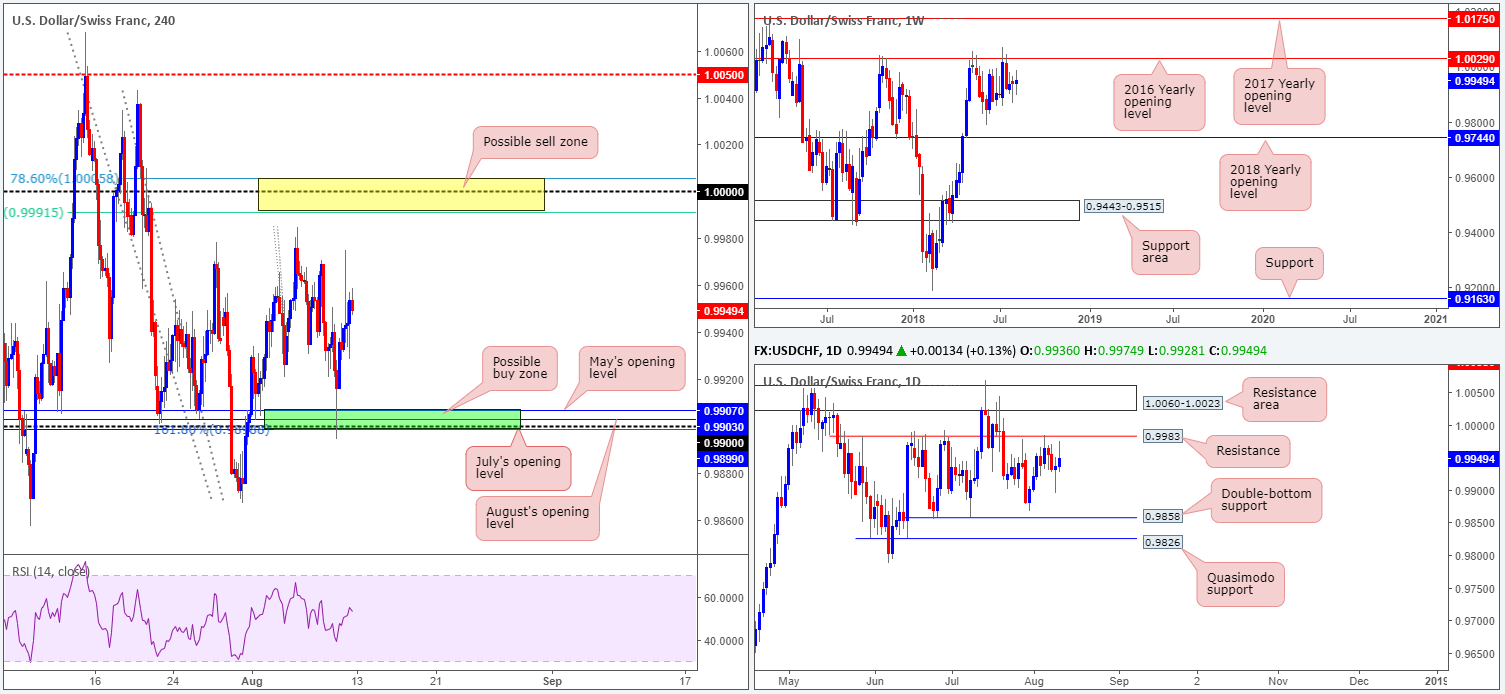
USD/CHF:
Weekly Gain/Loss: +0.09%
Weekly Closing price: 0.9949
Weekly perspective:
As can be seen on the weekly timeframe, price action penciled in a clear-cut indecision candle last week as the piece consolidates just south of a key resistance at 1.0029: the 2016 yearly opening level. Holding price lower on two occasions in 2017, and twice already in 2018, this level commands attention! Downside supports to keep eyeballs on from here fall in at June’s low 0.9788, followed by the 2018 yearly opening level at 0.9744.
Daily perspective:
Resistance at 0.9983, as is evident from the chart, continues to cap upside at the moment. In the event of a break north, nonetheless, the resistance area planted at 1.0060-1.0023 (holds the 2016 yearly opening level at 1.0029 mentioned on the weekly timeframe) is likely the next base in the firing range. A move lower from current price, on the other hand, has 0.9858 in view: a double-bottom support, shadowed closely by Quasimodo support at 0.9826.
H4 perspective:
Broad demand for the USD kept the USD/CHF on the winning side of the table on Friday, despite fading from session highs of 0.9974.
In terms of H4 structure, the team has noted to keep crosshairs fixed on two areas this week for potential trading opportunities:
- A possible buy zone marked in green at 0.9899/0.9907 (comprised of July’s opening level at 0.9899, a 161.8% Fib ext. point at 0.9899 [taken from the high 0.9984], the 0.99 handle, August’s opening level at 0.9903 and May’s opening level at 0.9907).
- The next area of interest can be seen at parity (1.0000). Note surrounding this widely watched number are two Fibonacci resistances: 78.6% at 1.0005 and 61.8% at 0.9991 (yellow zone).
Areas of consideration:
Traders are urged to wait for additional H4 candle confirmation at both the above said areas prior to pulling the trigger, preferably in the shape of a full or near-full-bodied candle. The reason being is round numbers (1.0000 and 0.99) tend to attract ‘stop runs’ (fakeouts). There’s little worse than having your stop-loss order triggered by a hair only to watch price shortly after hit your take-profit area!
Today’s data points: Limited.
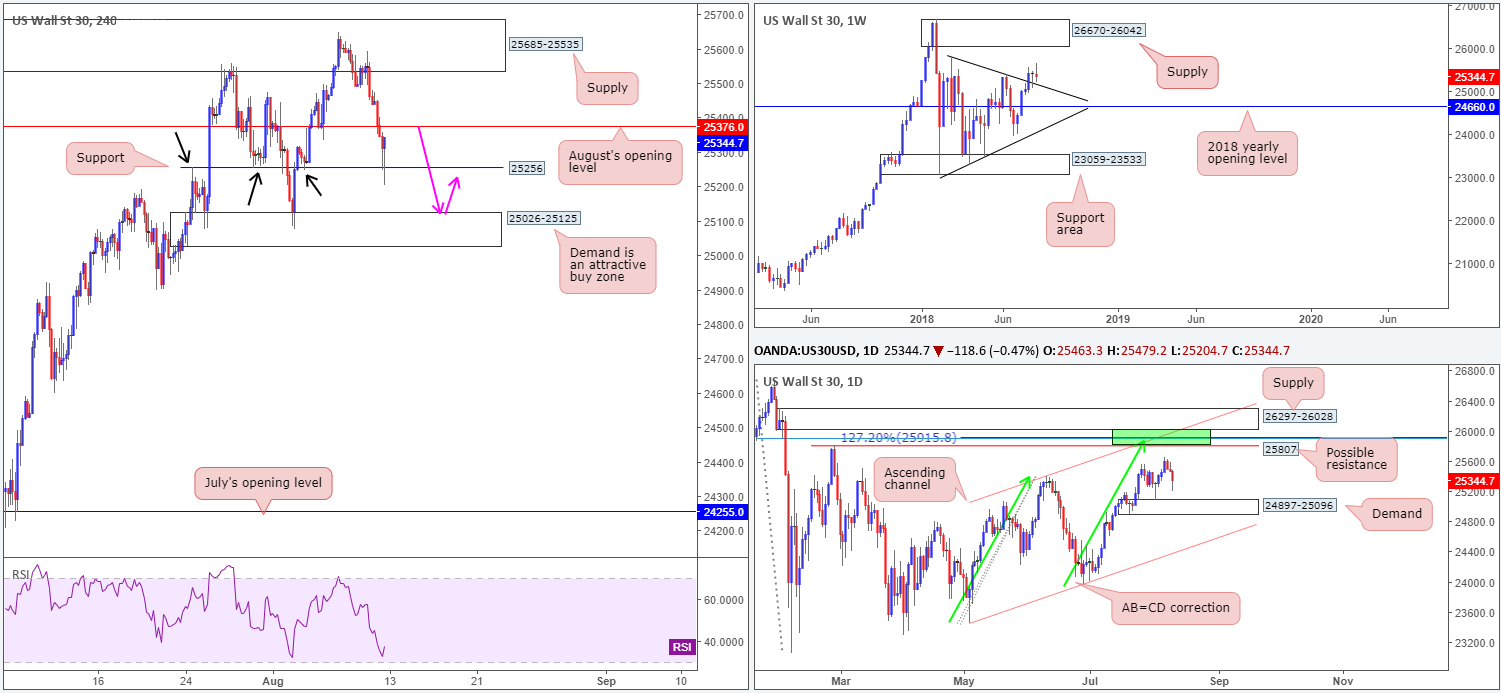
Dow Jones Industrial Average:
Weekly Gain/Loss: -0.26%
Weekly Closing price: 25344
Weekly perspective:
In recent weeks, the market observed a retest of a trend line resistance-turned support (etched from the high 25807) in the shape of a nice-looking bullish pin-bar formation. Although we’ve yet to see much upside presence drawn from this, a run up to supply coming in at 26670-26042 is still a possible scenario to keep tabs on this week.
Daily perspective:
In conjunction with weekly action, daily movement also shows room to gravitate higher. Supply at 26297-26028 is an interesting area. Not only does it boast strong downside momentum from its base, it converges closely with channel resistance (taken from the high 25399), a resistance level at 25807 (Feb 27 high), a 127.2% AB=CD correction point at 25915 and a 78.6% Fib resistance at 25904 (green zone). Strong confluence clearly exists here, traders, therefore make sure to note this zone in your watchlists this week!
H4 perspective:
Major US equity indices plunged lower on Friday, fueled by the mounting currency crisis in Turkey. The ongoing decline in the Turkish Lira raised concerns about a possible contagion into other markets, especially in wake of the European banking exposure. Technically, we observed a move below August’s opening level at 25376 towards support drawn from 25256, which, as you can see, has held firm in the shape of a bullish pin-bar formation.
Areas of consideration:
The underside of August’s opening level at 25376 could possibly act as resistance in early trade today and force the H4 candles below the current support towards H4 demand at 25026-25125, which converges with the top edge of daily demand mentioned above at 24897-25096. Therefore, this demand area is somewhere we would expect a bounce higher to be seen (stops best plotted beneath the lower edge of the zone).
In the event a push above August’s opening level takes shape, traders can then expect follow-through buying towards H4 supply at 25685-25535. A retest of 25376 as support would, in our view, be enough evidence to suggest an intraday long position.
Today’s data points: Limited.
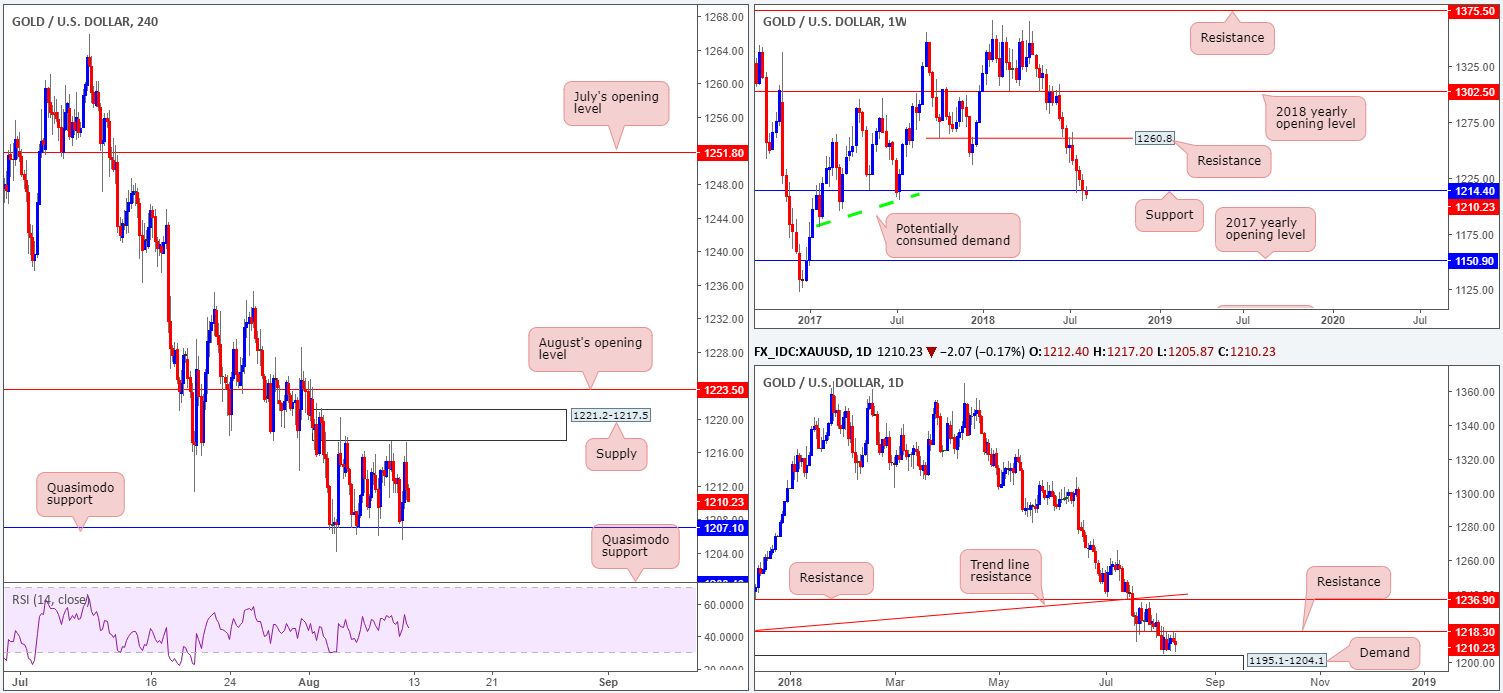
XAU/USD (Gold)
Weekly Gain/Loss: -0.35%
Weekly Closing price: 1210.2
Weekly perspective:
Recording its fifth consecutive losing week, the price of gold eventually closed beneath support at 1214.4 last week. Though it is not what we’d consider a ‘decisive’ close, the possibility of further selling as far south as the 2017 yearly opening level at 1150.9 is there. Note there’s limited active demand to the left of current price between these two levels.
Daily perspective:
While weekly price eyes lower levels, daily movement appears poised to shake hands with nearby demand plotted at 1195.1-1204.1 after a number of failed attempts to breach resistance at 1218.3. A break of this demand area, as the weekly timeframe suggests, opens the pathway south to another layer of demand at 1171.1-1185.0 (not seen on the screen).
H4 perspective:
A closer look at price action on the H4 timeframe, however, shows the yellow metal has been carving out a consolidation between Quasimodo support at 1207.1 and supply at 1221.2-1217.5 since the beginning of the month. Note daily resistance mentioned above at 1218.3 is seen encased within the aforesaid H4 supply. Outside of this H4 range, August’s opening level at 1223.5 is seen, along with another Quasimodo support at 1200.4.
Areas of consideration:
We’re sure most technicians would agree, medium-term direction is somewhat restricted in this market right now. Yes, we have a break of weekly support at 1214.4, but it lacks energy, in our view. Plus, sellers have to contend with a number of competing structures on H4 and daily timeframes. For that reason, medium-term trend trading is out of the question for the time being it seems.
Range traders may wish to try and take advantage of the small H4 range currently in play. We would strongly recommend drilling down to the lower timeframes and attempting to pin down an entry there, as this should help increase risk/reward. A H1 pin-bar formation, for example, formed within the current H4 demand would be such confirmation. Stop-loss orders can then be positioned beneath the candle low, targeting the opposing end of the noted H4 range: supply.
The use of the site is agreement that the site is for informational and educational purposes only and does not constitute advice in any form in the furtherance of any trade or trading decisions.
The accuracy, completeness and timeliness of the information contained on this site cannot be guaranteed. IC Markets does not warranty, guarantee or make any representations, or assume any liability with regard to financial results based on the use of the information in the site.
News, views, opinions, recommendations and other information obtained from sources outside of www.icmarkets.com.au, used in this site are believed to be reliable, but we cannot guarantee their accuracy or completeness. All such information is subject to change at any time without notice. IC Markets assumes no responsibility for the content of any linked site. The fact that such links may exist does not indicate approval or endorsement of any material contained on any linked site.
IC Markets is not liable for any harm caused by the transmission, through accessing the services or information on this site, of a computer virus, or other computer code or programming device that might be used to access, delete, damage, disable, disrupt or otherwise impede in any manner, the operation of the site or of any user’s software, hardware, data or property.


