
Key risk events today:
Limited.
(Previous analysis as well as outside sources – italics).
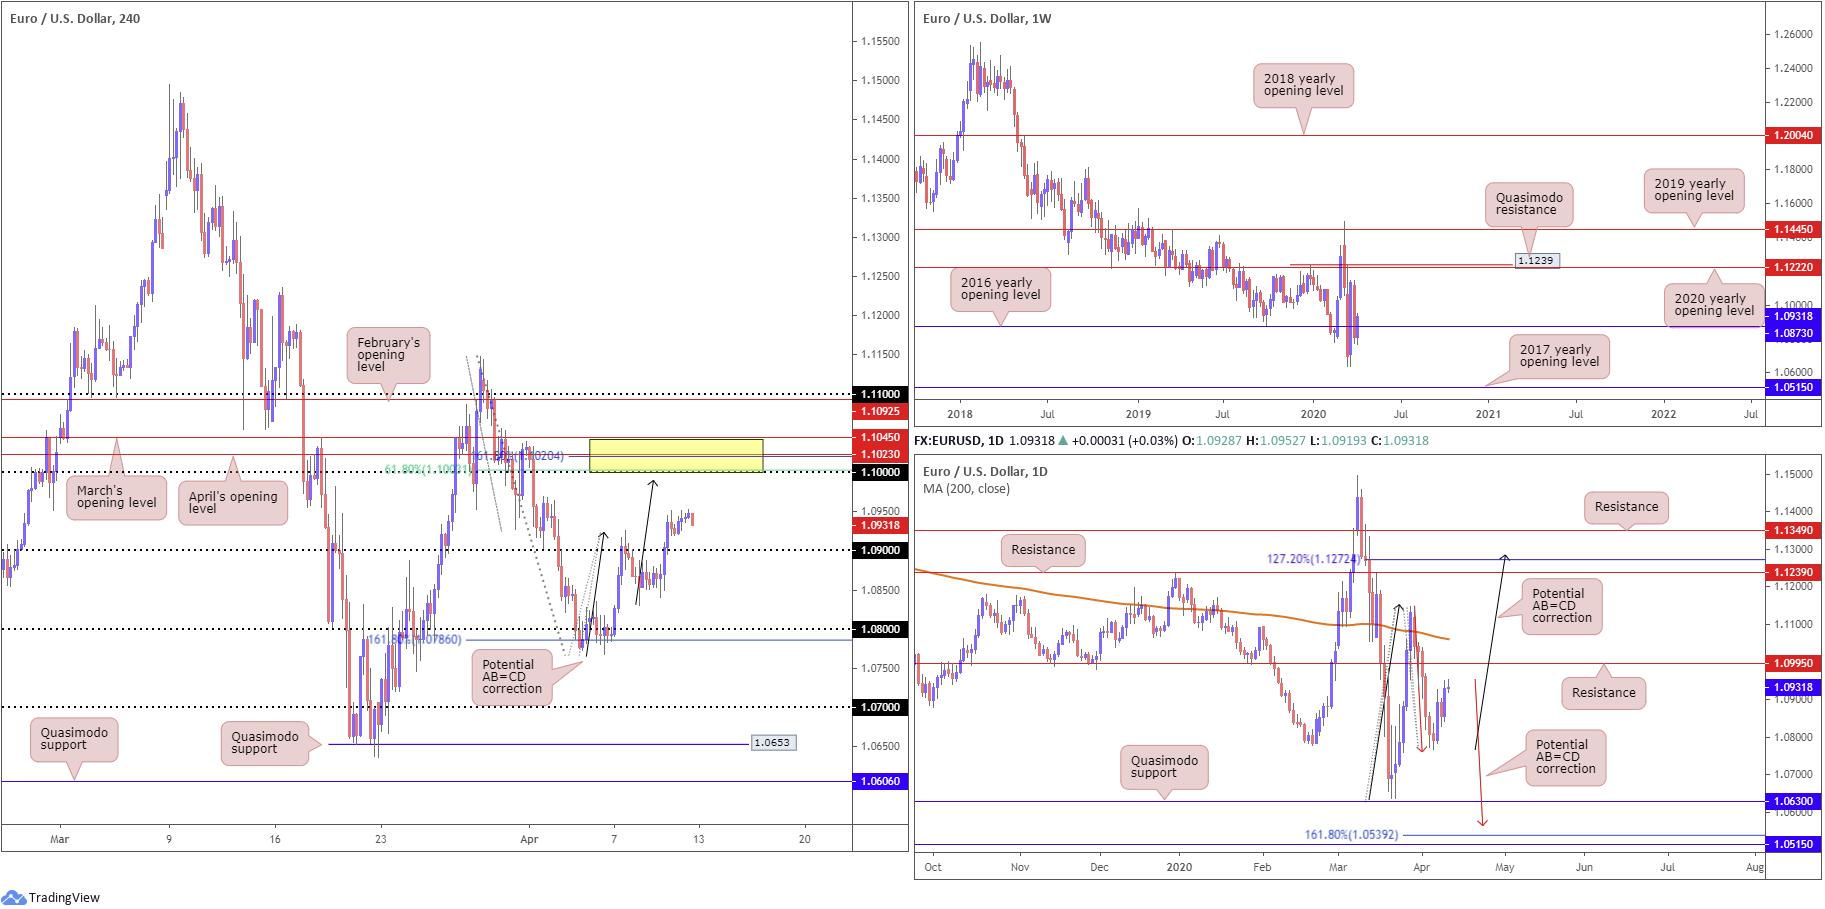
EUR/USD:
Weekly gain/loss: +1.16%
Weekly close: 1.0931
Weekly perspective:
Adding more than 120 points, EUR/USD conquered the 2016 yearly opening level at 1.0873 in recent trading. Skies beyond here are reasonably blue; a run to the 2020 yearly opening level at 1.1222, shadowed by a Quasimodo resistance at 1.1239, is certainly a possibility in the week ahead.
Daily perspective:
From the daily timeframe, however, resistance resides at 1.0995, followed by the 200-day SMA (orange – 1.1060). Beyond the said structures, harmonic traders will also note a potential 127.2% AB=CD correction (black arrows) at 1.1272, sited a few points north of resistance priced in at 1.1239.
In the event of a downturn, Quasimodo support is seen at 1.0630, with a violation revealing a potential 161.8% AB=CD correction at 1.0539.
H4 perspective:
Friday exhibited a subdued tone, with most major banks closed in observance of Good Friday. The US consumer price index revealed prices fell 0.4% in March, a touch weaker than the -0.3% month-on-month figure expected.
Technical studies have the H4 candles hovering above 1.09, though struggling to make headway through 1.0950. The US dollar index, or DXY, on the other hand, approached levels south of 99.50 on Friday.
While a retreat back to 1.09 may take shape, the 1.1045/1.10 (yellow) area of resistance could act as a magnet to price and eventually tug things higher. 1.1045/1.10 is comprised of March and April’s opening levels at 1.1045 and 1.1023, a 161.8% Fibonacci extension point at 1.1020, a 61.8% Fibonacci retracement at 1.1003 and the key figure 1.10.
Areas of consideration:
The H4 resistance at 1.1045/1.10, as aired above, contains a number of key levels, therefore potentially making it a point of interest for many traders this week. What’s also notable is we have a possible H4 AB=CD correction in motion which terminates around 1.0991. In addition, daily resistance at 1.0995 converges closely, adding to its bearish presence. Both levels form a few points south of the current H4 resistance area.
Should we pullback from current prices, a retest at 1.09 is also feasible which could, owing to room seen on the higher timeframes to advance, provide a platform for buyers. Upside targets from this region are, logically speaking, likely set around the 1.10ish region.
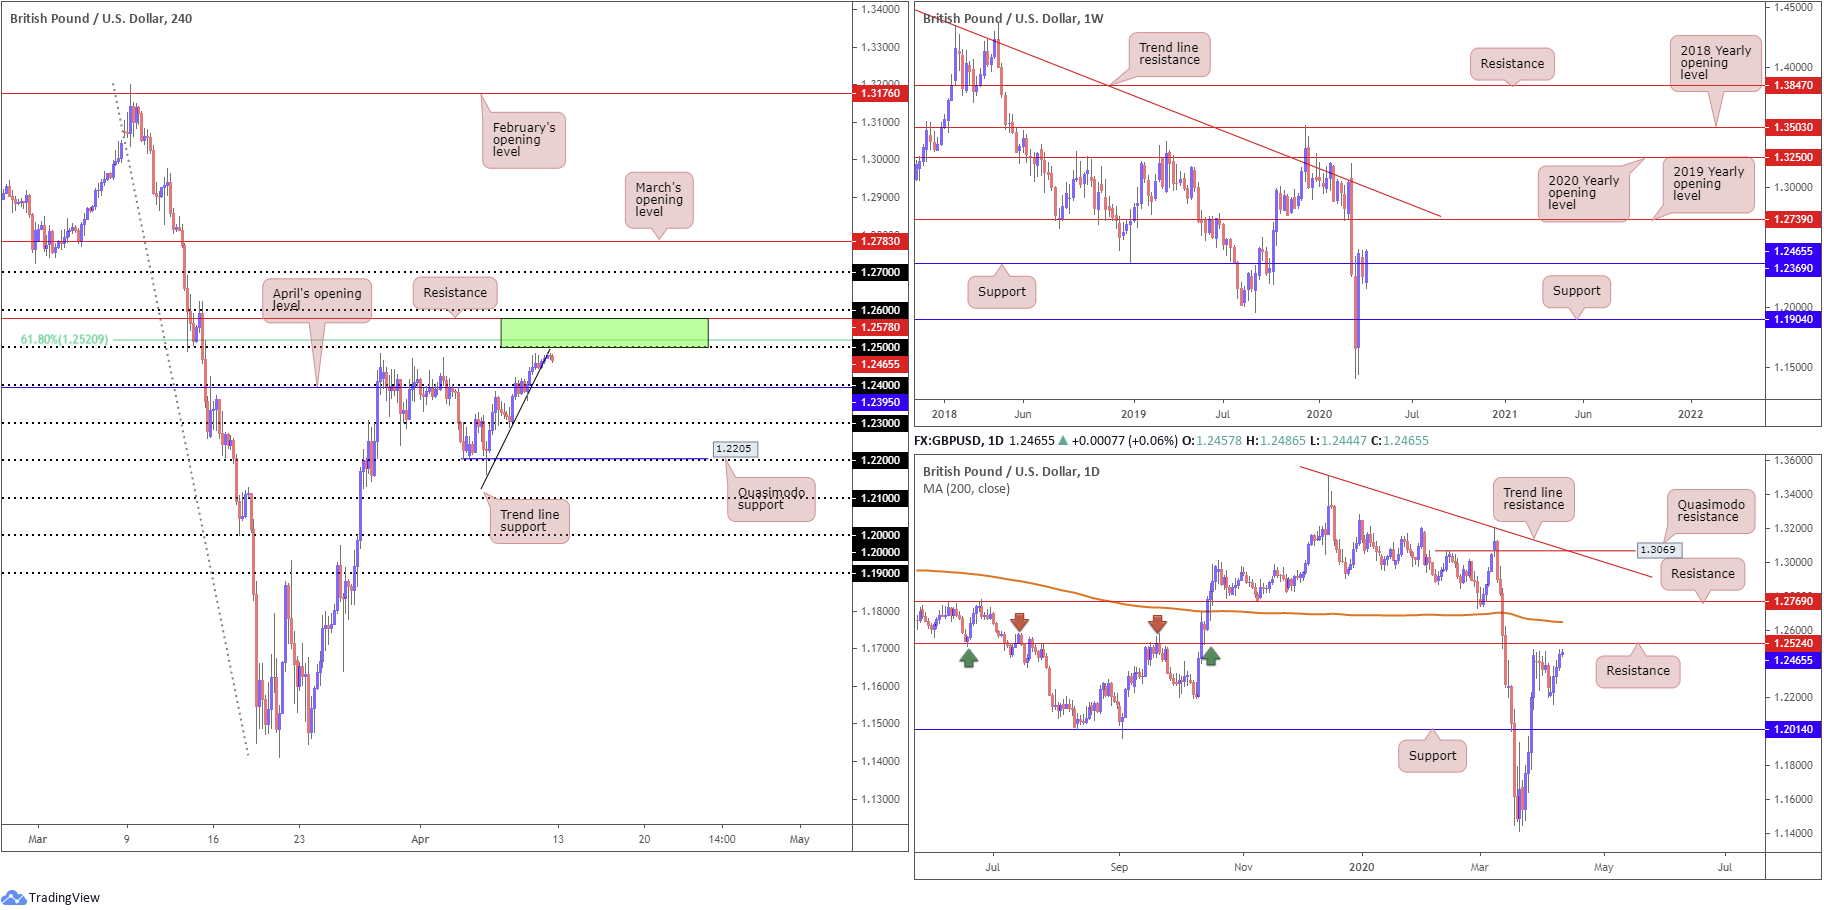
GBP/USD:
Weekly gain/loss: +1.65%
Weekly close: 1.2465
Weekly perspective:
Longer-term flow, over the course of last week, submerged resistance at 1.2369 (now a serving support), with the possibility of 1.2739 making an appearance this week, the 2019 yearly opening level. This is followed closely by long-term trend line resistance, taken from the high 1.5930.
Daily perspective:
GBP/USD retained a reasonably strong underlying bid last week, following Tuesday’s clear-cut outside day candlestick pattern off lows at 1.2163.
The key observation on the daily timeframe is resistance at 1.2524, a level boasting strong historical significance (arrows). It’s also worth pointing out we have a 200-day SMA (orange – 1.2648) lurking nearby, which, since mid-March, has been drifting lower.
H4 perspective:
Cable marginally extended its weekly recovery Friday, albeit closing a touch below Thursday’s high at 1.2484. The unabated USD selling lifted GBP/USD to just south of the 1.25 handle. Note also 1.25 comes together with a 61.8% Fibonacci retracement at 1.2520 and resistance from 1.2578. This remains an interesting technical base, having seen the daily timeframe also plot resistance around 1.2524.
Another point worth highlighting on the H4 timeframe is the recent break of a local trend line support, extended from the low 1.2163. Does this imply we’re heading lower prior to testing 1.25/1.2578 (green)?
Areas of consideration:
1.25/1.2578, based on the H4 timeframe, is a potentially significant area this week for sellers, housing a number of key technical resistances. 1.24, according to chart studies presented here, represents a logical downside target.
Moves through 1.26 this week, nevertheless, shines the spotlight on the 200-day SMA as the next possible hurdle, followed by 1.27.
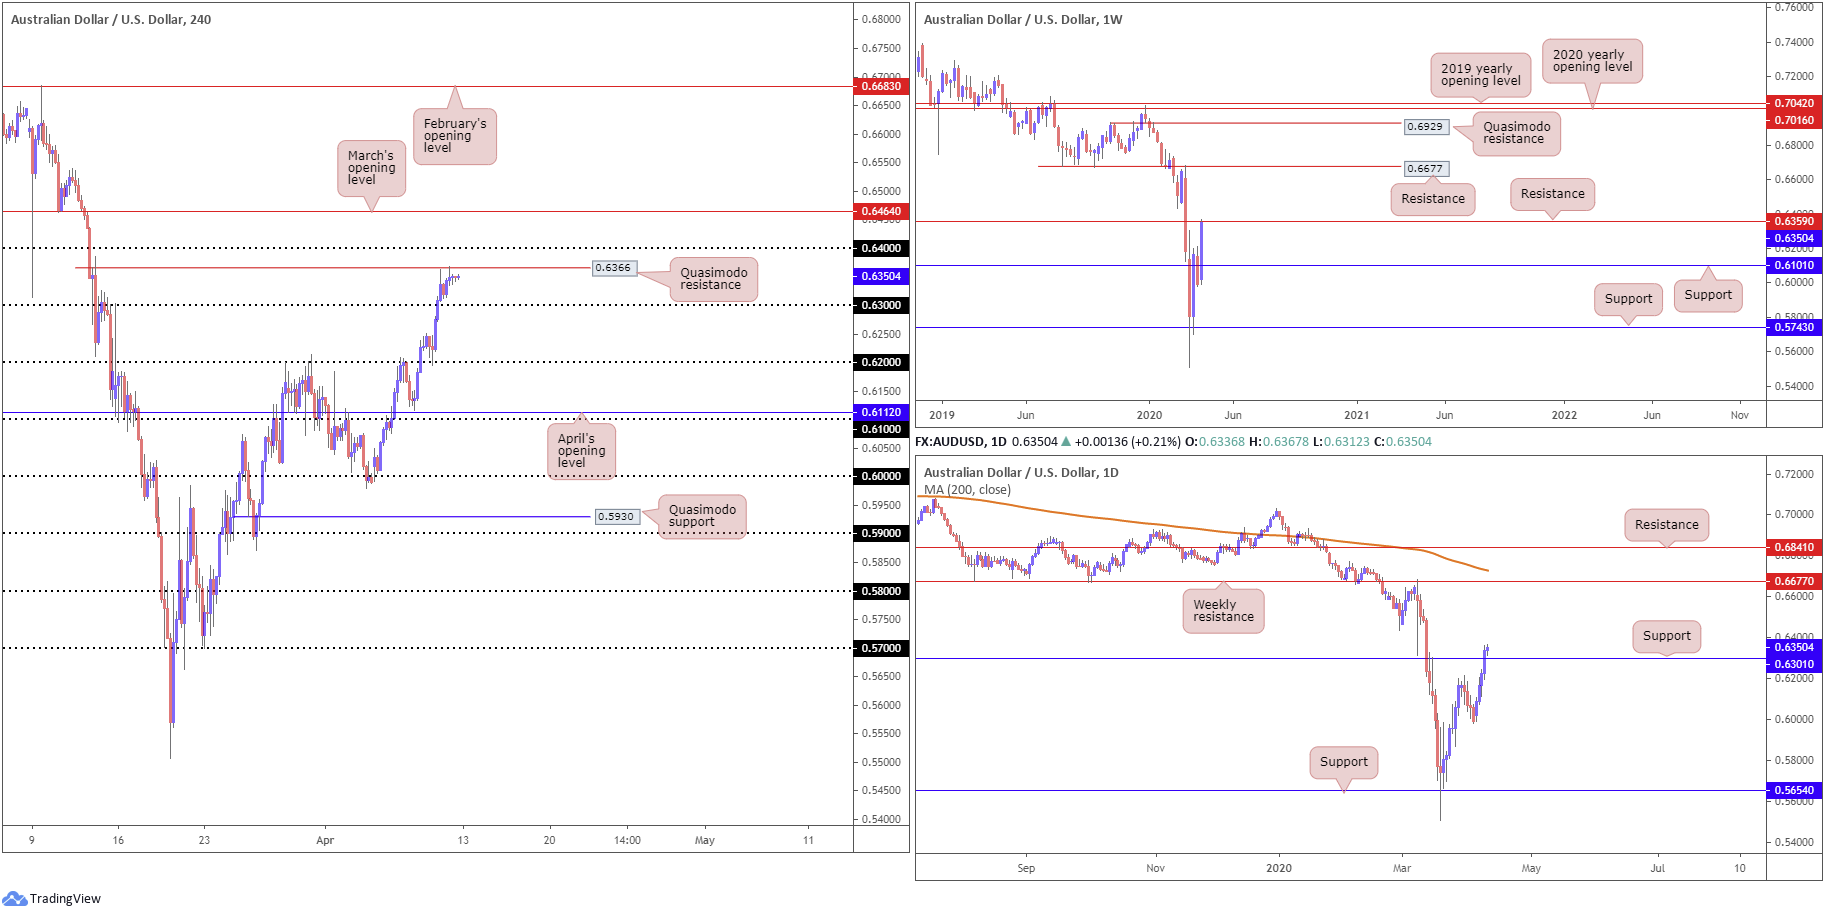
AUD/USD:
Weekly gain/loss: +6.00%
Weekly close: 0.6350
Weekly perspective:
Shaped by way of a near-full-bodied bullish candle, the AUD/USD quote put up healthy gains last week, gleaning weighty support on the back of the dollar’s demise.
Adding more than 350 points, resistance at 0.6359 elbowed its way into the spotlight. With history dating as far back as the year 2000, this level deserves acknowledgement.
Daily perspective:
The story on the daily timeframe, however, can see the bulls attempting to establish a presence above resistance at 0.6301 (now labelled as support). Thursday’s close above this base certainly places a question mark on the validity of weekly resistance at 0.6359. In fact, many may see this as the forerunner to moves towards weekly resistance at 0.6677 – the next upside target on the weekly timeframe.
H4 perspective:
From an intraday view, price action on the H4 timeframe clashed with Quasimodo resistance at 0.6366 Friday and formed a visible selling wick, after clearing orders from 0.63 Thursday. Traders will also note the 0.64 handle lurks a touch above this base, with a break revealing March’s opening level around 0.6464.
Areas of consideration:
Having noted weekly resistance at 0.6359 putting in an appearance, along with H4 Quasimodo resistance at 0.6366 in play, the possibility of a move through the 0.63 handle towards 0.62 is perhaps achievable this week. Assuming this comes to fruition, it might imply the break above daily resistance at 0.6301 may have simply been a whipsaw to trip buy-stop liquidity to fund moves lower.
Conservative sellers may wait and see if price has enough oomph to dive through 0.63 before committing; others may feel Friday’s H4 selling wick off 0.6366 might suffice. Either way, the 0.62 handle offers a logical (initial) downside target to work with.
Failure at weekly resistance, however, could see a run through 0.64, potentially setting the stage for breakout buying towards March’s opening level at 0.6464.
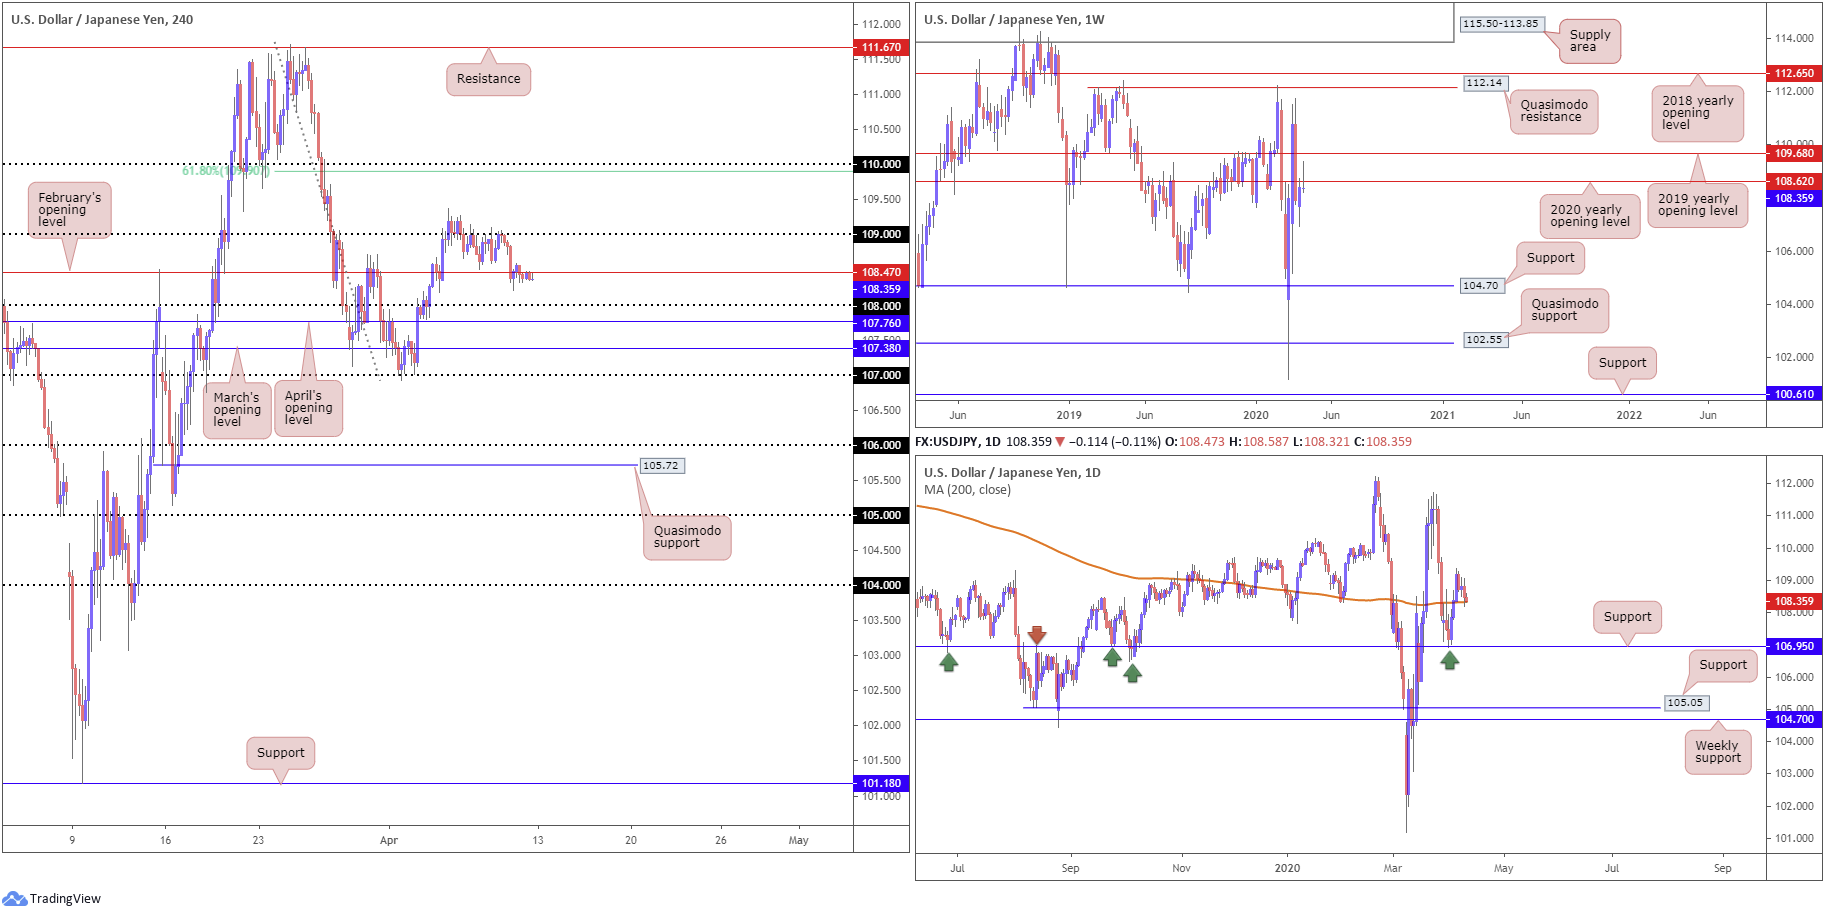
USD/JPY:
Weekly gain/loss: FLAT
Weekly close: 108.35
Weekly perspective:
Concluding the week in the form of a clear-cut shooting star candlestick configuration, weekly price may seek ground south of the 2020 yearly opening level at 108.62 going forward.
What’s also notable from a technical perspective on the weekly timeframe is the lack of support; the next downside target is not seen until 104.70. Note this figure also represents the lower boundary of a multi-month range between Quasimodo resistance at 112.14.
Daily perspective:
From the daily timeframe, the pair recently shook hands with a 200-day SMA (orange – 108.33), which could hamper weekly sellers south of 108.62. Should we conquer the said SMA value, nonetheless, traders will be watching for a run to support coming in at 106.95, a level emphasising strong history (arrows).
H4 perspective:
Price took on more of a sober tone Friday as markets welcomed holiday-thinned trade.
Recent movement dipped a toe in waters south of February’s opening level at 108.47 following moves off 109, with price shortly after retesting the underside of 108.47 as resistance. Contact with the 108 handle this week is achievable, closely shadowed by March and April’s opening levels at 107.38 and 107.76. 107.76, in fact, is aptly positioned to welcome a whipsaw through 108 for a potential intraday bounce higher. Psychological levels, as most are aware, are prone to fakeouts.
Areas of consideration:
Although daily price tests the 200-day SMA, higher-timeframe movement usually takes precedence. As such, weekly price holding its stance beneath 108.62 may be enough to entice further selling over the coming weeks.
February’s opening level at 108.47, therefore, remains a potential contender as resistance, though sellers may also want to pencil in the possibility of a fakeout forming to 108.62 (resistance on the weekly timeframe) before serious sellers step in. As underlined above, 108 offers an initial downside target, with the possibility of moves to 107.76 and 107.38 on the H4 timeframe.
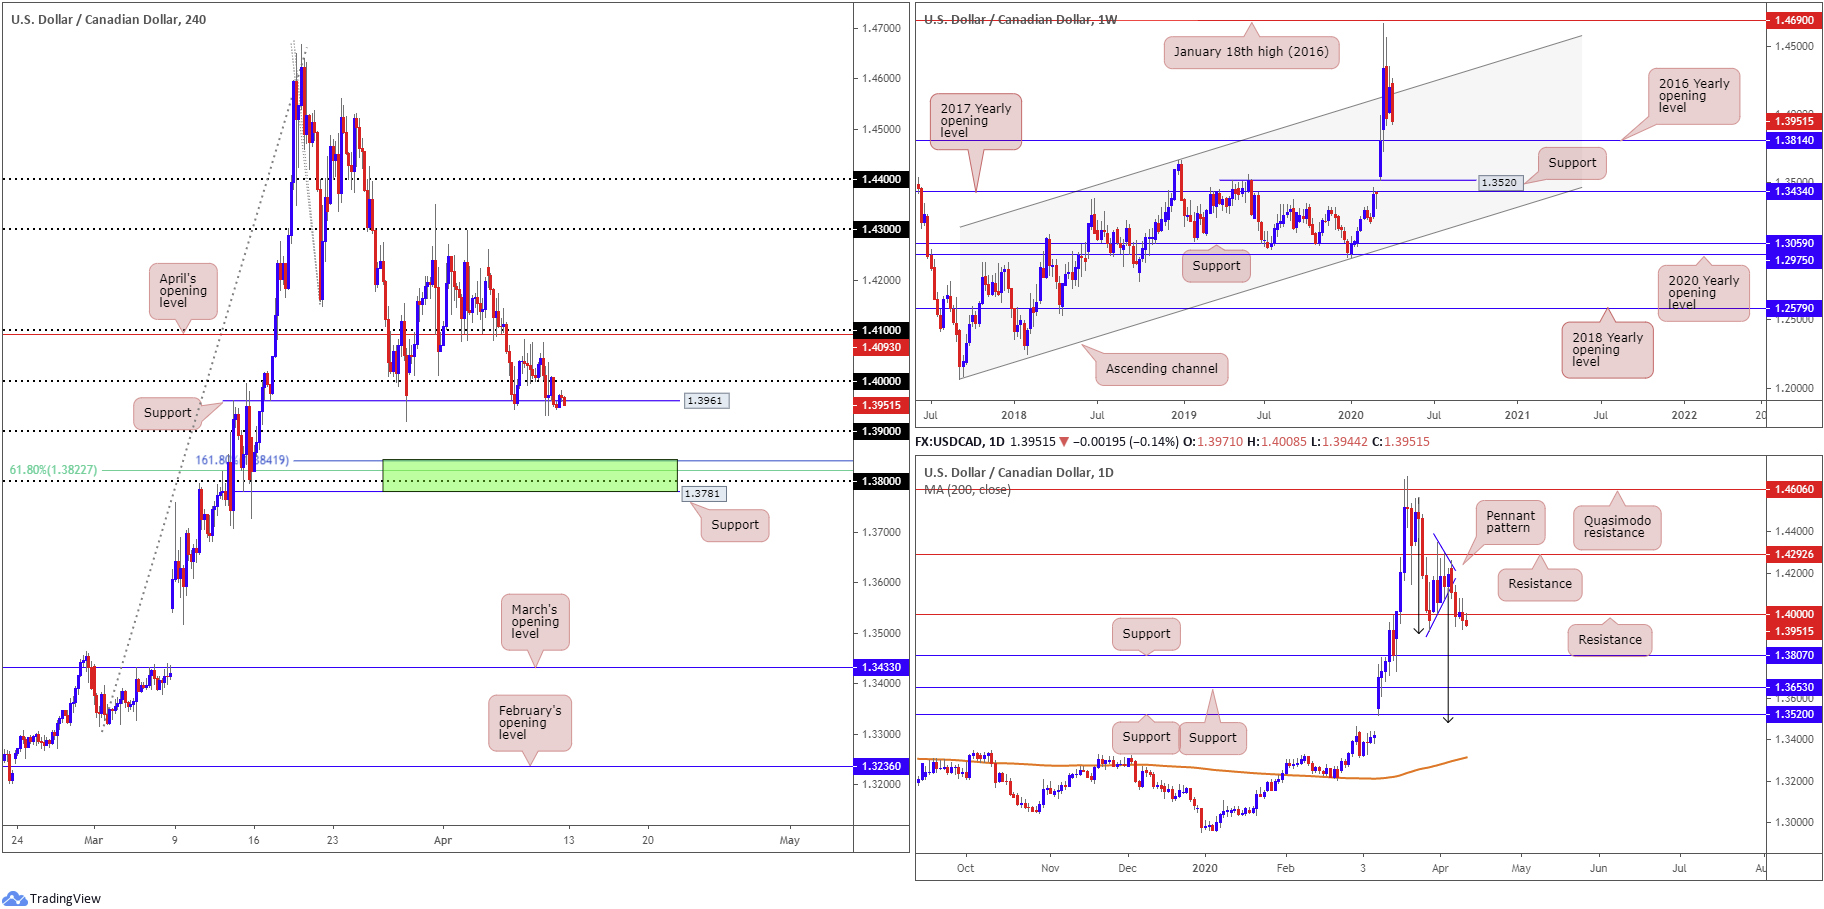
USD/CAD:
Weekly gain/loss: -1.73%
Weekly close: 1.3951
Weekly perspective:
Erasing in excess of 240 points, USD/CAD fashioned an attractive bearish engulfing candlestick formation last week. Technical studies also show the unit clearing space south of a channel resistance, extended from the high 1.3661, with the 2016 yearly opening level at 1.3814 noted as a possible downside target this week.
Daily perspective:
Pattern traders will recognise the recently formed bearish pennant formation (1.4349/1.4011) had its lower edge breached in the early stages of the week. Support at 1.4000 (now labelled resistance) received price action mid-week and while the pair attempted to hold ground, buyers eventually lost grip and tested lows at 1.3931.
The take-profit target for the bearish pennant pattern is set around 1.3482, measured by taking the preceding move prior to the pattern formation and adding this value to the breakout point (black arrows). This implies the support at 1.3807 and 1.3653 may give way this week.
H4 perspective:
Ranging between 1.4008/1.3944, H4 price action established a minor position beneath the key figure 1.40 Friday. Support at 1.3961, as you can see, remains in the frame though appears fragile, threatening moves to 1.39 and, with a little oomph, 1.3781-1.3841 (comprised of a H4 support level at 1.3781, the 1.38 handle, a 61.8% Fibonacci retracement ratio at 1.3822 and a 161.8% Fibonacci extension point at 1.3841 [green zone]).
Airspace above 1.40 appears reasonably free until reaching tops around 1.4076, followed by April’s opening level at 1.4093 and the 1.41 handle.
Areas of consideration:
Having seen daily price recently break out of a bearish pennant formation, with plenty of room to the downside until crossing swords with its take-profit target around 1.3482, alongside weekly action pointing to a move towards 1.3814, this remains a sellers’ market for the time being, according to chart studies.
Bearish scenarios off the underside of 1.40 on the H4 timeframe are an option if the number is retested this week, targeting 1.39 as the initial take-profit zone, followed by the H4 support zone mentioned above at 1.3781-1.3841. Failing a retest of 1.40, traders may consider bearish themes under H4 support at 1.3961.
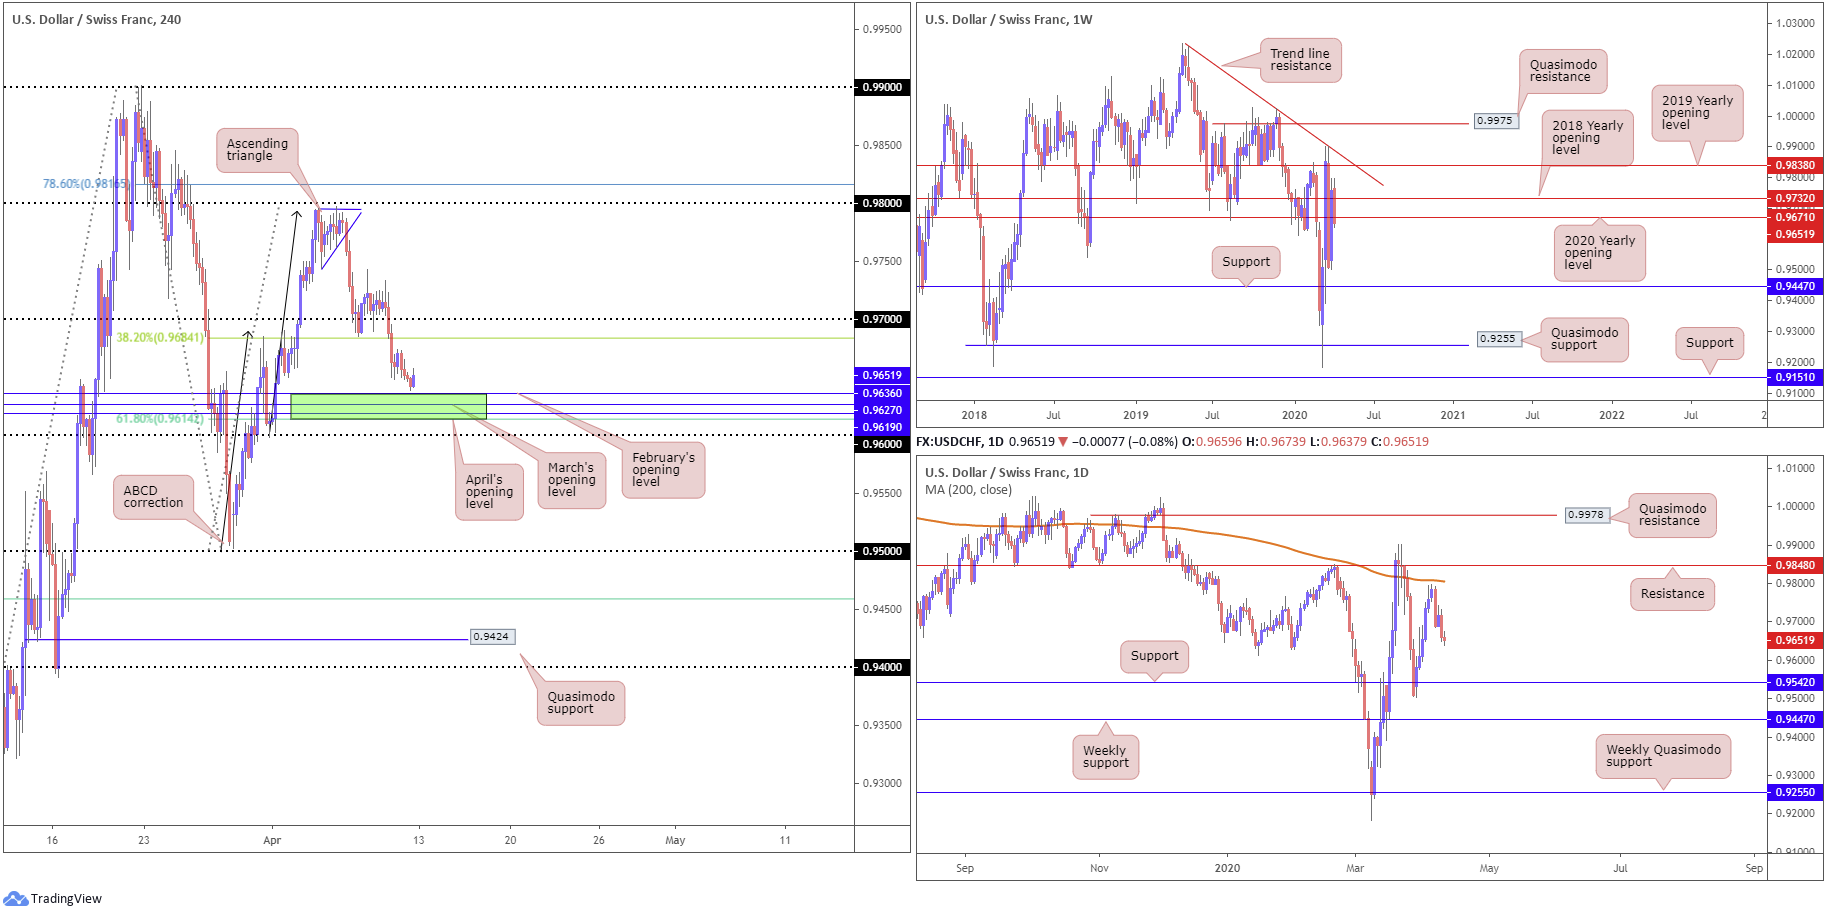
USD/CHF:
Weekly gain/loss: -1.10%
Weekly close: 0.9651
Weekly perspective:
USD/CHF failed to build on recent gains, leaving the 2019 yearly opening level at 0.9838 and nearby trend line resistance, taken from the high 1.0226, unchallenged.
Last week’s candle crossed back beneath the 2018 yearly opening level at 0.9732 and also tapped waters just south of the 2020 yearly opening level at 0.9671, consequently drawing support at 0.9447 back into the zone of possibility.
Daily perspective:
Closer analysis of price action on the daily timeframe reveals the pair establishing a position beneath the 200-day SMA (orange – 0.9805), with the possibility of a run to support at 0.9542. Interestingly, the said support resides just ahead of weekly support highlighted above at 0.9447.
H4 perspective:
Like most markets Friday, price action emphasised a reasonably muted tone on the H4 timeframe.
H4 price, after testing an ABCD bearish completion (black arrows) from 0.9794, shattered the lower boundary of an ascending triangle formation and made a run for the 0.97 boundary, reinforced closely by a 38.2% Fibonacci retracement at 0.9684 (a traditional take-profit target out of ABCD formations). Upside attempts from here were capped from 0.9725, with the unit navigating lower levels Thursday, drawing price towards an interesting combination of monthly opening levels from April, March and February at 0.9619, 0.9627 and 0.9636, respectively. Note this area closely connects with the 61.8% Fibonacci retracement at 0.9614 – considered the second take-profit target out of the said ABCD pattern.
Areas of consideration:
Although lacking higher-timeframe support (the higher-timeframes actually suggest we could be heading lower),
0.9614/0.9636 is an interesting area of H4 support likely on the watchlists of many traders this week. Containing a number of monthly opening levels and a 61.8% Fibonacci support, this zone not only offers a take-profit target for any shorts beneath 0.97, but also a platform for buyers to possibly enter the market. Traders are, however, urged to pencil in the possibility of a fakeout to 0.96 before serious buyers step in.
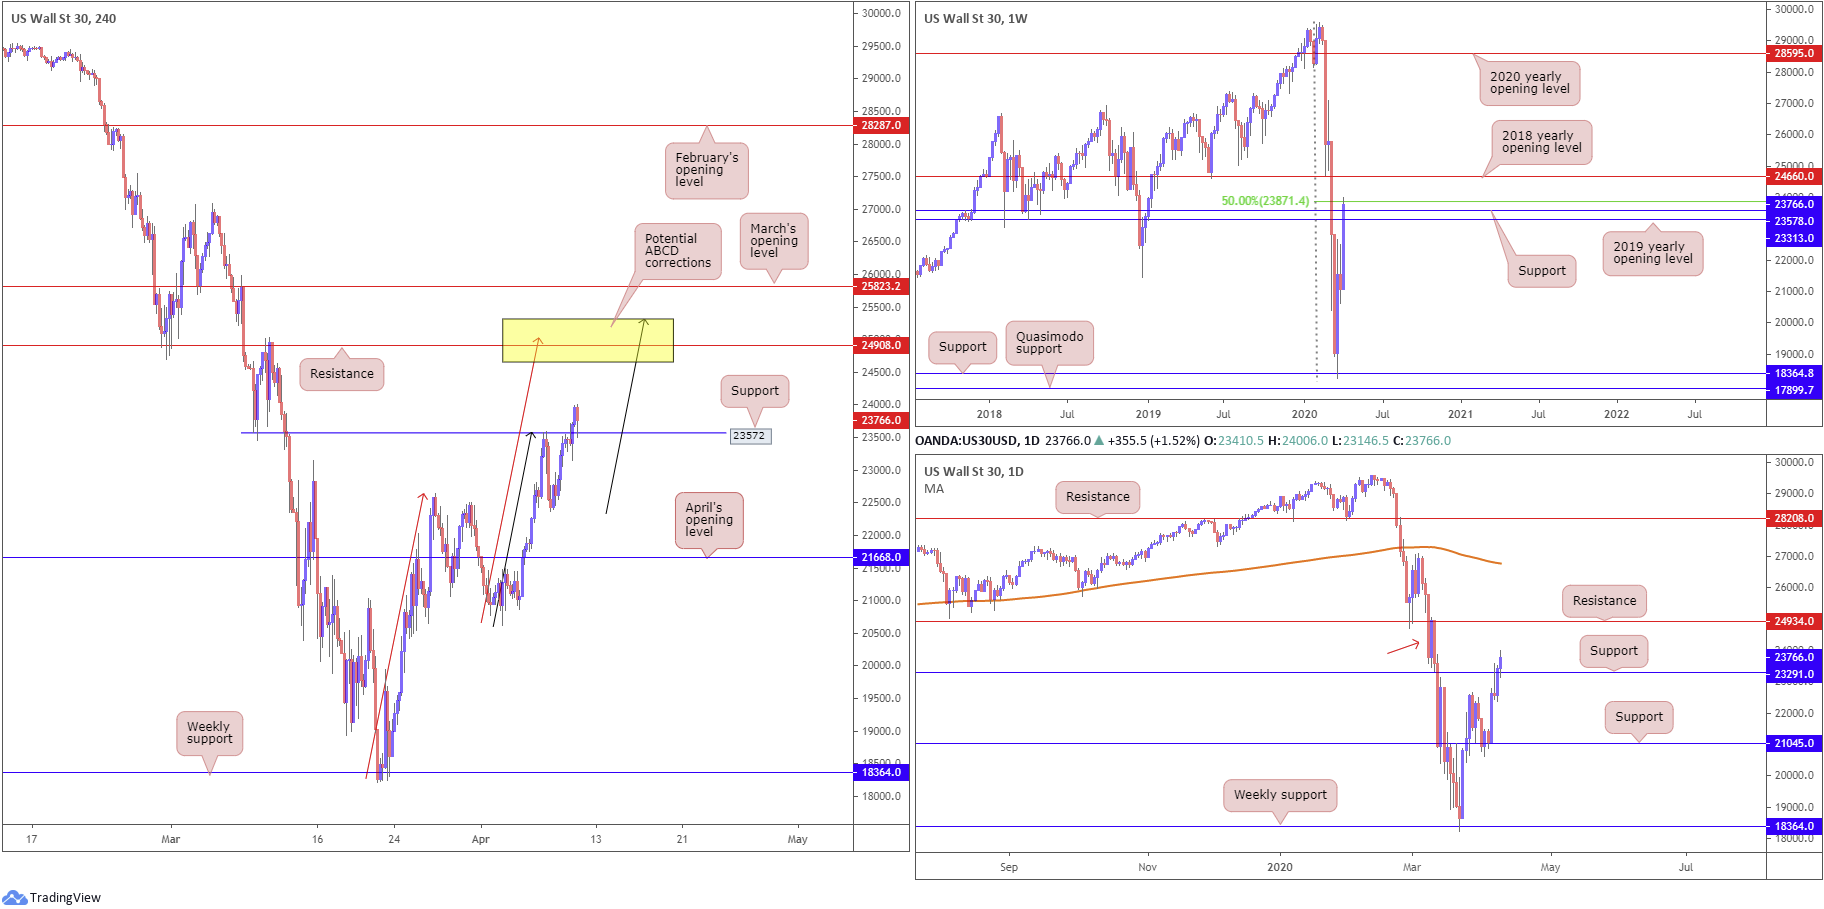
Dow Jones Industrial Average:
Weekly gain/loss: +12.85%
Weekly close: 23766
Weekly perspective:
Up more than 2700 points, the 2019 yearly opening level at 23313 and a resistance level coming in at 23578 were both taken out, leaving a 50% retracement ratio at 23871 free to enter the fold at the closing stages of the week.
With the possibility of 23313/23578 serving as support this week, a retest of the latter could materialise. Sustained upside may draw price towards the 2018 yearly opening level at 24660.
Daily perspective:
A closer reading of price movement on the daily timeframe reveals resistance at 23291 surrendered on Thursday, clearing the pathway north for buyers to retest the said base Friday and challenge highs at 24006.
To the left of current price around 25000/23776, denoted by a red arrow, we have potential supply in the mix, with resistance also located at 24934.
It may also interest some traders to note the 200-day SMA (orange – 26778) has been drifting lower since mid-March.
H4 perspective:
Despite Wednesday’s reasonably firm retreat from 23572, price action recovered strongly into the week’s close, breaching 23572 and retesting the base as support.
This could be enough to encourage additional upside this week, targeting resistance coming in at 24908, followed by two potential ABCD completions at 25028 (red arrows) and 25317 (black arrows). Note this area also houses daily resistance at 24934 and boasts a close connection to weekly resistance in the form of the 2018 yearly opening level at 24660.
Areas of consideration:
Given the number of technical levels converging between 25317/24660 (yellow), this will likely garner interest this week. Not only is the area an ideal take-profit zone for longs off H4 support at 23572, the area also offers a base for potential bearish scenarios.
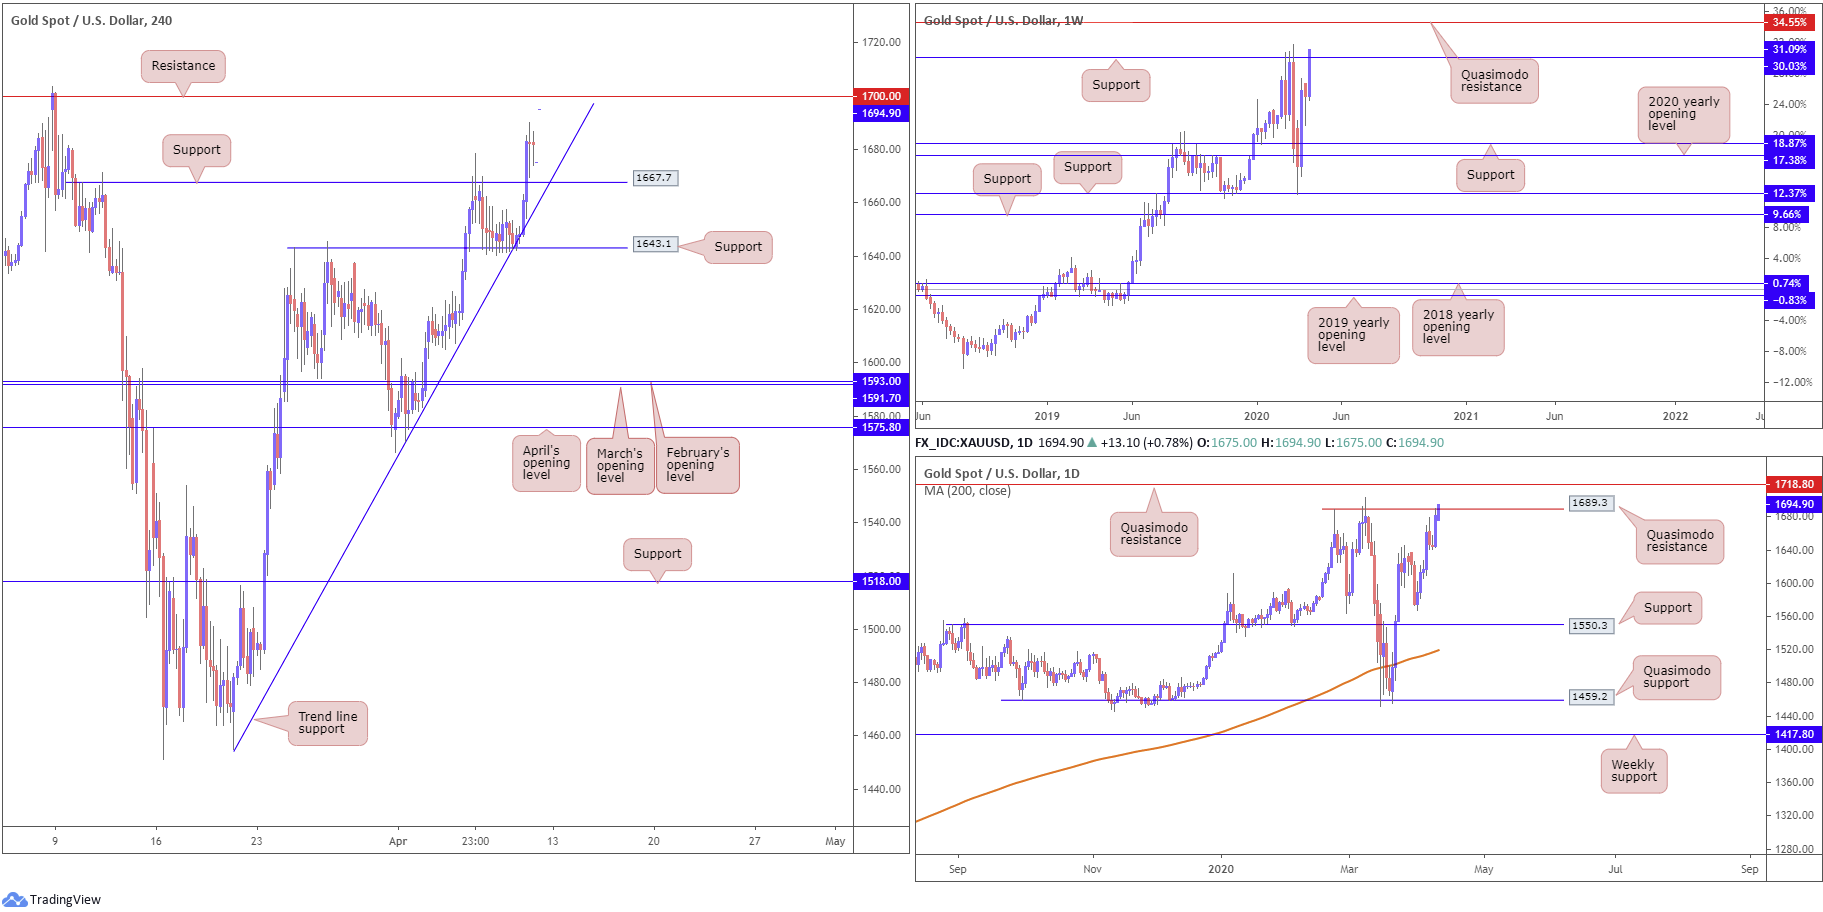
XAU/USD (GOLD):
Weekly gain/loss: +4.86%
Weekly close: 1694.9
Weekly perspective:
Closing the week at its highs amid broad dollar weakness, bullion finally conquered resistance at 1681.1. Should buyers remain on the offensive going forward the yellow metal may find itself facing Quasimodo resistance at 1739.6, a level extended from November 2012. At the same time, however, the possibility of a minor pullback/retest at 1681.1 could be seen before a resurgence of bidding takes over.
Daily perspective:
Quasimodo resistance at 1689.3 entered view on the daily timeframe; sellers, however, have yet to show much interest. This potentially turns the spotlight over to another layer of Quasimodo resistance at 1718.8 this week.
H4 perspective:
Technical development on the H4 timeframe had price action recently rebound from a point of confluence, containing support at 1643.1 and a trend line support, taken from the low 1479.1, which broke through resistance at 1667.7 (now a serving support).
Resistance at 1700.0 is seen nearby, a level that firmly capped upside in early March.
Areas of consideration:
Given the recent breach of weekly resistance at 1681.1, and sellers showing little enthusiasm off daily Quasimodo resistance at 1689.3, early week is likely to see a move towards 1700.0.
A break of 1700.0 is what most are likely watching for this week. A decisive push north of the said level opens the doors for potential intraday buying opportunities to the daily Quasimodo resistance at 1718.8, followed by a possible run to weekly Quasimodo resistance at 1739.6.
The accuracy, completeness and timeliness of the information contained on this site cannot be guaranteed. IC Markets does not warranty, guarantee or make any representations, or assume any liability regarding financial results based on the use of the information in the site.
News, views, opinions, recommendations and other information obtained from sources outside of www.icmarkets.com.au, used in this site are believed to be reliable, but we cannot guarantee their accuracy or completeness. All such information is subject to change at any time without notice. IC Markets assumes no responsibility for the content of any linked site.
The fact that such links may exist does not indicate approval or endorsement of any material contained on any linked site. IC Markets is not liable for any harm caused by the transmission, through accessing the services or information on this site, of a computer virus, or other computer code or programming device that might be used to access, delete, damage, disable, disrupt or otherwise impede in any manner, the operation of the site or of any user’s software, hardware, data or property.


