
Key risk events today:
BoE Gov Bailey Speaks.
(Previous analysis as well as outside sources – italics).
EUR/USD:
Weekly gain/loss: +0.98%
Weekly close: 1.1829
Weekly perspective:
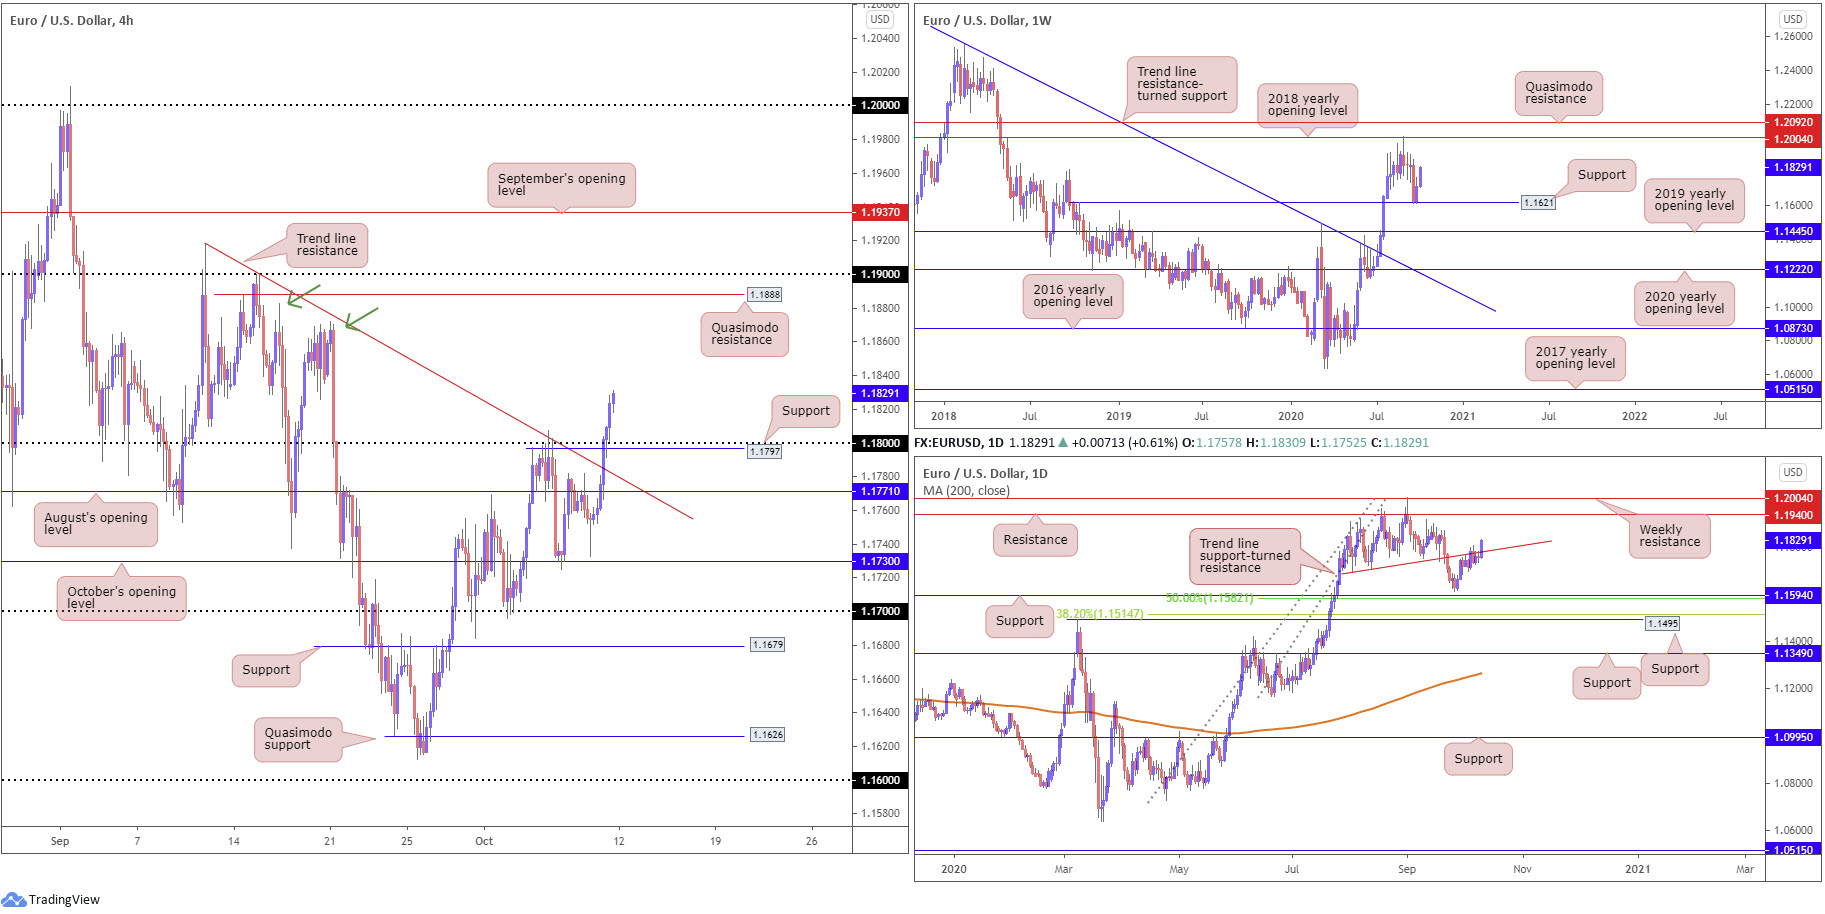
Stirred by the US dollar index receding to levels not seen since September 21 (in danger of potentially losing 93.00 status), Europe’s shared currency outperformed over the course of last week.
This, technically, saw price extend recovery gains off minor support at 1.1621, set just north of the 2019 yearly opening value at 1.1445. An extension to the upside this week potentially throws the 2018 yearly opening value at 1.2004 back into action.
Daily perspective:
Since the beginning of October, buyers and sellers have been squaring off at the underside of a trend line support-turned resistance, etched from the low 1.1695. Friday, however, closed sharply above the trend line and consequently turned the spotlight towards resistance at 1.1940.
Traders, therefore, may interpret the above (along with the weekly timeframe showing room to advance and the immediate trend facing north since March) as a signal that additional outperformance could be seen this week, until we at least test 1.1940.
H4 perspective:
As the DXY eyeballs 93.00 to the downside, tracking broad risk sentiment, EUR/USD, based on the H4 timeframe, recently overthrew August’s opening value at 1.1771, trend line resistance, taken from the high 1.1917, and the 1.18 handle.
Beyond the latter, we do not see much to hang our hat on in terms of resistance until a Quasimodo formation at 1.1888/1.19 handle makes an appearance. Peaks at 1.1871 (September 21) and 1.1882 (September 16), although feasible resistances (green arrows), are unlikely to offer much downside, as price is likely to be drawn towards the round number (1.19). Consequently, buy-stop liquidity above the aforementioned peaks may help serve any selling that materialises from the 1.19/1.1888 region.
Areas of consideration:
According to chart studies across all three timeframes, buyers have an edge heading into the second full week of October.
A retest at 1.18 (and nearby H4 support at 1.1797 [a prior Quasimodo resistance level]) could be a scenario we see unfold in the early stages of the week. A rebound from here, particularly if formed in the shape of a H4 bullish candle pattern, may lure buyers into the market for a push to the 1.1888 neighbourhood.
Traders are also reminded psychological round numbers are prone to whipsaws (some refer to this as a stop-run), due to the orders they attract. As a result, waiting for at least bullish candlestick confirmation to form might be worth considering before pulling the trigger.
GBP/USD:
Weekly gain/loss: +0.87%
Weekly close: 1.3041
Weekly perspective:
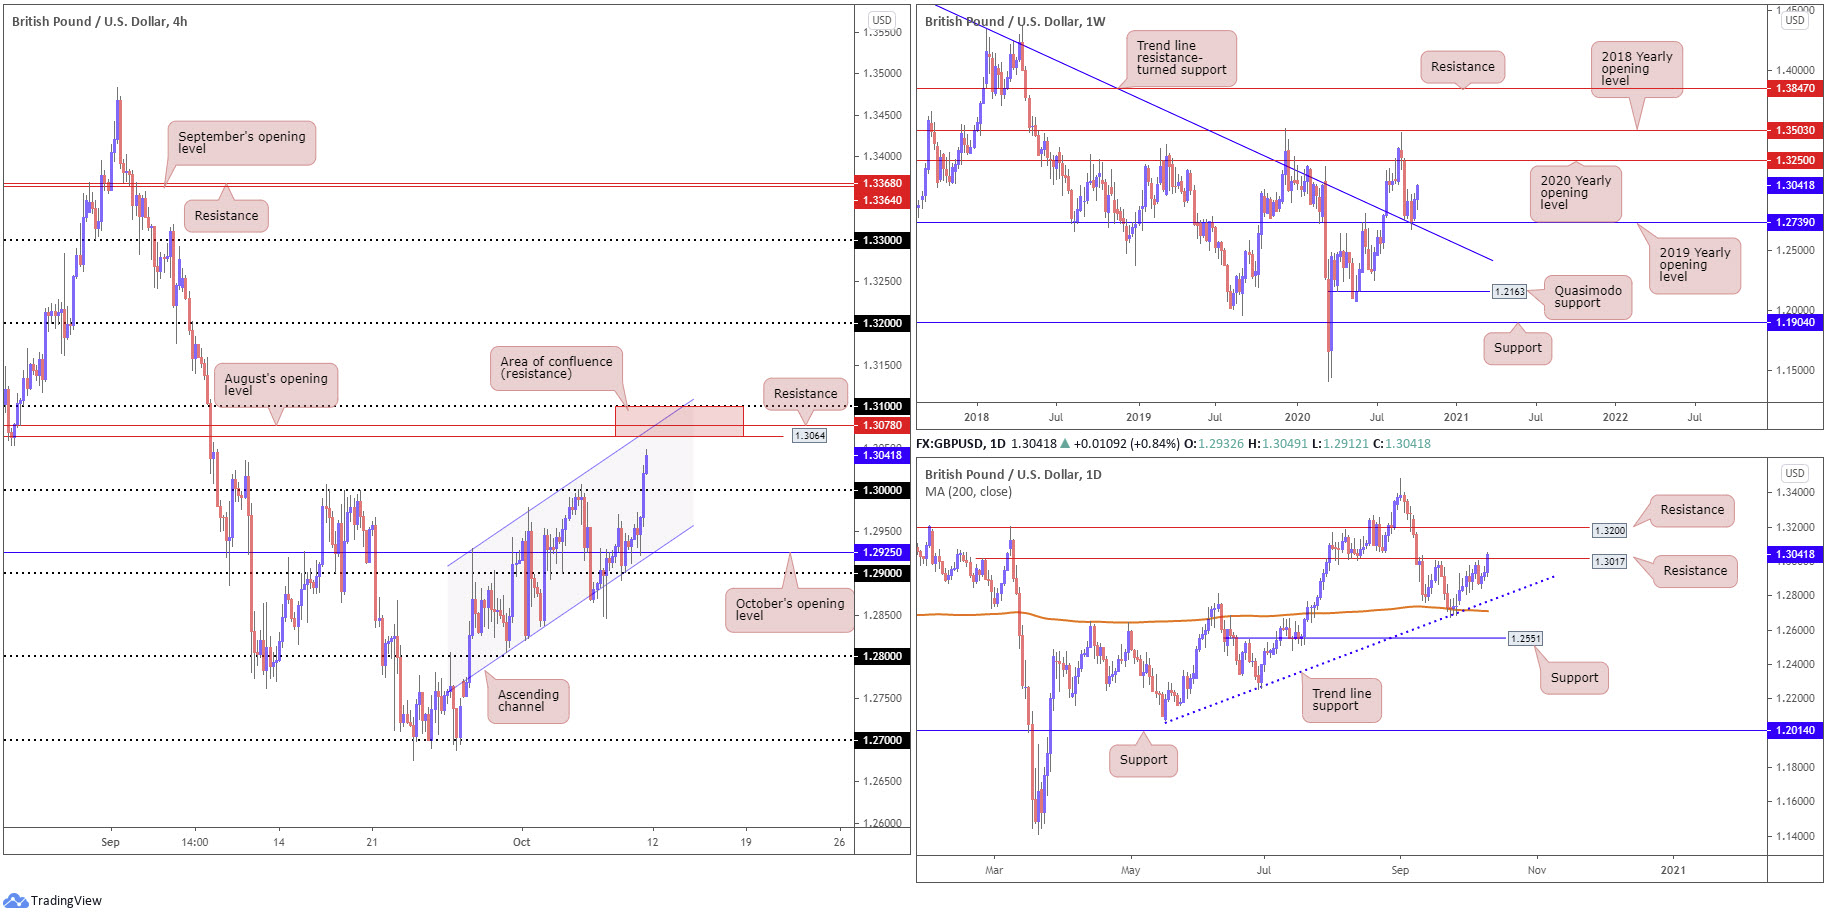
Last week observed GBP/USD extend recent recovery gains from support at 1.2739 (a 2019 yearly opening value), consequently adding another 100 points on top of the prior week’s 200-point rally. Technicians will acknowledge 1.2739 blends with trend line resistance-turned support, extended from the high 1.5930.
In terms of resistance, price has room to advance as far north as the 2020 yearly opening value at 1.3250 this week.
Daily perspective:
Since crossing swords with the 200-day SMA (orange – 1.2710) and joining trend line support, extended from the low 1.2075, nearly three weeks ago, GBP/USD bulls have mostly been on the offensive. Led by the US dollar negotiating lower levels, Friday saw sterling pop its head marginally above resistance at 1.3017.
This, when taking into account the room we have to advance on the weekly timeframe, increases the probability of further upside in GBP/USD this week, placing resistance at 1.3200 in the firing range.
H4 perspective:
Absent of Brexit developments, and risk flows weighing on the US dollar, demand for the British pound increased Friday.
Following a near-to-the-pip retest at October’s opening value at 1.2925, H4 mustered enough strength to conquer the key figure 1.30, a stubborn resistance since early September. Should buyers continue to strengthen their grip this week, the 1.31 handle (and surrounding resistance at 1.3078 [August’s opening value] in addition to resistance coming in from 1.3064 and channel resistance, drawn from the high 1.2929) is on the hit list (red area).
Areas of consideration:
Should a 1.30 retest emerge this week, in light of daily price recently taking over resistance at 1.3017 and weekly price demonstrating room to advance, this may be a welcomed sight for buyers, particularly if formed by way of a H4 bullish candlestick configuration.
On the bearish side, 1.31/1.3064 may be interpreted as a potential reversal zone. Though the area stores strong H4 confluence, it lacks higher timeframe connection. As such, a reaction from here may be short-lived, so plan accordingly.
AUD/USD:
Weekly gain/loss: +1.10%
Weekly close: 0.7239
Weekly perspective:
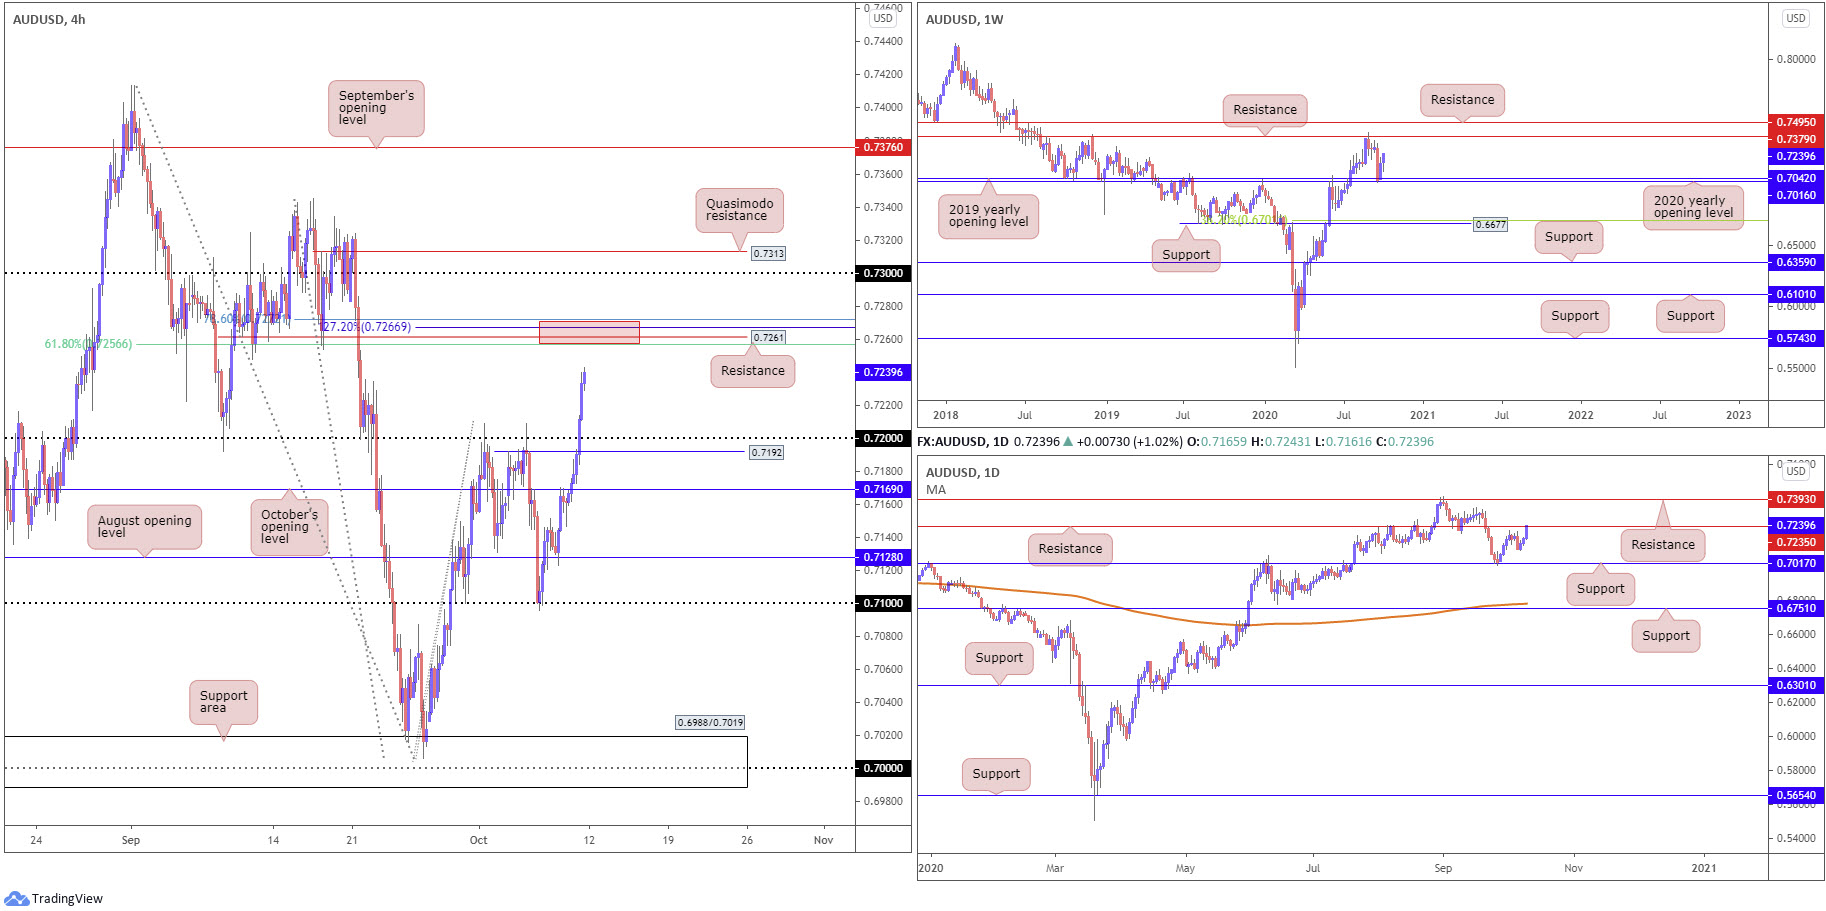
After buyers pencilled in a strong presence off the 2020 (0.7016) and 2019 (0.7042) yearly opening levels, additional upside developed last week.
Additional bullish sentiment could target as far north as resistance at 0.7379 this week. It might also be worth noting the trend in this market remains to the upside, therefore the recent rebound from 0.7016/0.7042 may have been interpreted as a dip-buying signal.
Daily perspective:
Despite a reasonably clear run higher on the weekly timeframe, daily flow must contend with resistance at 0.7235. This level boasts a reasonably solid history, therefore active selling could materialise. While downside attempts from the level are unlikely to reach this far south (in view of the weekly timeframe’s position and the current trend pointing higher since March), 0.7017 is noted as the next potential support target.
Filling buy-stop liquidity north of resistance at 0.7235 could motivate moves to resistance at 0.7393 (located a touch above weekly resistance at 0.7379).
H4 perspective:
Heavy USD downside Friday amidst reasonably upbeat risk sentiment led AUD/USD above the 0.72 handle in dominant fashion.
Although daily price is toying with resistance at 0.7235, an interesting H4 resistance is seen around 0.7272/0.7256 (red – composed of a 78.6% Fibonacci retracement ratio at 0.7272, a 127.2% Fibonacci extension point at 0.7266, a resistance level at 0.7261 and a 61.8% Fibonacci retracement ratio at 0.7256).
Areas of consideration:
Downside pressure from daily resistance at 0.7235 could force a 0.72 H4 retest in early trading this week. It is also worth factoring in H4 support at 0.7192, considering round numbers tend to attract fakeouts. With the weekly timeframe poised to explore higher levels, 0.72 may be viewed as a bullish reversal zone this week, targeting the H4 resistance area at 0.7272/0.7256 (beyond current daily resistance).
Failing to pullback and revisit 0.72, H4 resistance at 0.7272/0.7256 is then likely to make a show quicker than anticipated. Although built strongly on the H4 chart, the weekly and daily (after breaking 0.7235 resistance) timeframes are likely to eventually pull things beyond here. For that reason, bearish themes from H4 resistance could be brief.
USD/JPY:
Weekly gain/loss: +0.27%
Weekly close: 105.59
Weekly perspective:
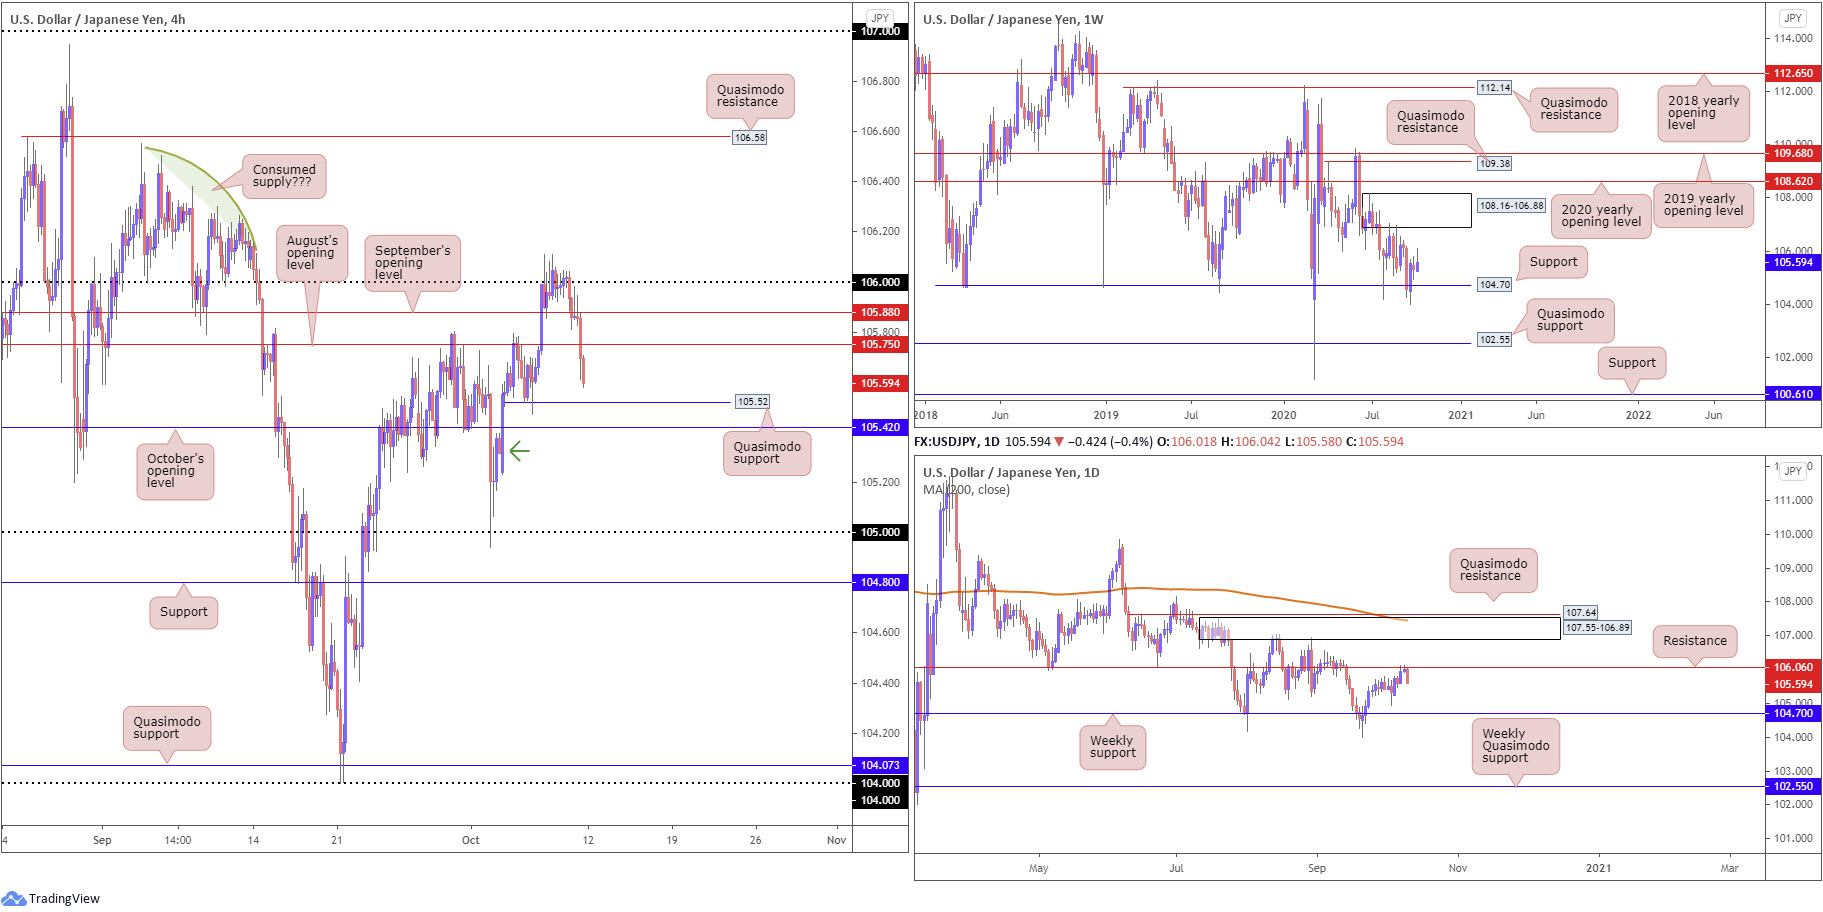
Support at 104.70 remains a watched level on the weekly timeframe, particularly after recently welcoming a 1% rebound. Supply at 108.16-106.88 also remains prominent, capping upside since early August.
Both areas, therefore, remain firmly on the watchlist this week.
Quasimodo support at 102.55 offers a feasible target beyond current support in the event we turn south, while removing supply draws the 2020 yearly opening value at 108.62 into the fight.
Daily perspective:
Mid-week shook hands with resistance at 106.06, a level that was mostly ignored since serving as support during May and June. Friday’s strong bearish presence may see sellers take aim at the weekly support level mentioned above at 104.70.
Alternatively, if resistance at 106.06 gives way, supply at 107.55-106.89, an area housed within the lower boundary of weekly supply underlined above at 108.16-106.88, is seen. Of note, the daily area also benefits from nearby Quasimodo resistance at 107.64 and the 200-day SMA (orange – 107.45).
H4 perspective:
A broadly lower buck sent USD/JPY spiralling south on Friday, following numerous attempts to topple the 106 handle on Wednesday/Thursday. September’s opening value from 105.88 and August’s opening value at 105.75put up little fight. In fact, the former served as resistance heading into US hours.
Quasimodo support at 105.52 and October’s opening value pinned just beneath at 105.42 are next in line, with a break exposing minor demand around 105.35ish (green arrow) and the 105 neighbourhood.
Areas of consideration:
H4 Quasimodo support at 105.52 and October’s opening value at 105.42 are two levels intraday buyers may find of interest, potentially containing enough energy to force a 105.75 retest (August’s opening value).
Though should the pair explore deeper waters, bearish scenarios found under 105.42 could form to target 105, as well as H4 support at 104.80, which, of course, is situated just north of weekly support at 104.70.
USD/CAD:
Weekly gain/loss: -1.43%
Weekly close: 1.3115
Weekly perspective:
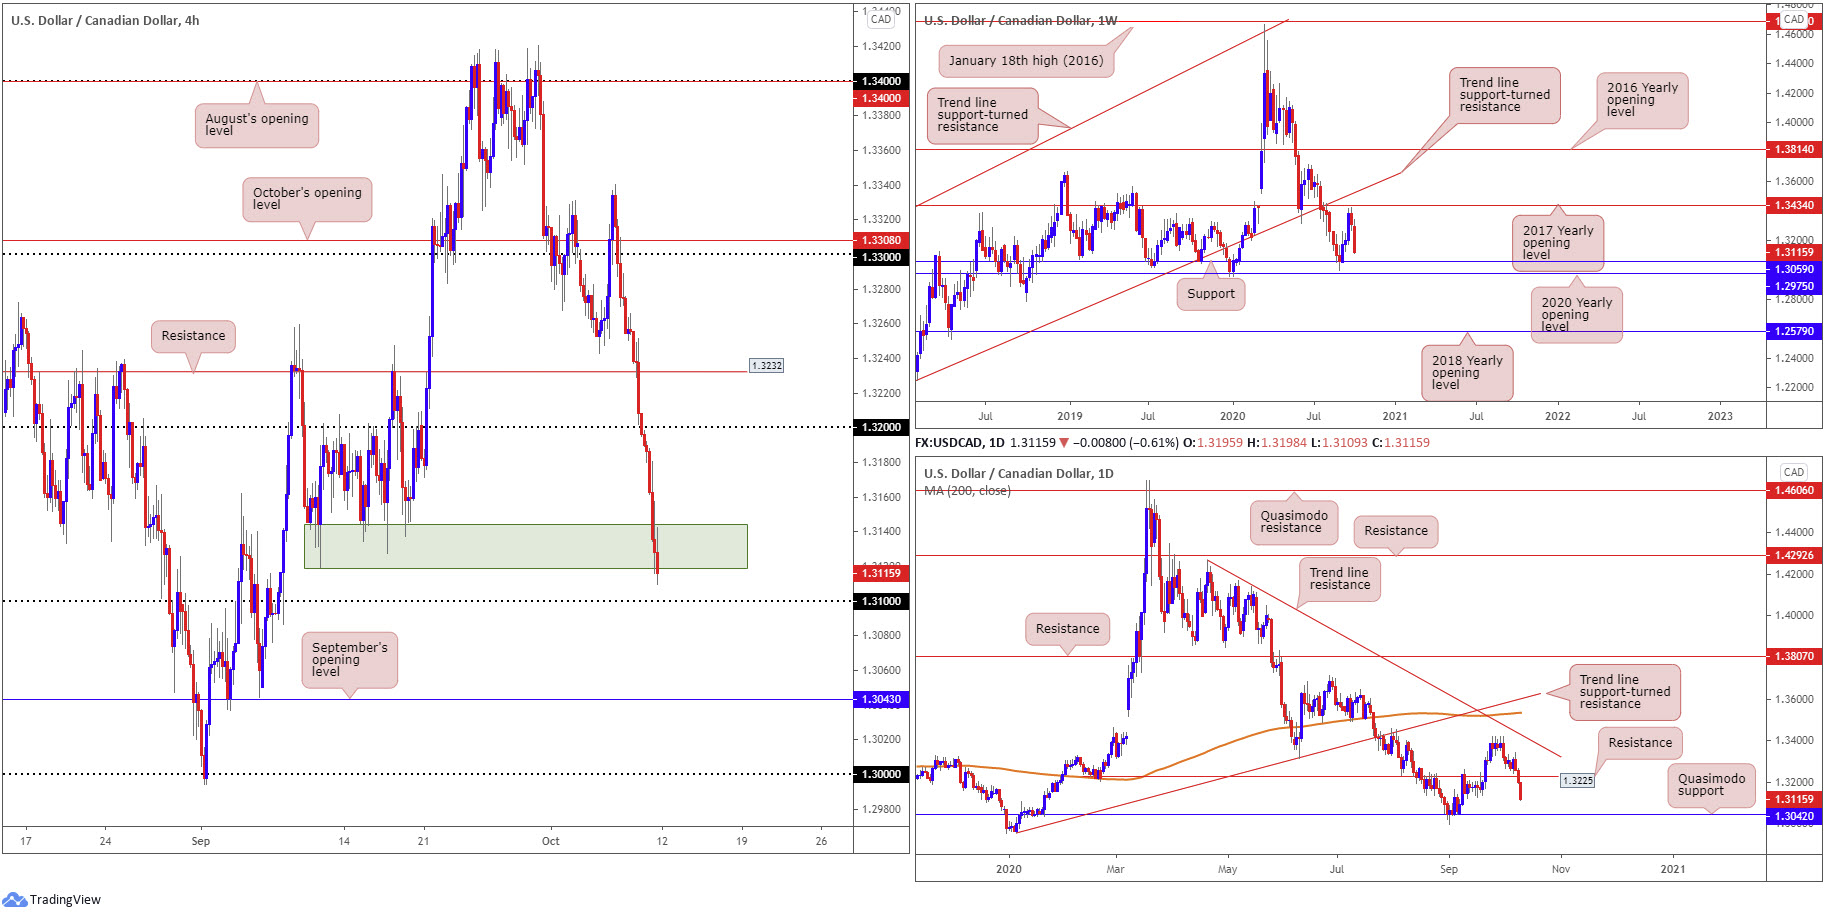
After snapping a three-week bullish phase south of the 2017 yearly opening value at 1.3434 (sited just under trend line support-turned resistance, taken from the low 1.2061), USD/CAD experienced hefty selling.
Recent weakness has generated enough impetus to throw 1.3059 back into the pot as potential support this week, closely shadowed by the 2020 yearly opening value at 1.2975.
Interestingly, should we eventually puncture the 1.2951 December 30 low (2019), stops (placed by trend traders) are likely to come under fire and exacerbate downside.
Daily perspective:
Navigating terrain under support at 1.3225 (now serving as resistance) Thursday, as you can see, provoked further selling Friday. While we cannot rule out the possibility of fresh upside attempts, the absence of obvious support until reaching the Quasimodo formation at 1.3042 could promote selling in the early stages of the week.
H4 perspective:
Already down on the day by 30 points, upbeat Canadian employment numbers exacerbated selling Friday and guided H4 candles deep into an area of support around 1.3130 (green), closely followed by the 1.31 handle.
While a rebound from the aforementioned supports is not out of the question (targeting 1.32ish) this week, sliding through the 1.31 level unlocks the possibility of further deterioration to September’s opening value at 1.3043 and maybe even the key figure 1.30.
Areas of consideration:
On account of both weekly and daily price displaying elbow room to retreat further this week, a 1.31 breach on the H4 timeframe should not surprise, a move that may trigger a bearish setting towards September’s opening value at 1.3043 (H4).
1.3043, in addition to weekly support priced in at 1.3059 and a daily Quasimodo support at 1.3042, serves as a robust downside target for short positions. Equally, the area may also appeal to buyers.
USD/CHF:
Weekly gain/loss: -1.19%
Weekly close: 0.9092
Weekly perspective:
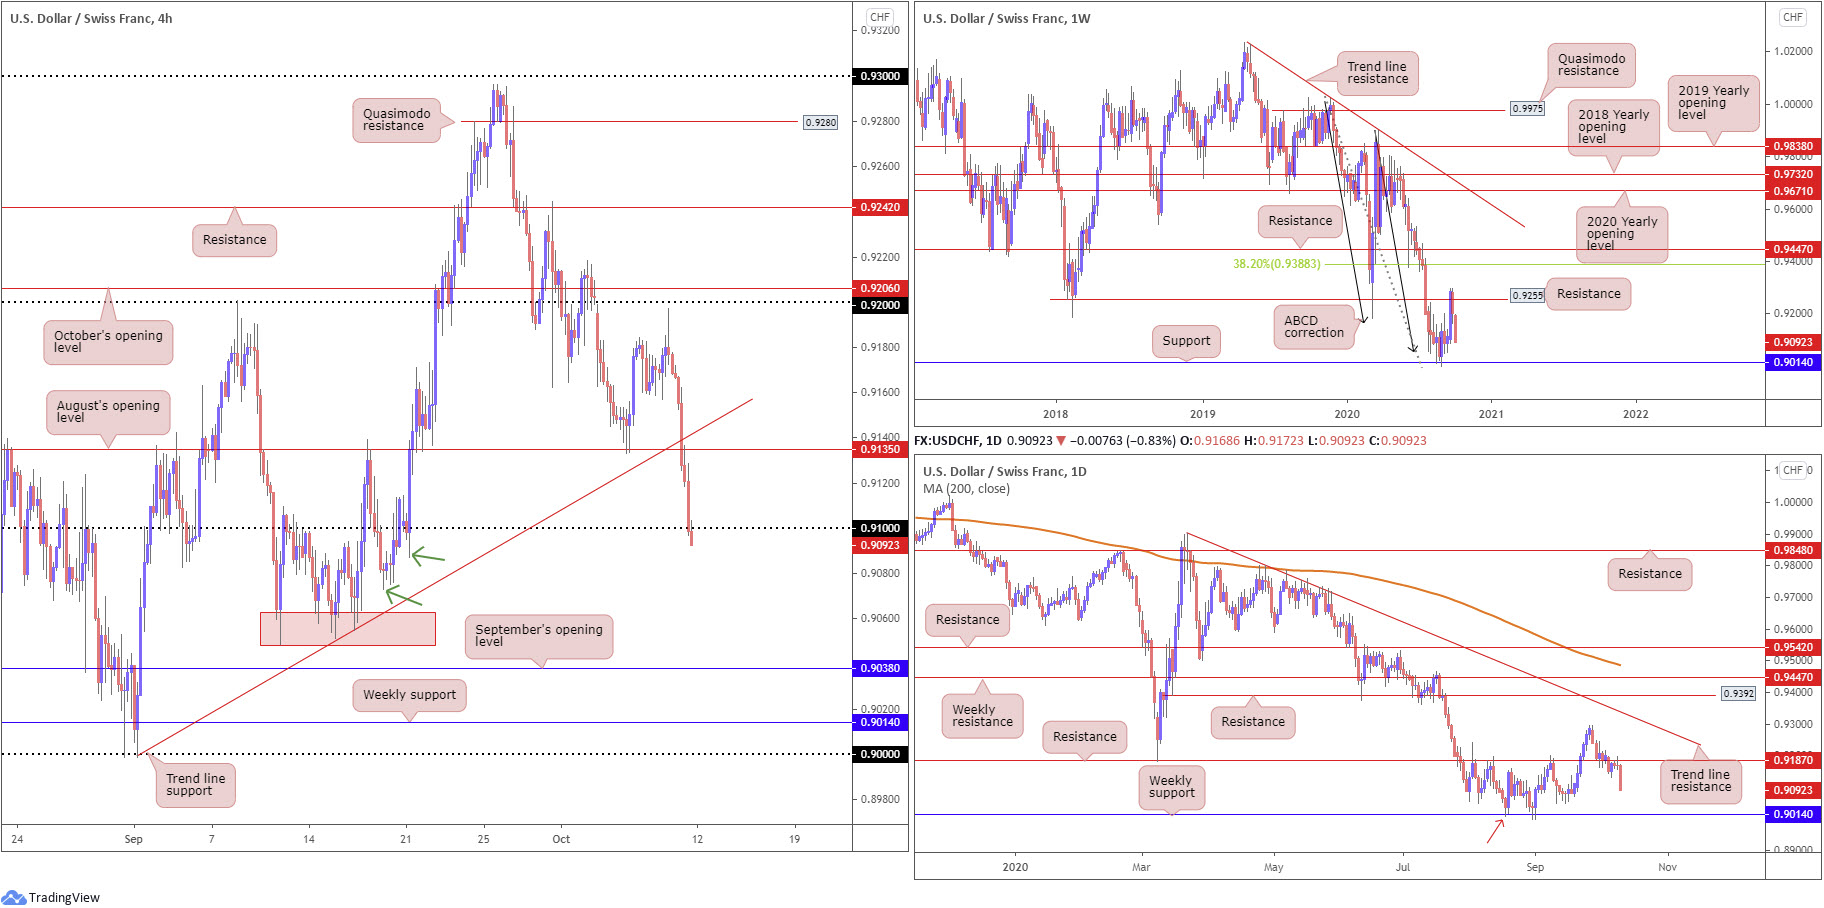
After joining resistance at 0.9255 (a previous Quasimodo support level) buyers took a step back, consequently establishing two back-to-back near-full-bodied bearish candles.
As a result, support at 0.9014, as well as ABCD support at 0.9051 (black arrows), is turf that may be retested this week.
It is also worth noting USD/CHF has traded lower since topping in April 2019.
Daily perspective:
A closer examination of price action on the daily timeframe reveals the unit retested resistance from 0.9187, a critical S/R level during August and September. Despite stationary movement mid-week, Friday turned aggressively lower and pencilled in a near-full-bodied bearish candle.
Dropping through 0.9187 in early trading last week (as support) and serving as resistance suggests further weakness on the weekly timeframe. What’s interesting is daily price also has weekly support at 0.9014 in its sights, though on the daily chart also represents a Quasimodo support (red arrow).
H4 perspective:
Amid broad USD softness, USD/CHF traded on the backfoot Friday, darting through August’s opening value at 0.9135 and trend line support, etched from the low 0.8998. 0.91 also came under attack. With demand to the left of current price appearing consumed/fragile (note the possible consumption tails at 0.9087 and 0.9073 – green arrows), traders may feel a push for 0.9060 support (red) or September’s opening value at 0.9038 could be on the cards.
Areas of consideration:
With H4 showing little intent of holding 0.91, traders will likely interpret this weakness as an indication to pursue bearish themes, targeting 0.9060/0.9038. Downside movement below 0.91 is in line with both weekly and daily charts also showing room to discover deeper terrain.
Whether we reach this far south this week or not is difficult to judge, though it is worth noting that the key figure 0.90 (positioned under September’s opening value on the H4) shares a close bond with weekly support at 0.9014. As a result, short positions are likely to be wary of this area. Equally, prospective buyers may find use in the zone.
Dow Jones Industrial Average:
Weekly gain/loss: +3.26%
Weekly close: 28666
Weekly perspective:
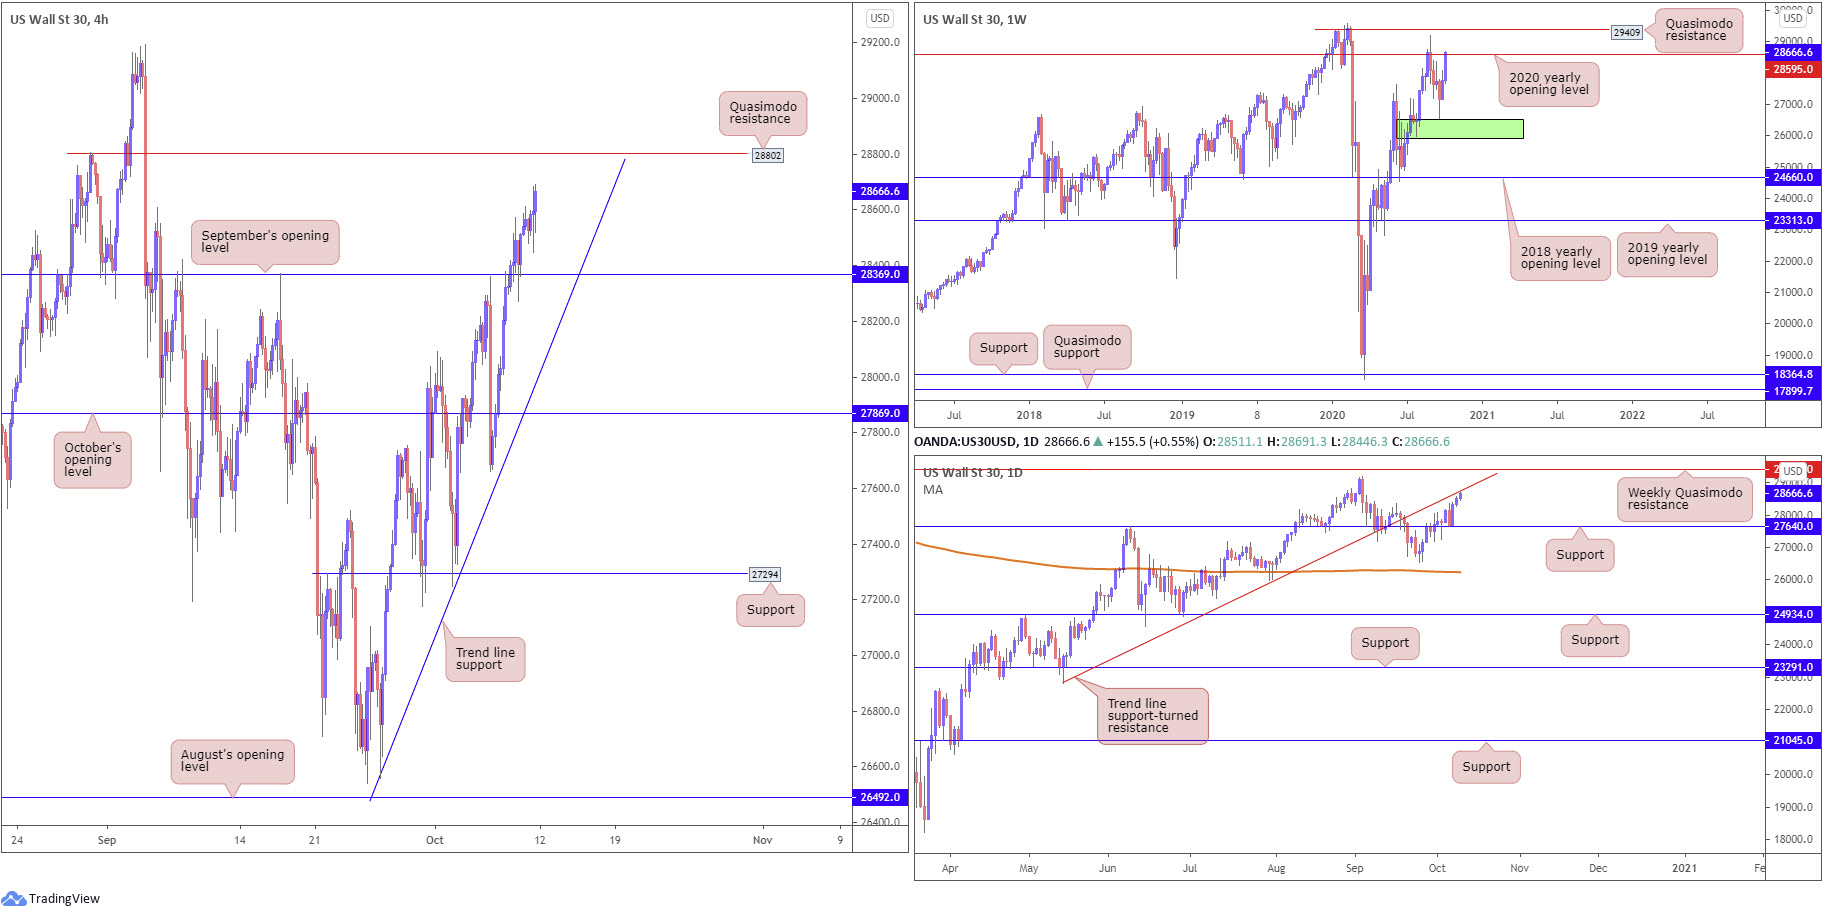
Following a somewhat energetic spike to lows at 26541 on September 24, missing demand (green) at 25916-26523 by a hair, sellers handed the baton to buyers and have recently engaged (and mildly surpassed) the 2020 yearly opening value at 28595.
Quasimodo resistance at 29409 is seen as the next potential hurdle before we’re clear to attack all-time peaks at 29595 set in early February.
Daily perspective:
Before traders start loading up on long positions, daily price must first contend with trend line support-turned resistance, extended from the low 22803.
A rejection from the aforementioned trend line this week has support at 27640 to target, while continuation buying above the trend line offers buyers an early signal we’re likely headed for the weekly Quasimodo resistance mentioned above at 29409.
H4 perspective:
US equity benchmarks ended Friday higher, with the Dow Jones Industrial Average printing a third positive session in a row. The Dow advanced 161.39 points, or 0.57%; the S&P 500 climbed 30.30 points, or 0.88% and the Nasdaq traded higher by 158.96 points, or 1.39%.
H4, as you can see, recently made headway north of September’s opening value at 28369. The retest of the monthly level on Thursday prompted follow-through buying on Friday, enough to draw Quasimodo resistance at 28802 back in sight.
Areas of consideration:
Although weekly price nudged above the 2020 yearly opening value at 28595, movement is still restricted on the daily timeframe by way of trend line support-turned resistance, extended from the low 22803. This is a tricky situation for traders.
Before sellers make a stand (if at all), H4 Quasimodo resistance at 28802 could make an appearance. The move higher to reach the said level could also form a bull trap on the weekly timeframe above 28595 if sellers hold the resistances. However, it may just as easily trap sellers off the resistances if weekly buyers make a push.
Technically speaking, this, despite a clear uptrend, is a tricky market to read at the moment in regards to its structure.
XAU/USD (GOLD):
Weekly gain/loss: +1.65%
Weekly close: $1,930
Weekly perspective:
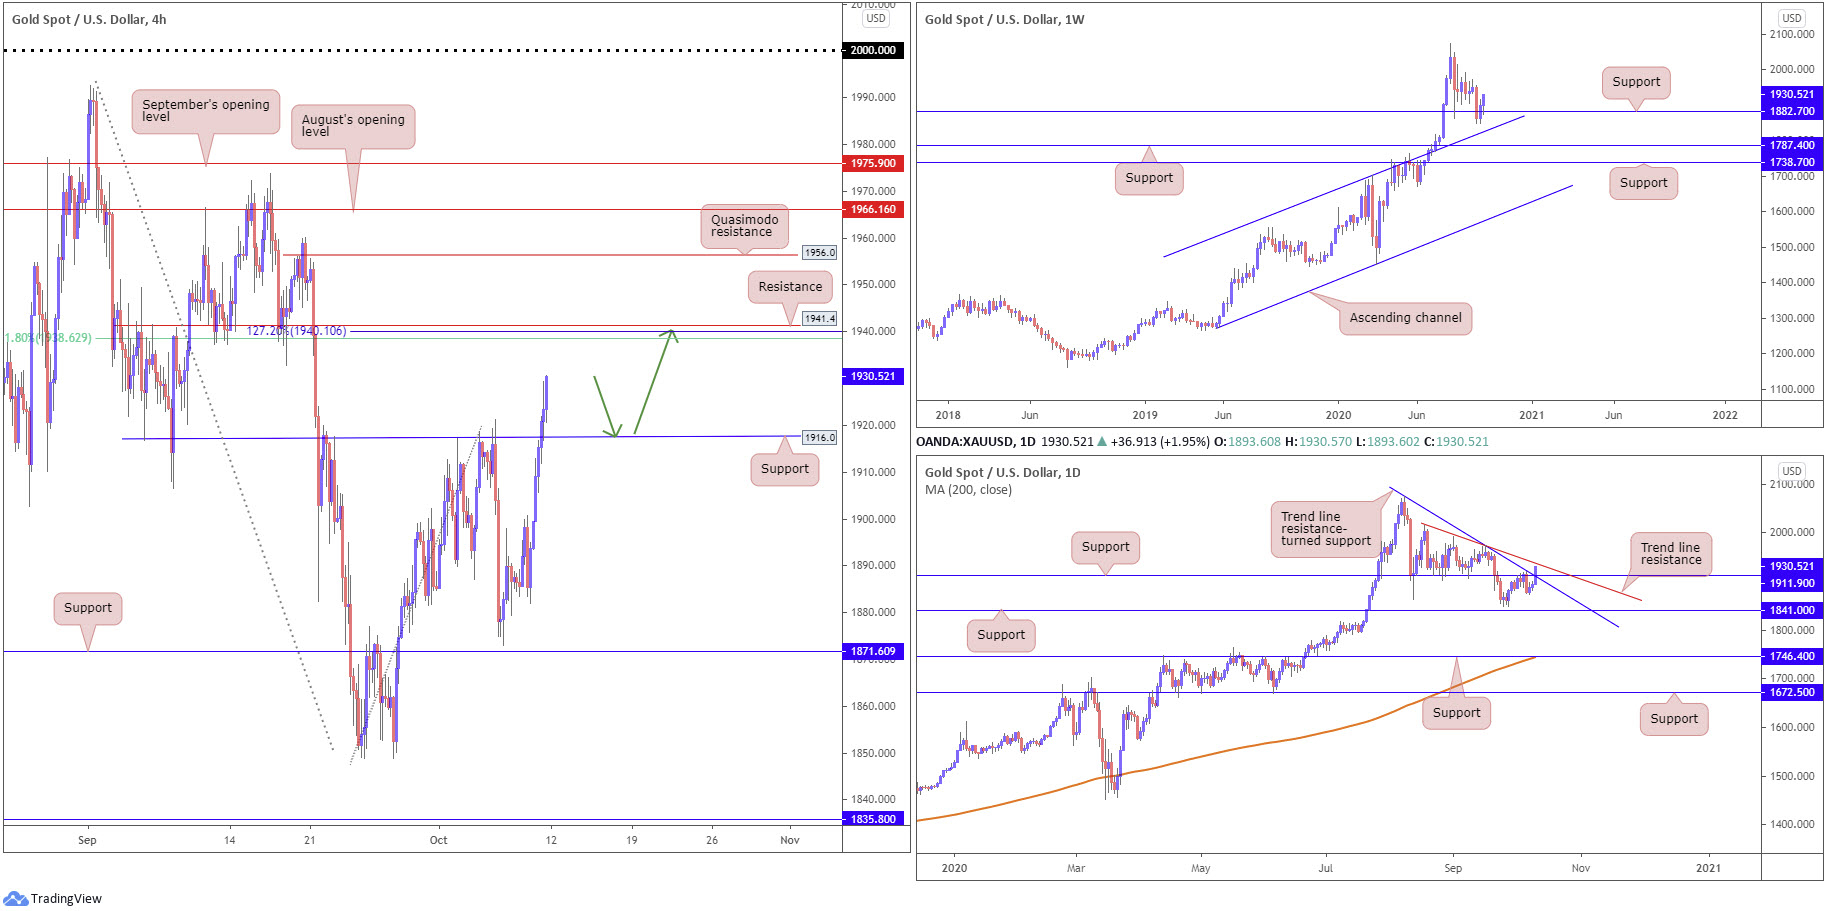
Despite an active push to lows at $1,848, support at $1,882 (positioned above channel resistance-turned support, taken from the high $1,703) appears to have survived, with last week’s session closing at its highs. In addition to this, the trend in this market has faced decisively north since 2016.
Are we headed for the $2,075 all-time peak?
Daily perspective:
Daily price, although initially defending resistance at $1,911 at the beginning of last week, gave way on Friday (now a serving support), as did converging trend line resistance, extended from the high $2,075.
Scope to approach another trend line resistance, taken from the high $2,015, is seen on this timeframe, while a break here exposes the all-time high $2,075, given the lack of active supply seen.
H4 perspective:
Intraday bulls cheered a break of the $1,900 mark and resistance priced in at $1,916 Friday (now serving support), with enough oomph to nudge resistance at $1,941 in sight. Traders will also acknowledge a 127.2% Fibonacci extension point at $1,940 and the 61.8% Fibonacci retracement ratio at $1,938 converges with the resistance. What’s also technically appealing here is daily trend line resistance ($2,015) merges with the resistance levels.
Despite the confluence offered around $1,941, Quasimodo resistance is still worth noting this week, resting at $1,956, followed by August’s opening value at $1,966.
Areas of consideration:
A $1,916 retest on the H4 (green arrows) today could be enough to spark buying, considering we’re coming from weekly support at $1,882. The H4 resistance at $1,941 serves as a logical upside target for longs, and potentially somewhere sellers may make a show, having noted the H4 and daily confluence.
How much of a bearish reaction we’ll see from $1,941 depends on how forceful weekly buyers are this week. Remember, the weekly chart effectively shows room to rally as far north as the all-time high $2,075.
The accuracy, completeness and timeliness of the information contained on this site cannot be guaranteed. IC Markets does not warranty, guarantee or make any representations, or assume any liability regarding financial results based on the use of the information in the site.
News, views, opinions, recommendations and other information obtained from sources outside of www.icmarkets.com.au, used in this site are believed to be reliable, but we cannot guarantee their accuracy or completeness. All such information is subject to change at any time without notice. IC Markets assumes no responsibility for the content of any linked site.
The fact that such links may exist does not indicate approval or endorsement of any material contained on any linked site. IC Markets is not liable for any harm caused by the transmission, through accessing the services or information on this site, of a computer virus, or other computer code or programming device that might be used to access, delete, damage, disable, disrupt or otherwise impede in any manner, the operation of the site or of any user’s software, hardware, data or property.


