
DXY:
The DXY chart shows a bearish overall momentum, supported by the fact that the price is below a major descending trend line, indicating a potential continuation of bearish momentum.
There is a possibility for the price to continue its bearish movement towards the first support level at 100.80, which is considered a multi-swing low support.
On the upside, the first resistance level at 107.87 is identified as an overlap resistance, potentially acting as a barrier to further upward price movements.
Additionally, the second resistance level at 107.87 is also recognized as an overlap resistance, further reinforcing its significance.

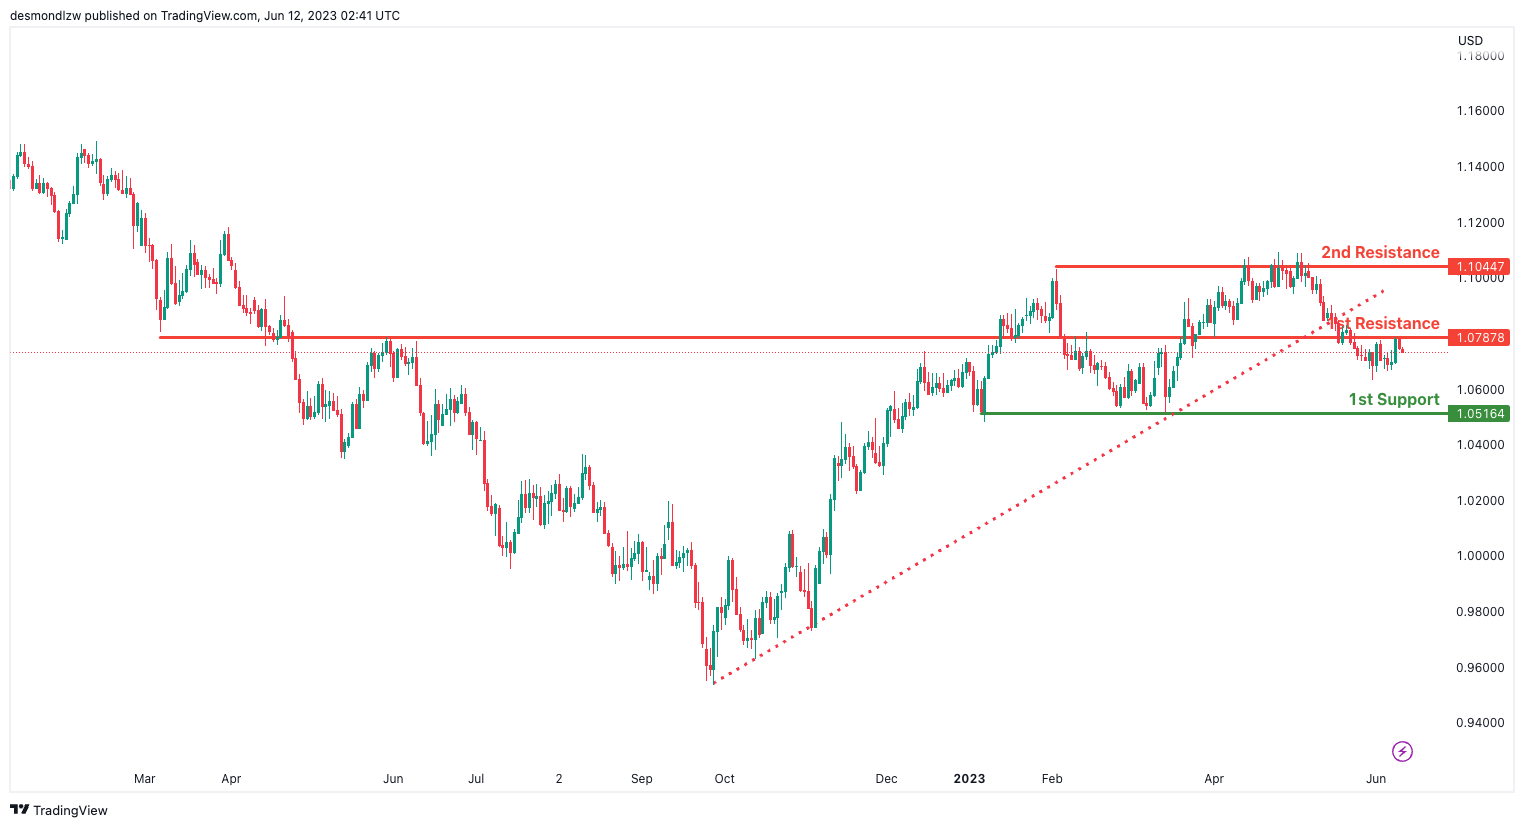
EUR/USD:
The EUR/USD chart demonstrates a bearish overall momentum, as the price broke below an ascending support line, indicating a potential bearish move.
There is a possibility for the price to continue its bearish trend towards the first support level at 1.0516. This level is considered a multi-swing low support.
On the upside, the first resistance level at 1.0787 is identified as an overlap resistance, potentially acting as a barrier to further upward price movements.
Furthermore, the second resistance level at 1.1044 is recognized as a multi-swing high resistance, further reinforcing its significance.
GBP/USD:
The GBP/USD chart currently shows a bearish momentum, suggesting a downward trend in the market.
There is a possibility for the price to react bearishly off the first resistance level and decline towards the first support level.
The first support level at 1.2246 is identified as an overlap support, coinciding with the 50% Fibonacci retracement, making it a significant level of potential buying interest.
Furthermore, the second support level at 1.1834 is recognized as a multi-swing low support, reinforcing its importance as a potential level where buyers may step in.
On the upside, the first resistance level at 1.2662 is an overlap resistance, potentially acting as a barrier to further upward price movements.
Additionally, the second resistance level at 1.2975 is a pullback resistance, further emphasizing its significance as a potential area of selling pressure.

USD/CHF:
The USD/CHF chart currently demonstrates a bearish momentum, indicating a downward trend in the market.
There is a potential for the price to continue its bearish movement towards the first support level at 0.8833, which is identified as a swing low support.
An intermediate support level at 0.8986 is recognized as an overlap support, further reinforcing its significance as a potential level where buyers may provide support.
On the upside, the first resistance level at 0.9088 is an overlap resistance, potentially acting as a barrier to further upward price movements.
Furthermore, the second resistance level at 0.9197 is a multi-swing high resistance, aligning with the 61.80% Fibonacci retracement level, adding to its importance.

USD/JPY:
The USD/JPY chart currently exhibits a bullish momentum, indicating an upward trend in the market.
Given this bullish momentum, there is a possibility for the price to continue its upward movement towards the first resistance level at 142.11. This level is identified as an overlap resistance and aligns with the 61.80% Fibonacci retracement.
Support levels include the first support at 137.65, recognized as an overlap support, and the second support at 134.31, acting as another overlap support.
Furthermore, the second resistance level at 144.99 serves as a pullback resistance, coinciding with the 50% Fibonacci retracement, adding to its significance.

USD/CAD:
The USD/CAD chart currently demonstrates bullish momentum, indicating an upward trend in the market.
Considering this bullish momentum, there is a possibility that the price may experience a bullish bounce off the first support level at 1.3305 and head towards the first resistance level at 1.3667. This level is identified as an overlap resistance and aligns with the 61.80% Fibonacci retracement.
Support levels include the first support at 1.3305, recognized as a multi-swing low support, and the second support at 1.3219, serving as an overlap support.
Furthermore, the second resistance level at 1.3881 acts as a multi-swing high resistance, adding to its importance in potentially limiting further upward price movements.

AUD/USD:
The AUD/USD chart currently demonstrates bullish momentum, indicating an upward trend in the market.
Considering this bullish momentum, there is a potential for the price to continue its bullish continuation towards the first resistance level at 0.6804. This level is identified as a multi-swing high resistance and aligns with the 50% Fibonacci retracement.
Support levels include the first support at 0.6564, characterized as a pullback support, and the second support at 0.6453, recognized as a swing low support.
Furthermore, the second resistance level at 0.6878 acts as a pullback resistance and coincides with the 61.80% Fibonacci retracement, further adding to its significance.

NZD/USD
The NZD/USD chart currently exhibits bullish momentum, suggesting an upward trend in the market.
Despite being below a major descending trend line, there is potential for a bullish continuation towards the first resistance level at 0.6177. This level is considered a pullback resistance and coincides with the 61.80% Fibonacci retracement.
Support levels include the first support at 0.6101, which serves as a pullback support along with the 38.20% Fibonacci retracement. The second support at 0.5983 is a swing low support and aligns with the 50% Fibonacci retracement.
Furthermore, the second resistance level at 0.6308 acts as a multi-swing high resistance.

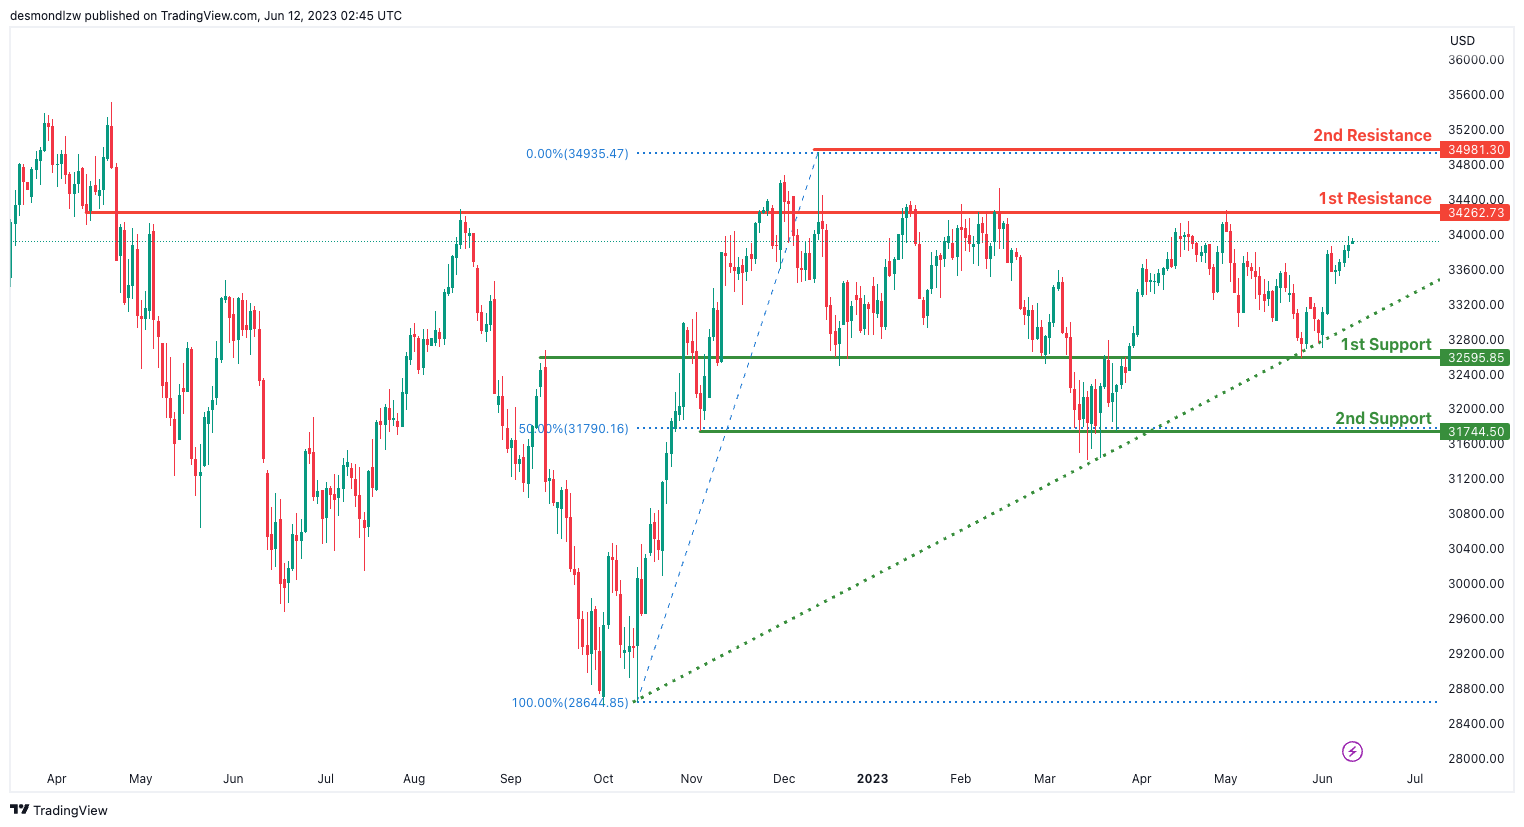
DJ30:
The DJ30 chart currently displays bullish momentum, indicating an upward trend in the market.
The price is above a major ascending trend line, suggesting the potential for further bullish momentum.
There is a possibility of a bullish continuation towards the first resistance level at 34262.73, which is identified as an overlap resistance.
Support levels include the first support at 32595.85, which serves as an overlap support, and the second support at 31744.50. The second support level aligns with the 50% Fibonacci retracement, further reinforcing its significance.
Additionally, the second resistance level at 34981.30 acts as a swing high resistance, adding to its importance as a potential barrier to upward price movement.
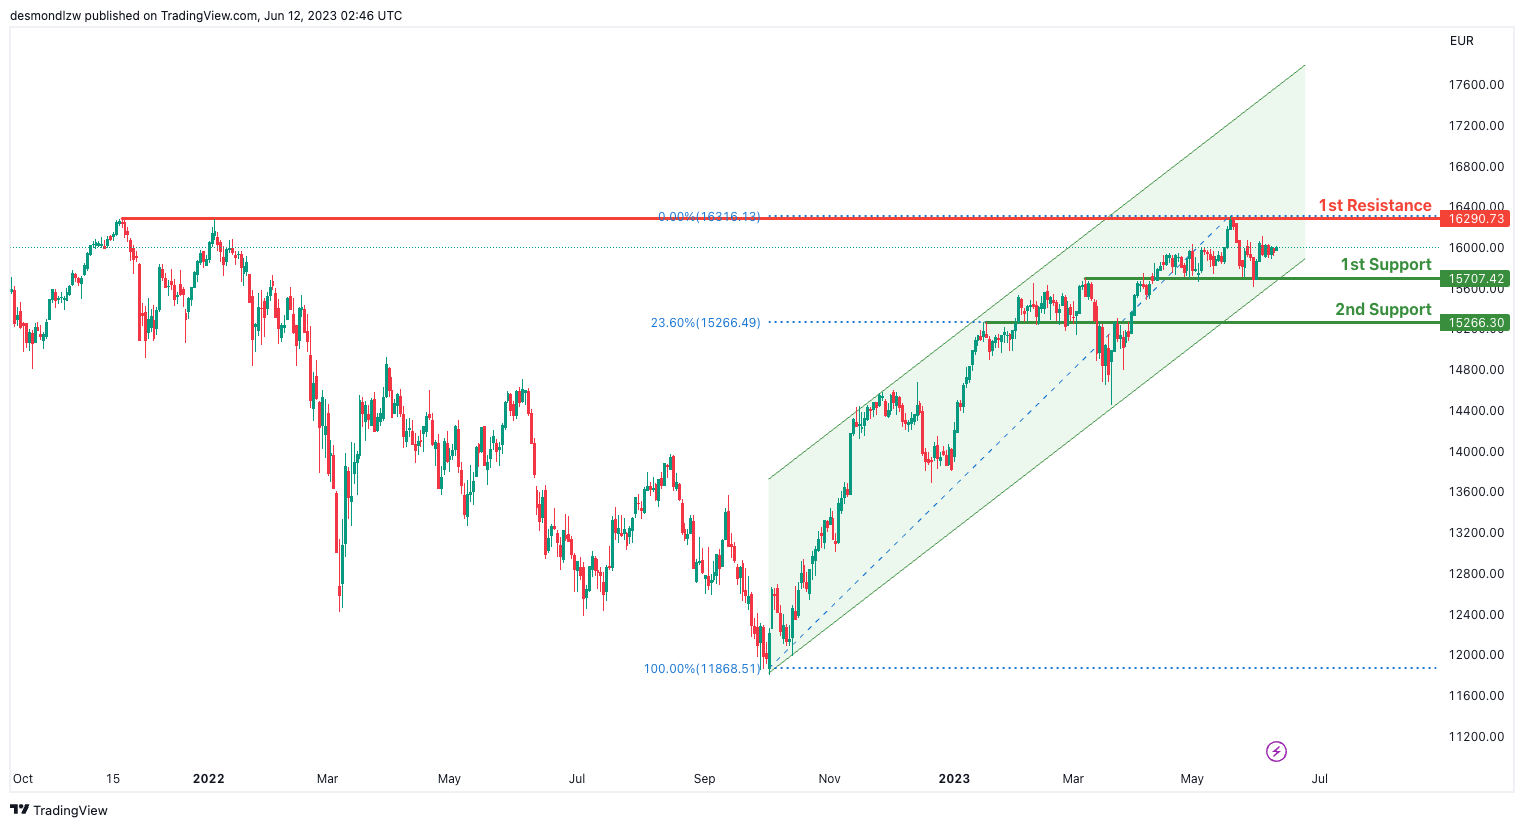
GER30:
The GER30 chart currently exhibits bullish momentum, indicating an upward trend in the market.
The price is contained within a bullish ascending channel, contributing to the overall bullish sentiment.
There is a potential for a bullish continuation towards the first resistance level at 16290.73, which is identified as a multi-swing high resistance.
Support levels include the first support at 15707.73, serving as an overlap support, and the second support at 15266.30, acting as a pullback support.
These factors suggest the possibility of further upward movement in the GER30.
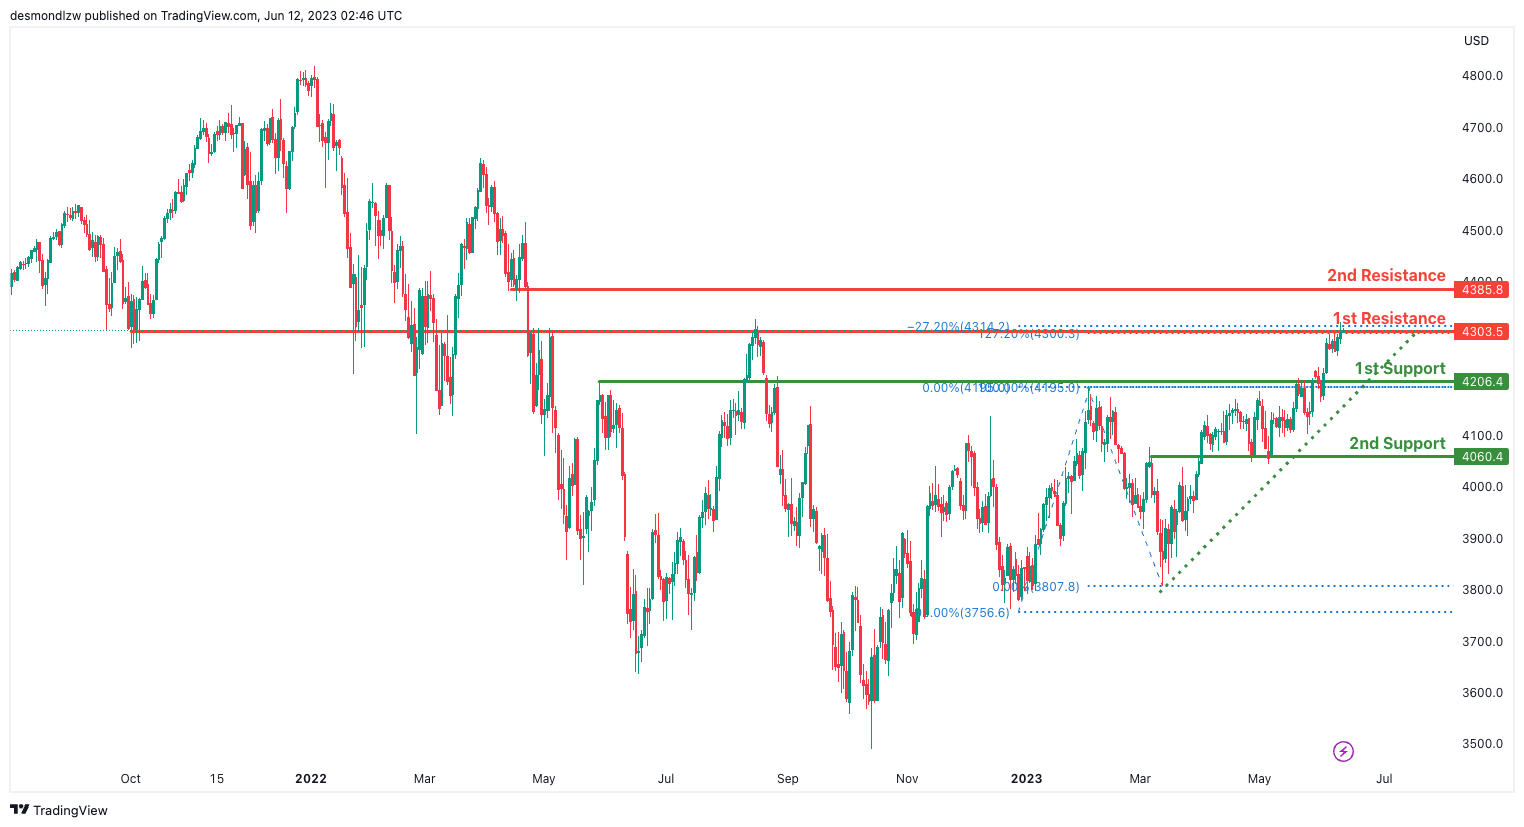
US500
The US500 chart shows bullish momentum, supported by the price being above a major ascending trend line, indicating potential for further upward movement. There is a possibility of a bullish continuation towards the first resistance level at 4303.6, which is a significant multi-swing high resistance level. The second resistance level at 4385.8 also acts as a pullback resistance. On the downside, the first support level at 4206.4 provides pullback support, while the second support level at 4060.4 represents an overlap support level. These levels may provide support in case of price retracements.
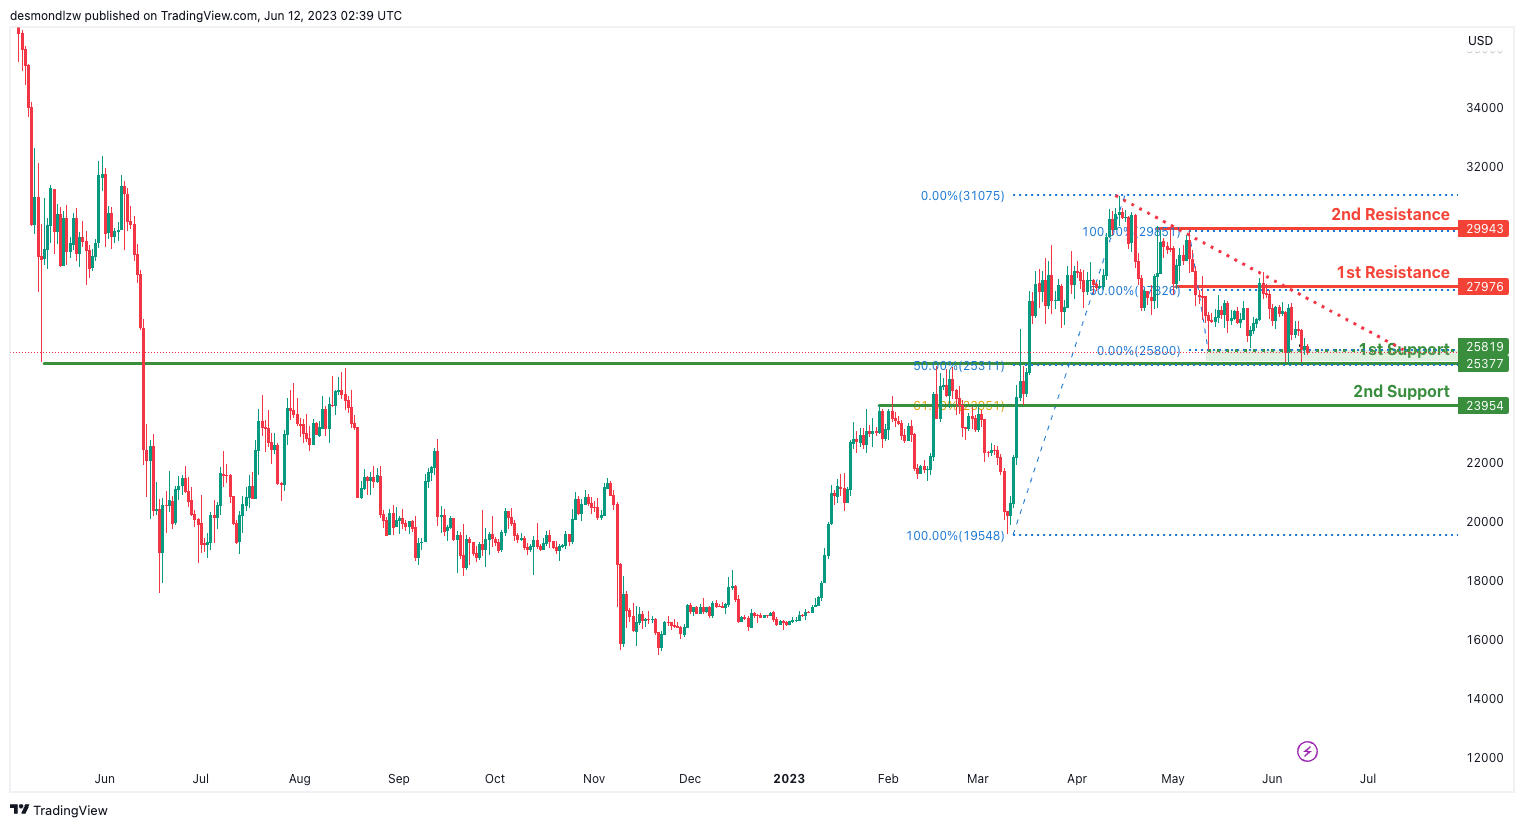
BTC/USD:
The BTC/USD chart is currently displaying neutral momentum, indicating a lack of clear direction in price movement.
There is a possibility for price to fluctuate between the first support level at 25377.00 and the first resistance level at 27976.0. These levels represent significant areas of overlap support and resistance, respectively.
The second support level at 23954.0 is another important level as it coincides with a 61.80% Fibonacci retracement, potentially providing additional support if price were to decline further.
Similarly, the second resistance level at 29943.0 represents an area of overlap resistance, which may act as a significant barrier if price were to rise.
ETH/USD:
The ETH/USD chart is currently experiencing bearish momentum, indicating a downward trend in price.
There is a possibility for a bearish break below the first support level at 1742.81, which is a significant area of overlap support and coincides with a 50% Fibonacci retracement. If this level is breached, it could potentially lead to a further decline in price towards the second support level at 1669.32, which is also an area of overlap support and corresponds to a 61.80% Fibonacci retracement.
On the upside, the first resistance level at 2006.28 represents an area of overlap resistance. This level may act as a barrier to upward movement and could potentially limit the bullish momentum.

WTI/USD:
The WTI chart currently shows a bearish momentum, indicating a downward trend in price.
There is a potential for a bearish continuation towards the first support level at 62.05, which is an area of overlap support. This level has previously acted as support and may provide further support in the future.
Additionally, there is an intermediate support level at 64.60, which also represents an area of overlap support.
On the upside, the first resistance level at 73.60 is an area of overlap resistance. This level may act as a barrier to upward movement and could potentially limit the bullish momentum.
Furthermore, the second resistance level at 82.87 is another area of overlap resistance, which may provide strong resistance to the price movement..

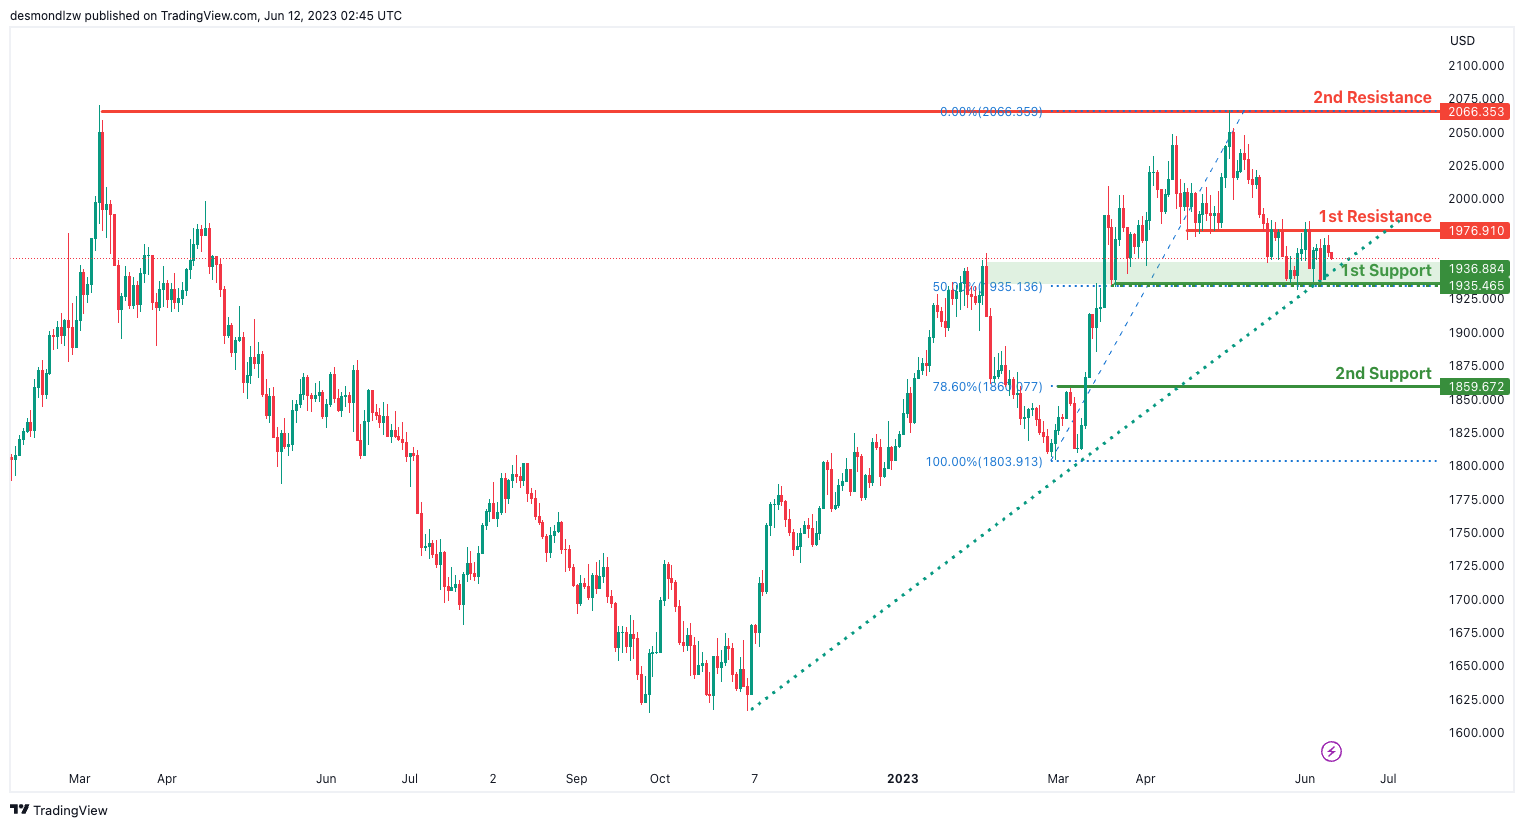
XAU/USD (GOLD):
The XAU/USD chart currently exhibits bearish momentum, indicating a downward trend in price.
There is a potential for a bearish continuation towards the first support level at 1935.47. This support level is significant as it represents an area of overlap support and coincides with the 50% Fibonacci retracement level. It has the potential to provide support and potentially halt the downward movement.
Furthermore, the second support level at 1859.67 is another area of overlap support. This level is reinforced by the 78.60% Fibonacci retracement level, making it a strong area of support to monitor.
On the upside, the first resistance level at 1976.91 acts as an area of overlap resistance. This level may hinder upward movement and could potentially serve as a barrier to bullish momentum.
Additionally, the second resistance level at 2066.35 is another area of overlap resistance. It may offer significant resistance and impede further upward movement.
The accuracy, completeness and timeliness of the information contained on this site cannot be guaranteed. IC Markets does not warranty, guarantee or make any representations, or assume any liability regarding financial results based on the use of the information in the site.
News, views, opinions, recommendations and other information obtained from sources outside of www.icmarkets.com, used in this site are believed to be reliable, but we cannot guarantee their accuracy or completeness. All such information is subject to change at any time without notice. IC Markets assumes no responsibility for the content of any linked site.
The fact that such links may exist does not indicate approval or endorsement of any material contained on any linked site. IC Markets is not liable for any harm caused by the transmission, through accessing the services or information on this site, of a computer virus, or other computer code or programming device that might be used to access, delete, damage, disable, disrupt or otherwise impede in any manner, the operation of the site or of any user’s software, hardware, data or property.


