
Key risk events today:
Japanese banks are closed in observance of Mountain Day; China New Loans; RBA Assist Gov. Kent Speaks.
EUR/USD:
Weekly gain/loss: +0.83%
Weekly close: 1.1197
Weekly perspective:
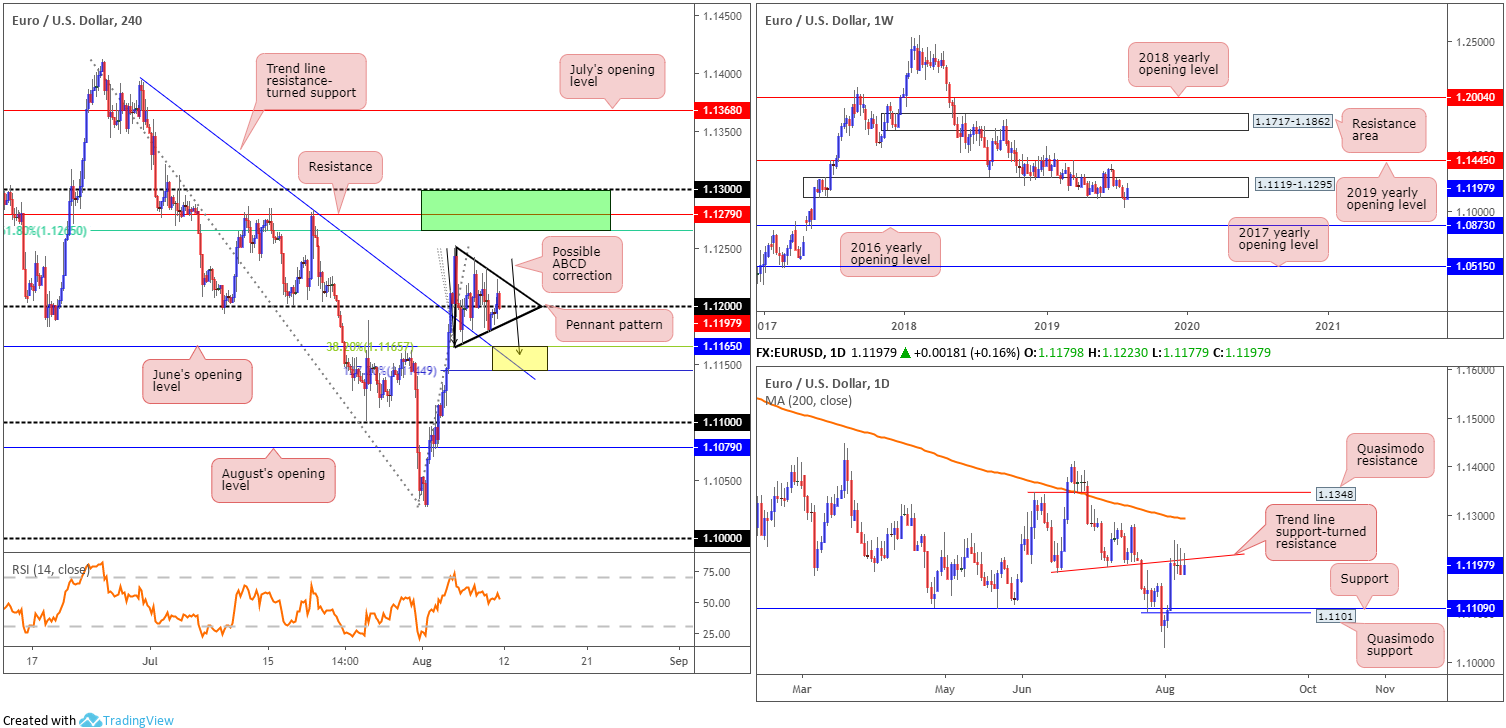
Despite clocking multi-year lows of 1.1026 and long-standing demand at 1.1119-1.1295 having its lower edge submerged, price movement staged an impressive recovery last week and snapped a three-week losing streak. Continued bidding could eventually see the unit knock on 1.1445’s door again, the 2019 yearly opening level, whereas support is not expected to emerge until shaking hands with the 2016 yearly opening level at 1.0873.
In addition to this, it is worth noting the long-term trend remains facing a southerly bearing since topping in early 2018.
Daily perspective:
Aside from Monday’s robust advance, the daily candles found thin air above a local trend line support-turned resistance (taken from the low 1.1181), rejecting the level in the shape of back-to-back selling wicks/inside days.
Therefore, a push to support at 1.1109, closely followed by Quasimodo support at 1.1101, is a possibility this week. A violation of the said trend line resistance, however, may call for a run towards the 200-day SMA (orange – currently circulating around 1.1294).
H4 perspective:
Since Tuesday, the H4 space has been busy sculpting a clear-cut pennant formation (1.1249/1.1167). As a pennant is typically considered a continuation pattern, a breakout north is likely eyed by many traders this week.
Another scenario worth considering this week is the completion of an ABCD correction (black arrows) within a particularly interesting area of support at 1.1144/1.1165 (yellow – comprised of June’s opening level at 1.1165 and a 38.2% Fibonacci retracement ratio, a 127.2% Fibonacci ext. point at 1.1144 and an intersecting trend line resistance-turned support taken from the high 1.1392).
It might also be worth noting we have considerable resistance lurking above between the round number 1.13, a resistance level at 1.1279 and a 61.8% Fibonacci retracement value at 1.1265 (1.13/1.1265 – green).
Areas of consideration:
Longer term, it appears weekly and daily price remain emphasising a conflicting tone: weekly buyers attempting a push from demand and daily sellers defending a trend line support-turned resistance.
Medium-term flow (H4), on the other hand, is biased to the upside, according to structure: either a breakout motion above the pennant pattern or a correction to 1.1144/1.1165 support. Both represent high-probability setups, with a logical upside target residing around 1.13/1.1265 – green.
GBP/USD:
Weekly gain/loss: -1.11%
Weekly close: 1.2022
Weekly perspective:
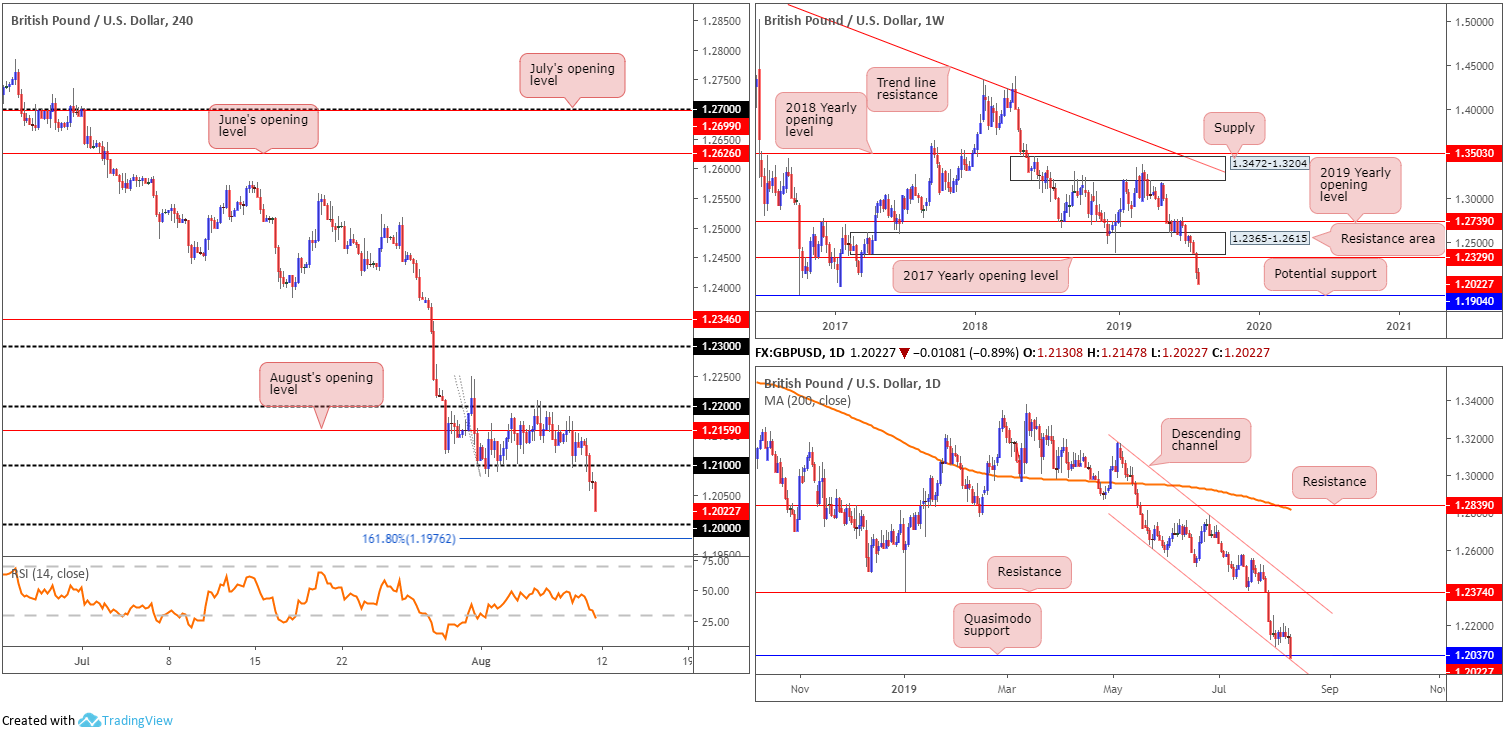
The British pound retained a heavy tone last week, erasing more than 130 points and recording its fourth consecutive losing week. After tunnelling through bids residing within long-standing demand at 1.2365-1.2615 (now acting resistance area) and overthrowing the 2017 yearly opening level at 1.2329, the next downside objective on the weekly timeframe falls in around support from 1.1904: a standout low clocked in early October 2016.
Daily perspective:
Before reaching 1.1904 on the weekly timeframe, daily movement must contend with channel support (taken from the low 1.2605) and Quasimodo support close by at 1.2037. This, particularly on the daily timeframe, is the last line of defence for buyers it seems as a clear run beneath here is visible until 1.1904.
H4 perspective:
Friday’s GDP statistics came in worse than markets had expected after it was revealed the economy shrank 0.2% in the second quarter of 2019. The disappointing surprise was immediately registered in sterling exchange rate markets, with the GBP/USD concluding the day down nearly 1.00%.
The 1.20 handle is likely eyed this week as a potential support that may offer some much-needed respite, closely followed by a 161.8% Fibonacci ext. point at 1.1976 and confirmed by the RSI entering oversold status. This also happens to closely coincide with the daily channel support aired above.
Areas of consideration:
Entering long at 1.20 without additional confirmation, in spite of the added support highlighted above, is considered a chancy move with weekly price eyeing the lower end of 1.19s. A H4 bullish candlestick printed from 1.20 would likely encourage buying, though whether price will reach 1.21 is difficult to judge.
In the event we overthrow 1.20 on a H4 closing basis, this would likely put a test of 1.19 in view. A retest at 1.20 as resistance by way of a H4 bearish candlestick formation is ideal for sellers, allowing traders to position entry and risk levels according to the pattern.
AUD/USD:
Weekly gain/loss: -0.20%
Weekly close: 0.6784
Weekly perspective:
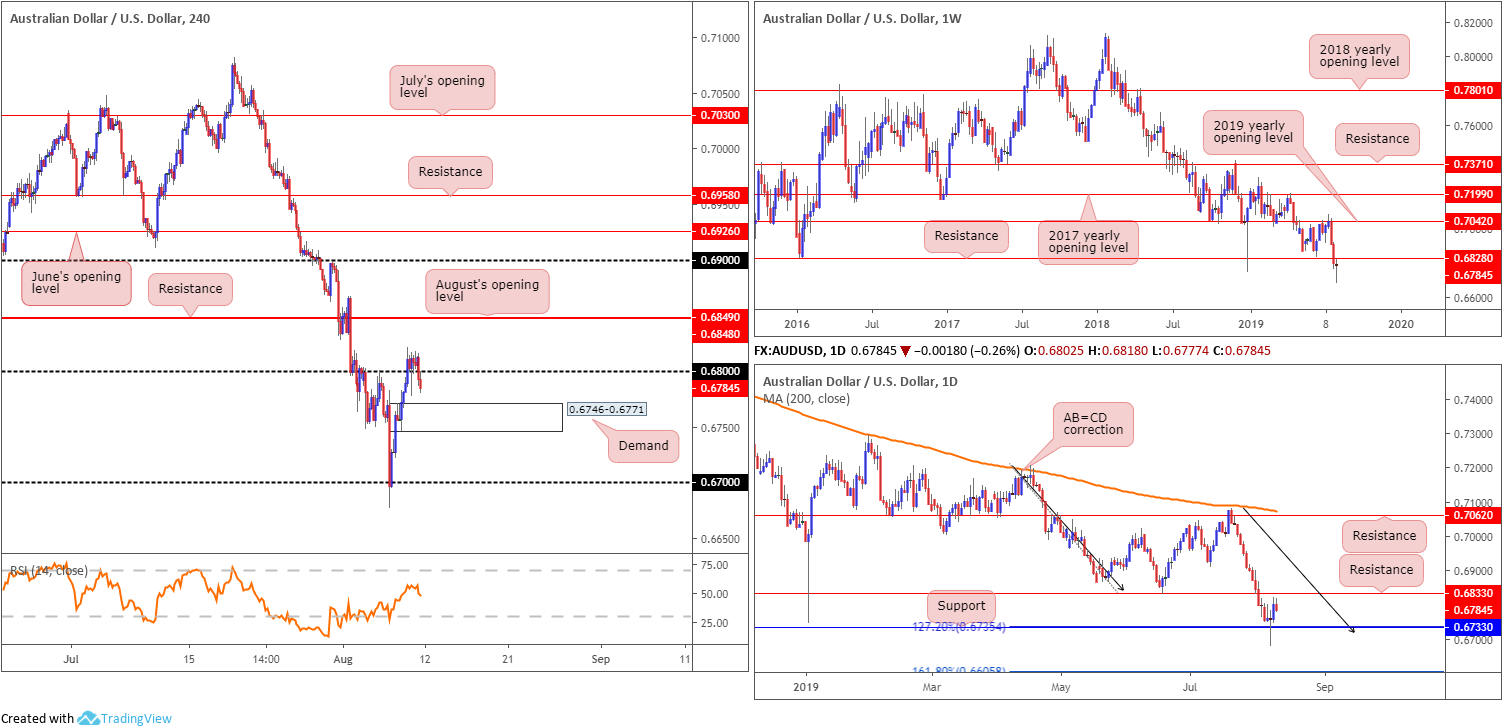
Extending the pullback from the 2019 yearly opening level (resistance) at 0.7042, the pair refreshed multi-year lows at 0.6677 last week. The week prior saw price slip beneath notable support at 0.6828, which could potentially serve as resistance this week.
The long-term downtrend remains intact, with further selling likely on the cards as the next support is not visible until 0.6395 on this timeframe (not seen on the screen).
Daily perspective:
Support at 0.6733, which happens to merge with a 127.2% AB=CD (black arrows) formation at 0.6735, entered the fold Wednesday and held ground. The next base of support can be seen at the 161.8% Fibonacci ext. point at 0.6605. Resistance, nonetheless, is not expected until the 0.6833 June 18 low, though do remain cognizant of weekly structure offering resistance a touch lower at 0.6828.
H4 perspective:
A brief recap of Friday’s movement shows the pair failed to sustain gains above 0.68, leaving August’s opening level/resistance at 0.6849/0.6848 unchallenged and consequently exposing fresh demand plotted at 0.6746-0.6771. Beyond demand, traders likely have eyes on the 0.67 handle as the next feasible support.
Areas of consideration:
Entering long from the current H4 demand is likely to offer a bounce to at least 0.68, though whether buyers have sufficient oomph to dethrone 0.68 remains to be seen. Above 0.68, the next upside targets fall in at weekly resistance drawn from 0.6828, daily resistance at 0.6833 and finally August’s opening level/resistance at 0.6849/0.6848 on the H4 timeframe.
Although positioned slightly above the aforementioned higher-timeframe resistances, a H4 bearish candlestick configuration printed from 0.6849/0.6848 is also likely enough to draw in sellers (entry/risk can be determined according to the candlestick’s structure) this week and reclaim the higher-timeframe levels.
USD/JPY:
Weekly gain/loss: -0.83%
Weekly close: 105.68
Weekly perspective:
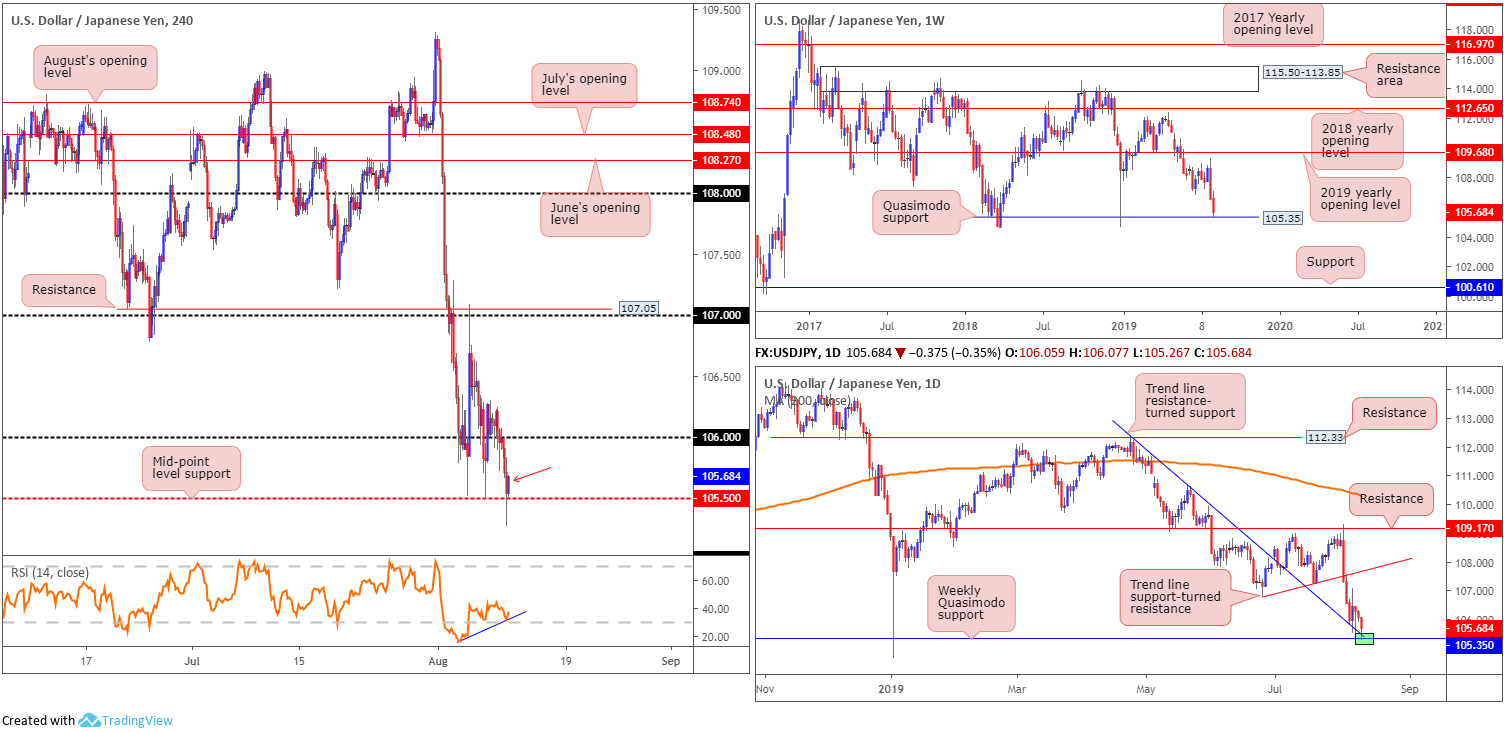
By way of a mammoth bearish engulfing pattern printed the week prior, the US dollar ceded further ground against the Japanese yen last week, consequently drawing in Quasimodo support at 105.35 – this level already proved some worth by holding the unit higher at the beginning of the year. Outside of this base, limited support is evident until connecting with support at 100.61.
Daily perspective:
In tandem with the weekly Quasimodo support highlighted above, traders may also want to acknowledge trend line resistance-turned support also entered the fight Friday on the daily timeframe. Extended from the high 112.40, this line, coupled with weekly Quasimodo support, is likely enough to entice a recovery this week, targeting Tuesday’s high 107.09 followed by trend line support-turned resistance (etched from the low 106.78).
H4 perspective:
Friday observed additional downside, following weakening US Treasury yields, US equities curbing upside and US President Donald Trump stating next month’s trade talks might be cancelled. 106 put up little fight in early trade, eventually giving way into London and testing 105.50 by the close.
105.50 support, confirmed by positive divergence from the RSI indicator (blue line) and a reasonably nice-looking H4 closing candle (red arrow), as well as being bolstered by the aforementioned higher-timeframe supports, is likely enough to entice longs into the mix today and attempt to reclaim 106+ status.
Areas of consideration:
With all three timeframes exhibiting supportive structure, a long could be an option today. With a protective stop-loss order plotted beneath Friday’s low 105.26 and an initial upside objective set at 106, this is considered a high-probability trade, with the odds strongly favouring a continuation above 106.
USD/CAD:
Weekly gain/loss: +0.10%
Weekly close: 1.3214
Weekly perspective:
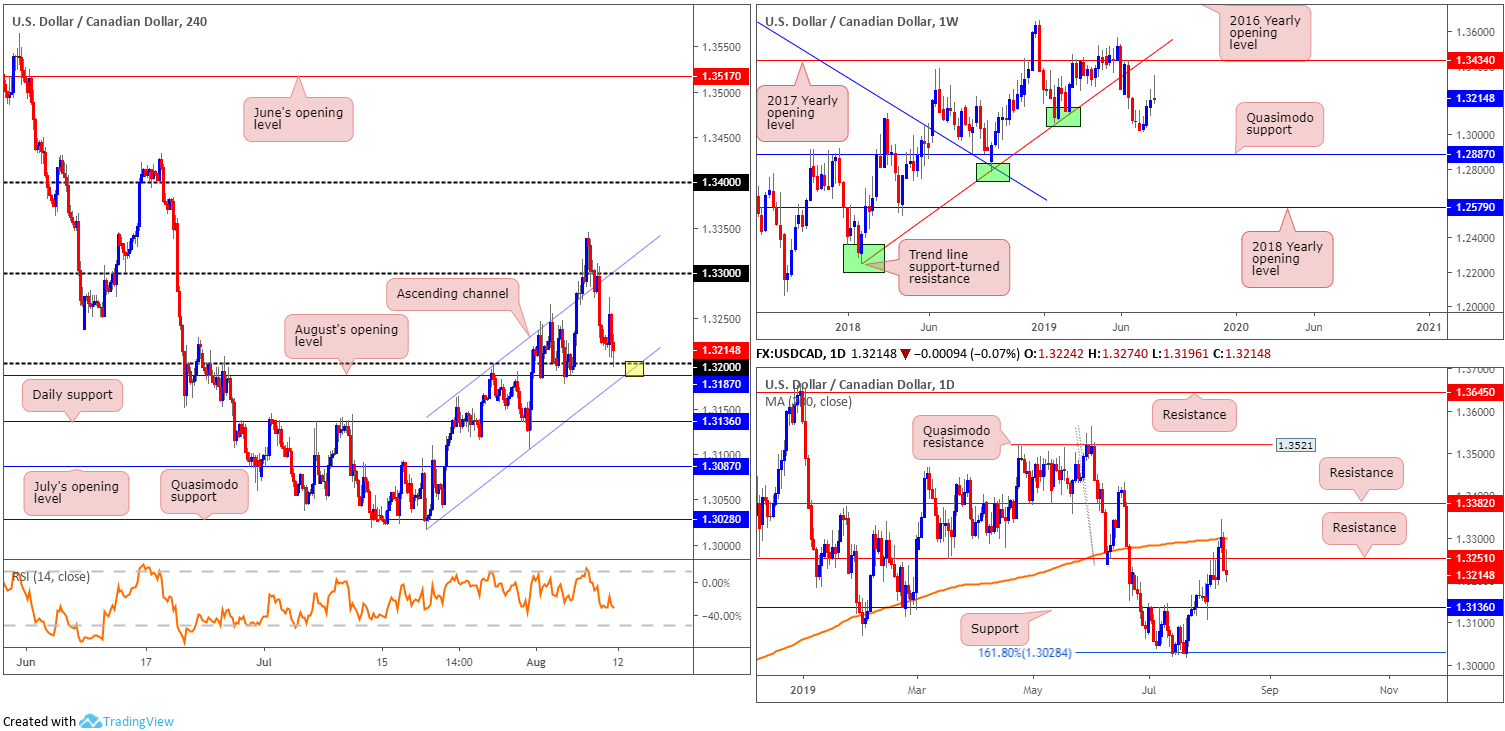
Since bottoming at 1.3018 in the form of an inverted hammer pattern, the USD/CAD has been steadily grinding higher. Last week’s movement, as evident from the chart, clocked highs of 1.3344, though closed in the mould of a shooting star formation (considered a bearish signal).
Continued buying from this point, nevertheless, has the 2017 yearly opening level at 1.3434 to target, closely shadowed by trend line support-turned resistance etched from the low 1.2247. In the event we turn lower, however, traders’ crosshairs will likely be fixed on the 1.3016 July 15 low, followed by Quasimodo support at 1.2887.
Daily perspective:
Viewing the market’s position on the daily timeframe, we can see the daily candles respected its 200-day SMA (orange) Thursday and concluded strongly sub resistance at 1.3251. Continued selling from this point has support at 1.3136 in view as its next port of call, which, as you can see, sports an appealing history as support/resistance.
H4 perspective:
Friday witnessed the Canadian dollar hit the ropes after Statistics Canada revealed the unemployment rate increased by 0.2 percentage points to 5.7%, and Canada’s economy lost 24.2k jobs during the July month. The USD/CAD spiked higher in response to the report, rising from 1.3208 to 1.3273. The move, however, was swiftly pared as oil prices remained on the front foot (+2.69%) and the broad US dollar index explored lower ground.
The 1.32 handle made an appearance going into the close, and held as support. This figure, coupled with August’s opening level at 1.3187 and a channel support (extended from the low 1.3015 – yellow) provides a strong field of supportive confluence to work with today.
Areas of consideration:
Keeping it simple this morning, should the H4 candles test 1.32, specifically the point where the round number merges with August’s opening level/channel support, a long from here could be something to consider, targeting daily resistance at 1.3251 as the initial take-profit zone. Entry can be found at 1.32, with a tight protective stop-loss order positioned a few points beneath August’s opening level at 1.3187. Conservative traders requiring a little more confirmation may opt to wait and see if a H4/H1 bullish candlestick signal develops before pulling the trigger. That way, entry and risk can be set according to this structure.
The reason traders may require additional candlestick confirmation simply comes down to the fact the higher timeframes display room to press lower.
USD/CHF:
Weekly gain/loss: -0.97%
Weekly close: 0.9723
Weekly perspective:
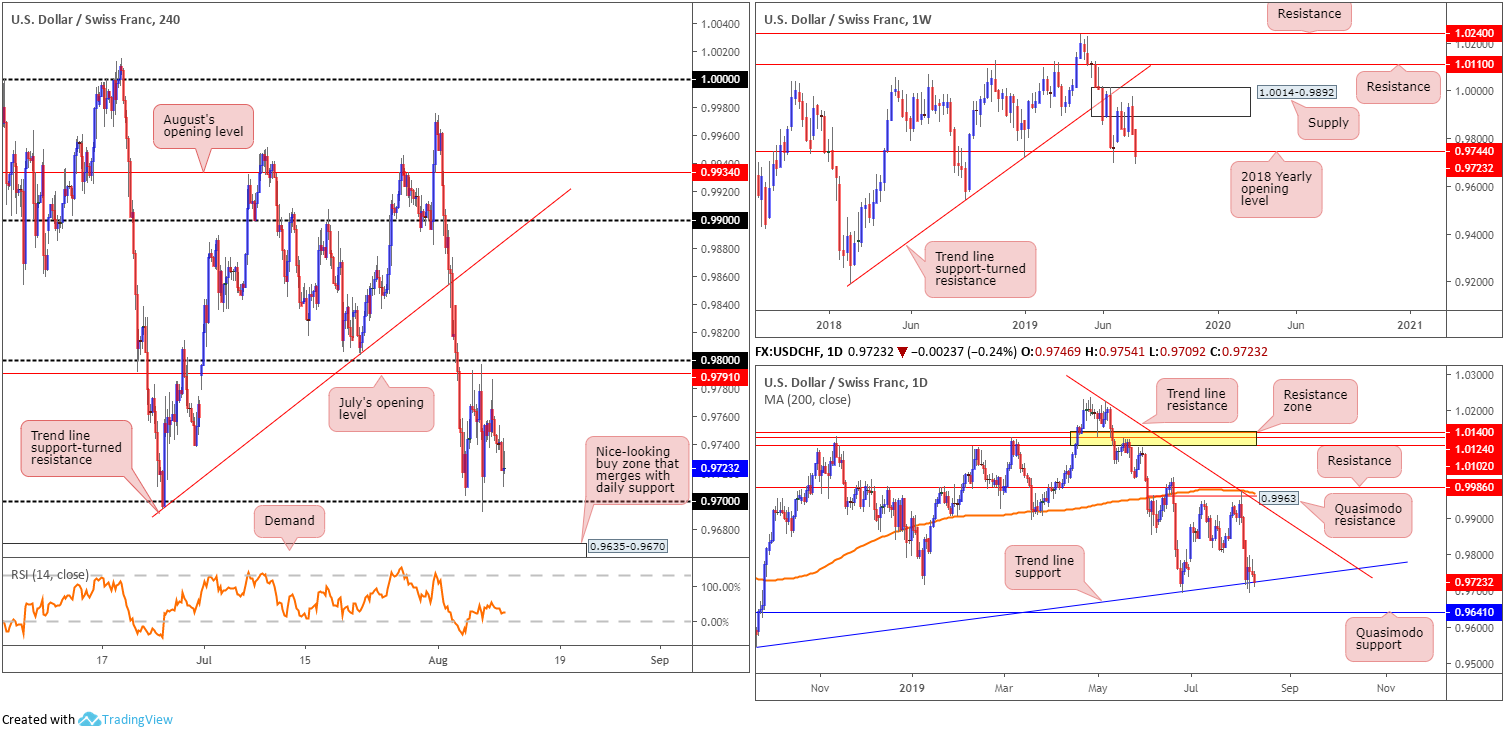
The US dollar retained its bearish tone last week, extending losses from supply at 1.0014-0.9892 beyond support at 0.9744: the 2018 yearly opening level. Increased downside this week could introduce the 0.9542 September 17 low as support, though before reaching this target a retest at 0.9744 may be on the cards.
Daily perspective:
A large portion of the week was spent defending trend line support etched from the low 0.9542. Lack of meaningful upside from here thus far, however, informs traders that further downside is likely the favoured route, with Quasimodo support in sight at 0.9641.
H4 perspective:
Since the beginning of last week, the H4 candles have been carving out a 100-point range between 0.98/July’s opening level at 0.9791 and 0.97. A decisive move beyond 0.98 may attempt an approach towards trend line support-turned resistance (extended from the low 0.9693)/0.99, whereas a push sub 0.97 has demand in view at 0.9635-0.9670 (drawn from September 2018).
Areas of consideration:
With the higher timeframes suggesting lower prices, a test of 0.97 is likely in order today. Entering long from here, with limited higher-timeframe convergence, is a chancy move we feel. The more appealing area of support comes in at demand mentioned above at 0.9635-0.9670. Not only is the zone a high-probability base in and of itself, it aligns with Quasimodo support on the daily timeframe at 0.9641. This potentially offers enough ‘juice’ to entice buying to at least 0.97, providing sufficient room to reduce risk to breakeven at the first target.
Dow Jones Industrial Average:
Weekly gain/loss: -0.59%
Weekly close: 26292
Weekly perspective:
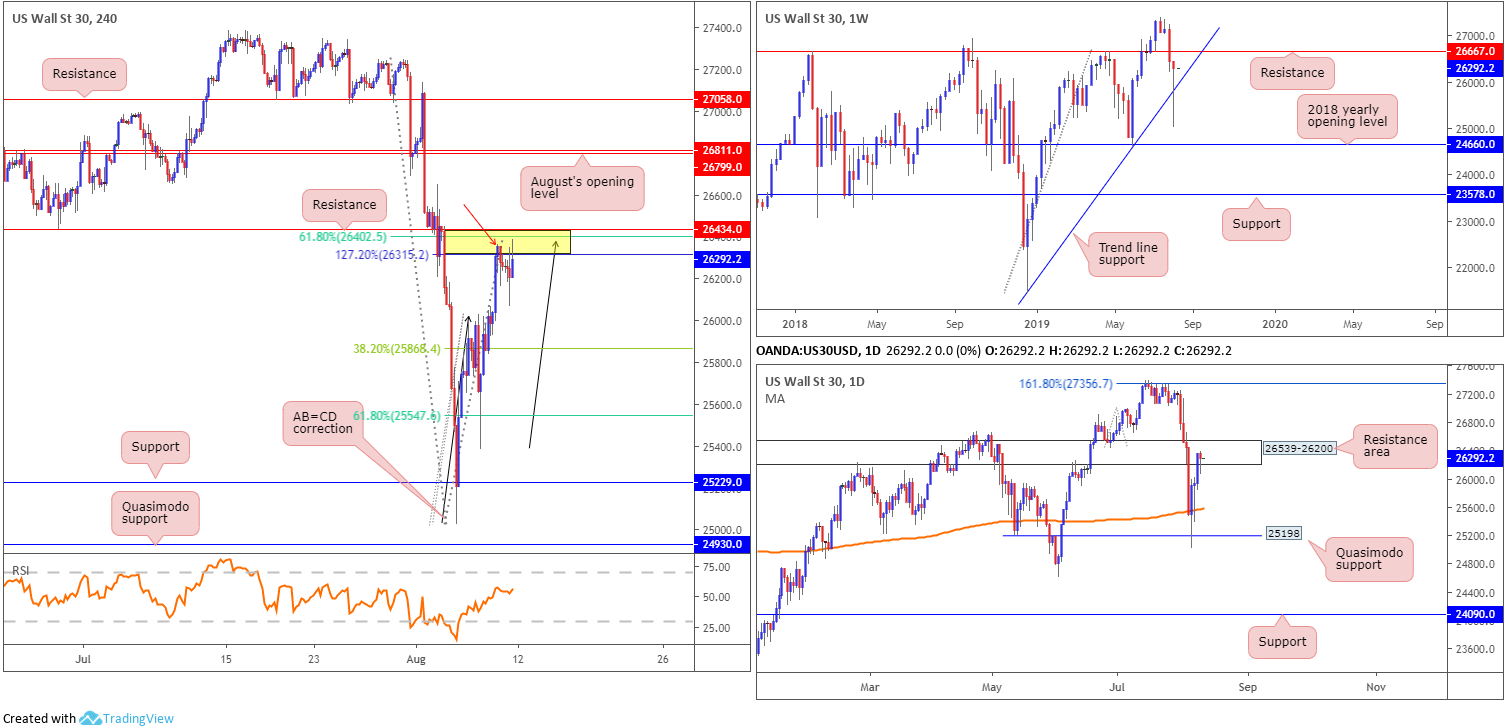
Despite ranging more than 1400 points on the week, the Dow Jones Industrial Average wrapped up in mildly negative territory. Interestingly, though, the weekly candle closed in the shape of a striking hammer formation that pierced through trend line support extended from the low 21452. Candlestick enthusiast’s eagerness may take hold, though some will be reluctant to commit knowing resistance at 26667 lurks just ahead.
Daily perspective:
Following a successful test of Quasimodo support at 25198, helped later by the 200-day SMA (orange), the index entered the parapets of a resistance area coming in at 26539-26200 by the close. Note Friday concluded the session by way of a hanging man candlestick formation, considered a bearish signal.
H4 perspective:
Friday ended on a down note after US President Donald Trump raised the possibility that a meeting with China on trade might be cancelled, pressuring stocks. The Dow Jones Industrial Average erased 90.75 points, or 0.34%; the S&P 500 also erased 19.44 points, or 0.66% and the Nasdaq declined 78.56 points, or 1.02%.
For those who read Friday’s briefing you may recall the following:
The technical landscape on the Dow’s H4 chart this morning is appealing for shorts. Between resistance at 26434, a 127.2% AB=CD (black arrows) correction point at 26315 and a 61.8% Fibonacci retracement value at 26402, we have a compact sell zone (yellow). What’s also notable from a technical perspective is a converging daily resistance area in the mix at 26539-26200.
The only grumble to selling the current H4 sell zone is the weekly timeframe showing price could potentially run as far north as weekly resistance at 26667.
Areas of consideration:
Well done to any of our readers who managed to sell the H4 resistance area at 26434/26292. Note we also had additional H4 candlestick confirmation in the form of a hanging man pattern (red arrow). As for downside targets, keep eyes on the 38.2% and 68.1% Fibonacci retracements at 25868 and 25547, respectively.
XAU/USD (GOLD):
Weekly gain/loss: +3.93%
Weekly close: 1497.1
Weekly perspective:
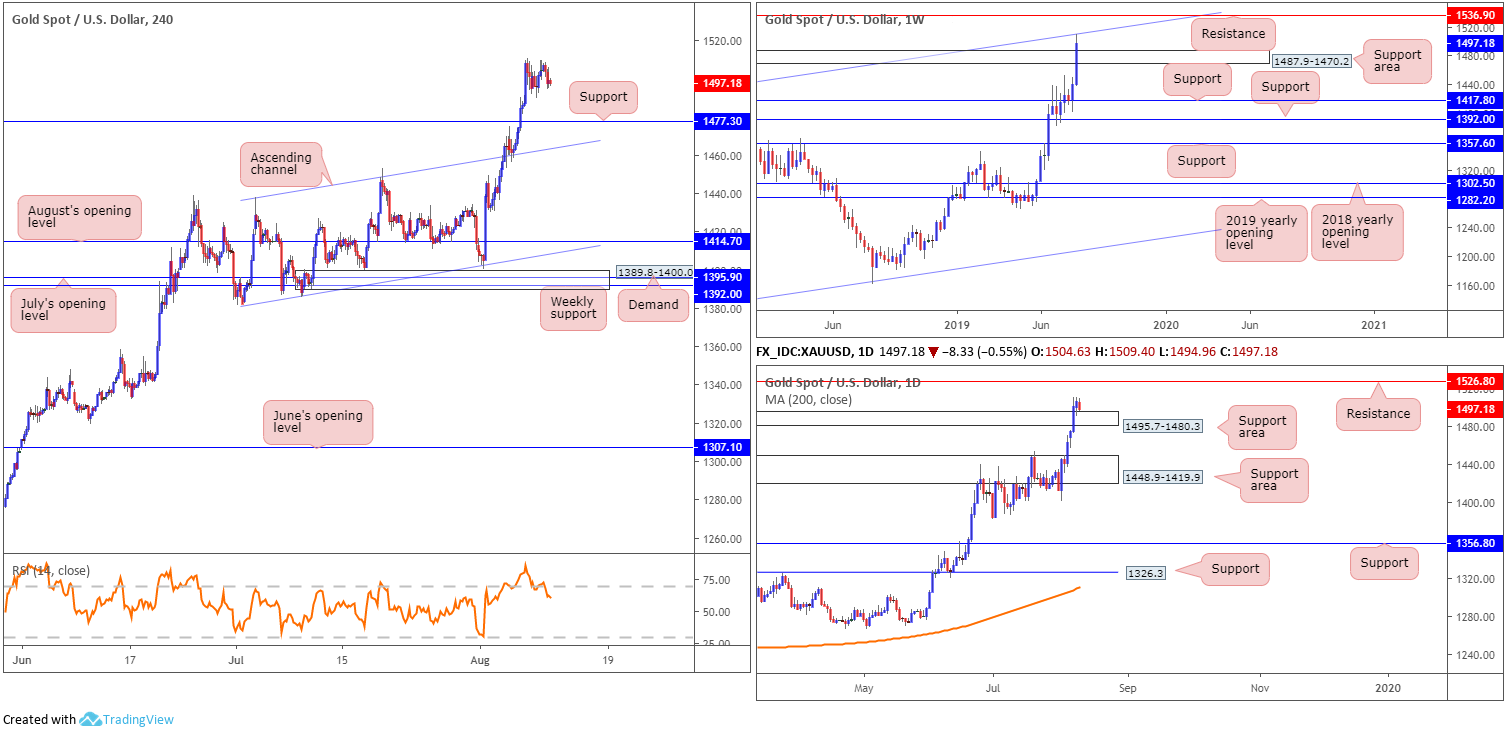
Over the course of last week, bullion aggressively explored higher ground against the US dollar, overwhelming supply at 1487.9-1470.2 (now acting support area) and challenging long-term channel resistance taken from the high 1375.1, which, as evident from the chart, is holding ground. In the event further buying develops, resistance at 1536.9 is visible as the next port of call.
Daily perspective:
In terms of daily price, nonetheless, 1495.7-1480.3 remains serving as a support area which may eventually prompt additional upside in the direction of resistance at 1526.8.
H4 perspective:
Snapping a four-day winning streak, the price of gold, in $ terms, mildly turned lower Friday, down 0.55%. Despite this, price action remained contained within Wednesday’s range, with potential to press as far north as supply coming in at 1568.4-1552.9 (not visible on the screen) this week, and rotate as low as support at 1477.3.
Areas of consideration:
Outlook unchanged.
Despite weekly channel resistance recently entering the fold, traders are still likely focused on the current uptrend and looking for an opportunity to get involved. With daily price already retesting 1495.7-1480.3 as support, H4 support at 1477.3 is an ideal location to look for buying opportunities today, preferably on the back of a H4 bullish candlestick signal (entry and risk can be determined according to this structure). Why the need for candlestick confirmation? This is simply to try and help limit losses should weekly sellers push for lower ground.
The accuracy, completeness and timeliness of the information contained on this site cannot be guaranteed. IC Markets does not warranty, guarantee or make any representations, or assume any liability regarding financial results based on the use of the information in the site.
News, views, opinions, recommendations and other information obtained from sources outside of www.icmarkets.com.au, used in this site are believed to be reliable, but we cannot guarantee their accuracy or completeness. All such information is subject to change at any time without notice. IC Markets assumes no responsibility for the content of any linked site.
The fact that such links may exist does not indicate approval or endorsement of any material contained on any linked site. IC Markets is not liable for any harm caused by the transmission, through accessing the services or information on this site, of a computer virus, or other computer code or programming device that might be used to access, delete, damage, disable, disrupt or otherwise impede in any manner, the operation of the site or of any user’s software, hardware, data or property.


