
Key risk events today:
Limited.
(Previous analysis as well as outside sources – italics).
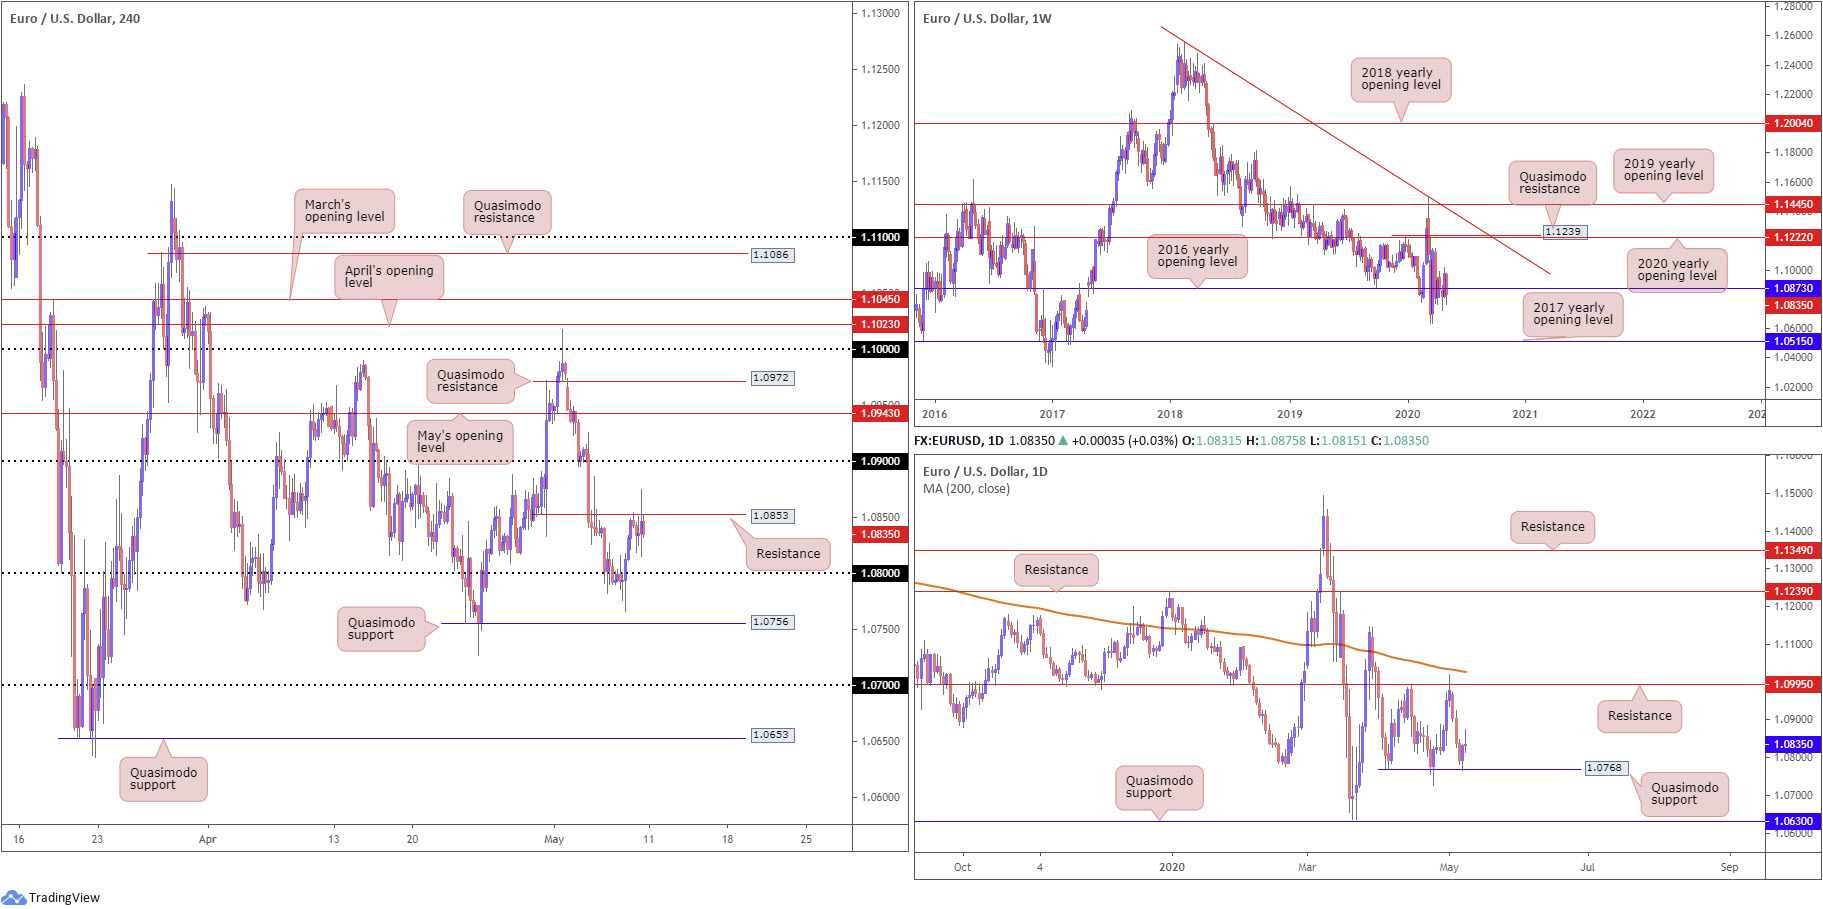
EUR/USD:
Weekly gain/loss: -1.31%
Weekly close: 1.0835
Weekly perspective:
Trading around its 2016 yearly opening level at 1.0873 since April, longer-term flow offers a somewhat directionless tone at present. This is despite concluding the week in negative territory and erasing a large portion of the prior week’s gains. Overall, though, EUR/USD has been involved in a long-term downtrend since topping in early 2018.
A nudge lower could see multi-year lows enter sight at 1.0635, while firming may eventually witness the 2020 yearly opening level at 1.1222 make a play.
Daily perspective:
A closer reading of price action reveals daily movement, after trading strongly lower in the early stages of last week, rebounded from Quasimodo support at 1.0768 on Thursday and clocked highs at 1.0875 Friday.
Should buyers continue to climb this week, resistance at 1.0995 is likely to be the first port of call, closely tailed by the 200-day SMA (orange – 1.1027).
H4 perspective:
Friday wrapped up sharply off best levels, unchanged at the close, despite widespread job loss in April.
Total non-farm payroll employment fell by 20.5 million in April, and the unemployment rate increased by 10.3 percentage points to 14.7 percent, according to the US Bureau of Labour Statistics[1]. The changes in these measures reflect the effects of the coronavirus (COVID-19) pandemic and efforts to contain it.
Thursday saw sell-stops south of 1.08 filled, with action subsequently regaining a strong footing north of the said round number. Friday, on the other hand, had resistance at 1.0853 cap EUR/USD upside, though beyond here, thin air is evident until reaching 1.09 and May’s opening level at 1.0943.
Areas of consideration:
Those who entered long off daily Quasimodo support at 1.0768 Thursday (a noted setup due to H4 price also taking out sell-stops beneath 1.08) will likely view H4 resistance at 1.0853 as a breakeven trigger. A move through 1.0853 may target 1.09, serving as an ideal take-profit target, with the option of holding a portion of the position open for May’s opening level at 1.0943.
Intraday buyers may also find a H4 close forming above 1.0853 interesting given the space seen to 1.09.
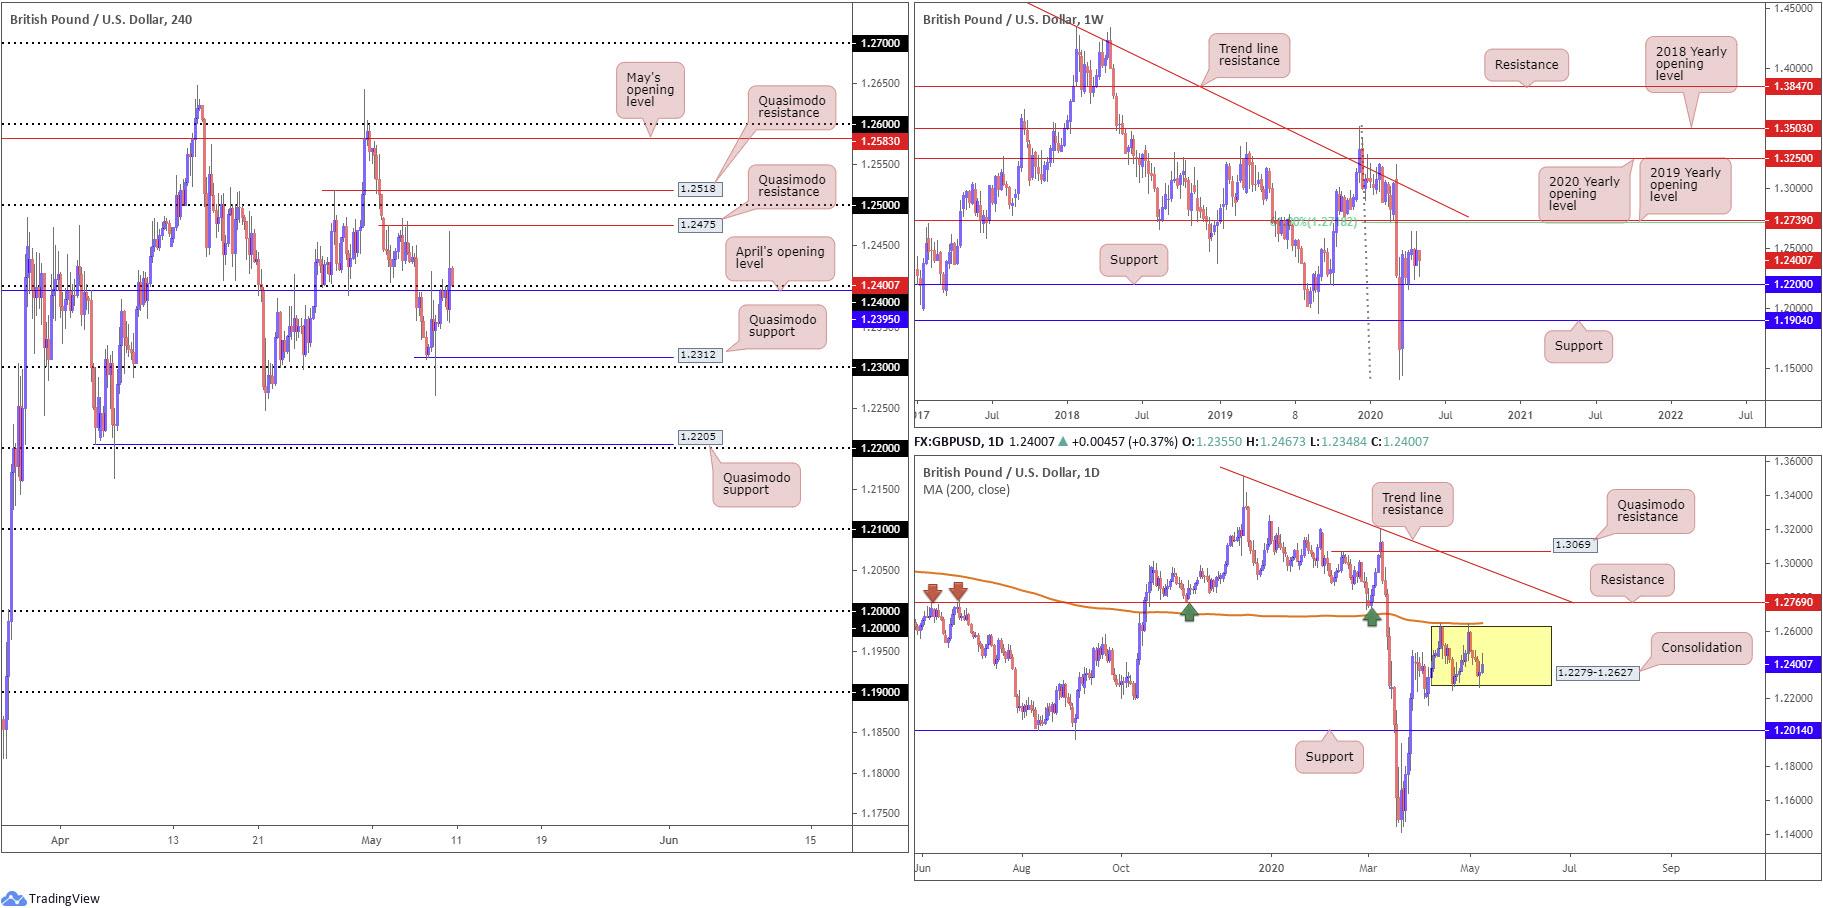
GBP/USD:
Weekly gain/loss: -0.69%
Weekly close: 1.2400
Weekly perspective:
Sterling, from a long-term perspective, remains unmoved in terms of technical structure.
From the weekly timeframe, support at 1.2200 offers a pivotal base, holding price action higher since the beginning of April. Scope to explore higher ground is visible until reaching the 2019 yearly opening level at 1.2739, which aligns closely with a 61.8% Fibonacci retracement ratio at 1.2718. A break of the aforementioned levels reveals a long-standing trend line resistance, taken from the high 1.5930.
Additionally, we see the pair pulled back from historic lows at 1.1409 in March. Seeing as the pair has been trending south since April 2018, sellers could eventually make a run for fresh lows.
Daily perspective:
Following Thursday’s rebound off 1.2279ish, this formed the basis for a consolidation area between 1.2279-1.2627 (yellow). Interestingly, the upper boundary of the aforesaid range is currently reinforced by the 200-day SMA (orange – 1.2647).
While the week may be contained within 1.2279-1.2627, traders will note external resistance sits at 1.2769 and support at 1.2014.
H4 perspective:
Despite UK banks closing in observance of May Day and widespread US joblessness, the pound managed to eke out modest gains vs. the buck Friday. In the early hours of US trading the euro latched onto a strong bid, powering through April’s opening level at 1.2395 and the 1.24 handle, and reaching highs a touch south of Quasimodo resistance at 1.2475 (1.25 is also seen close by, as is another Quasimodo resistance at 1.2518).
As we close out the week, price retested 1.24. Given the sharp pullback from session highs, a fakeout through the noted round number may play out.
With respect to support under 1.24, a Quasimodo formation inhabits waters just ahead of 1.23 at 1.2312.
Areas of consideration:
Coming off daily range lows, upside could gain speed over the week. For that reason, long plays above 1.24 might be on the menu for some traders.
Once, or indeed if, we reach H4 Quasimodo resistance at 1.2475, a push through to 1.25 is likely. However, seeing as how another H4 Quasimodo resistance is set close by at 1.2518, a fakeout through 1.25 (to run buy-stops) may also play out and produce a pullback as sellers sell into buy-stop liquidity above 1.25, providing an opportunity for longs to cover a portion of their positions and sellers to take part in a potential intraday selling opportunity. Overall, though, it is likely we’ll try and eventually fill the daily range, therefore moves to 1.26 could be in store this week.
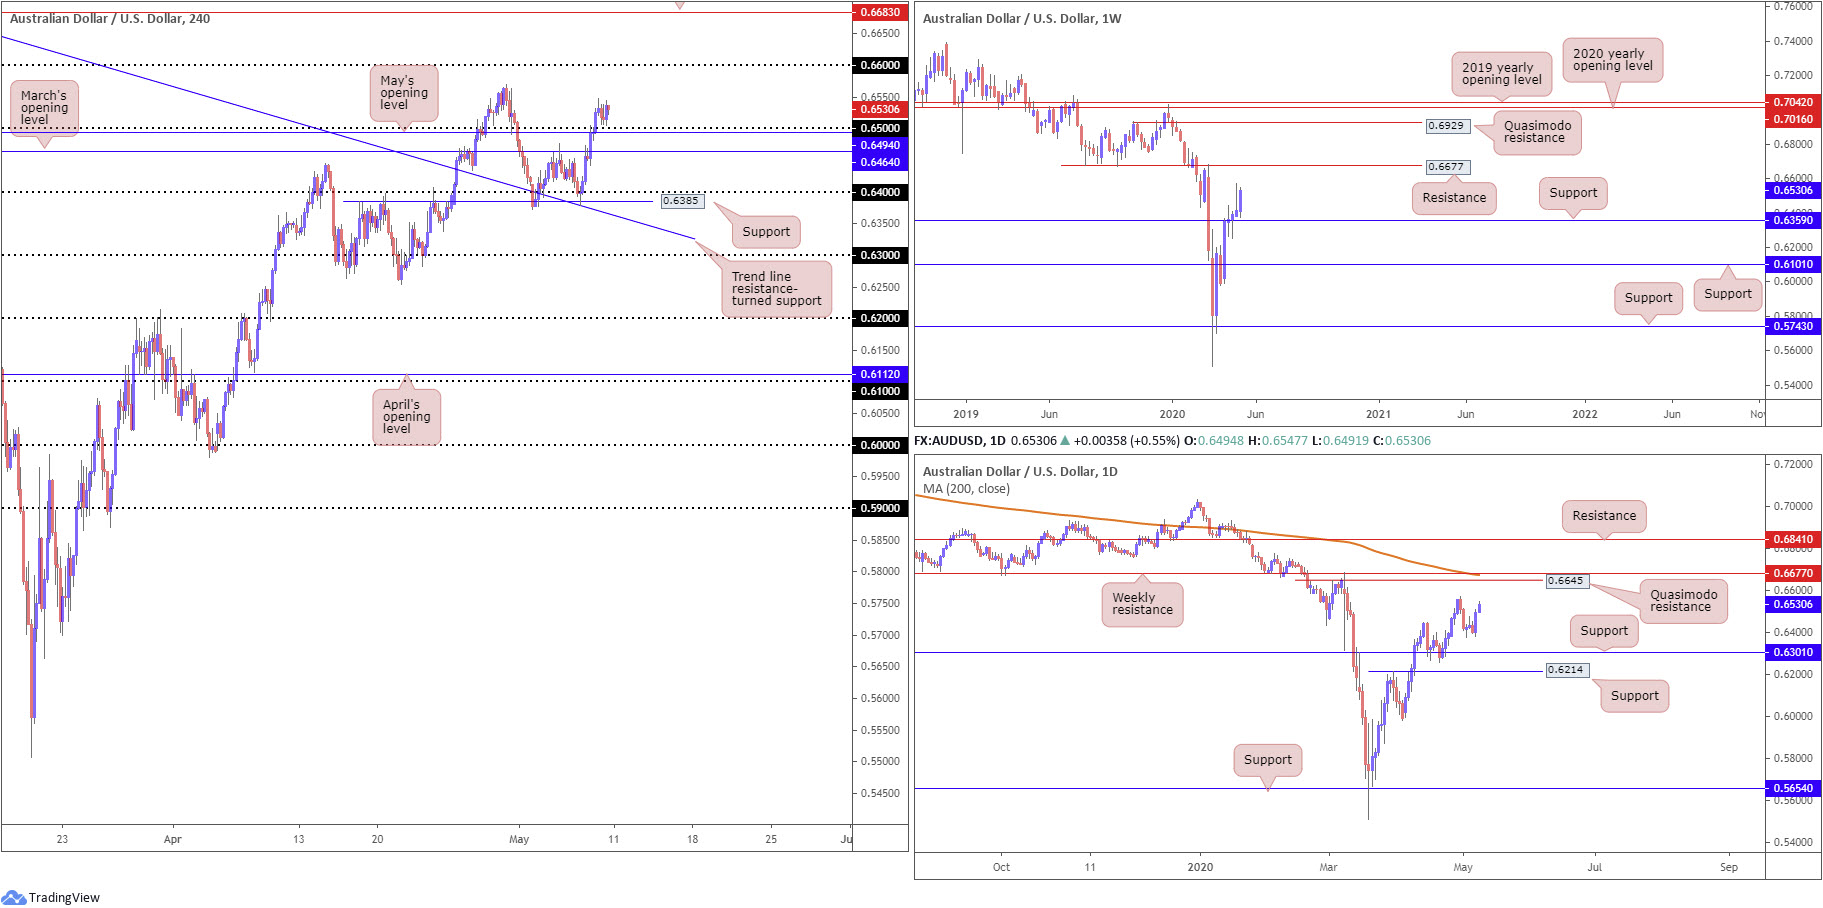
AUD/USD:
Weekly gain/loss: +1.78%
Weekly close: 0.6530
Weekly perspective:
AUD/USD’s overall tone remains biased to the upside on the weekly timeframe, recording its fifth consecutive weekly gain and disregarding the prior week’s shooting star candlestick configuration.
Closing the week out shaped by a near-full-bodied bullish candle ahead of support at 0.6359, traders’ crosshairs are likely fixed on resistance at 0.6677 this week.
Overall, however, longer-term traders will also note we have been trading lower since the start of 2018, therefore recognising that current upside from multi-year lows at 0.5506 could simply be a bulky pullback before pressing lower.
Daily perspective:
From the daily timeframe, local support is seen around 0.6370ish, with the possibility of the April 30 high at 0.6569 serving up resistance this week.
Major resistance can be seen at a Quasimodo formation from 0.6645, parked just ahead of the weekly resistance level mentioned above at 0.6677 and a 200-day SMA (orange – 0.6672).
Beneath 0.6370, 0.6301 is noted as possible support.
H4 perspective:
After marginally dropping through 0.64 on Thursday and testing trend line resistance-turned support, taken from the high 0.7031, and a Quasimodo resistance-turned support at 0.6385, we have since conquered a number of technical resistances, including the 0.65 handle. The next level of resistance can be seen around the April 30 high at 0.6569 highlighted on the daily timeframe, with a violation throwing light on the 0.66 handle.
Areas of consideration:
0.65, coupled with May’s opening level at 0.6494, could generate support in early trade this week, but a fakeout to March’s opening level at 0.6464 would not be a surprise. Conservative buyers will consider waiting and seeing how H4 action behaves before pulling the trigger; a H4 bullish candlestick signal off 0.65 would be a welcomed sight no doubt.
Upside targets, as highlighted above, form at 0.6569 and 0.66.
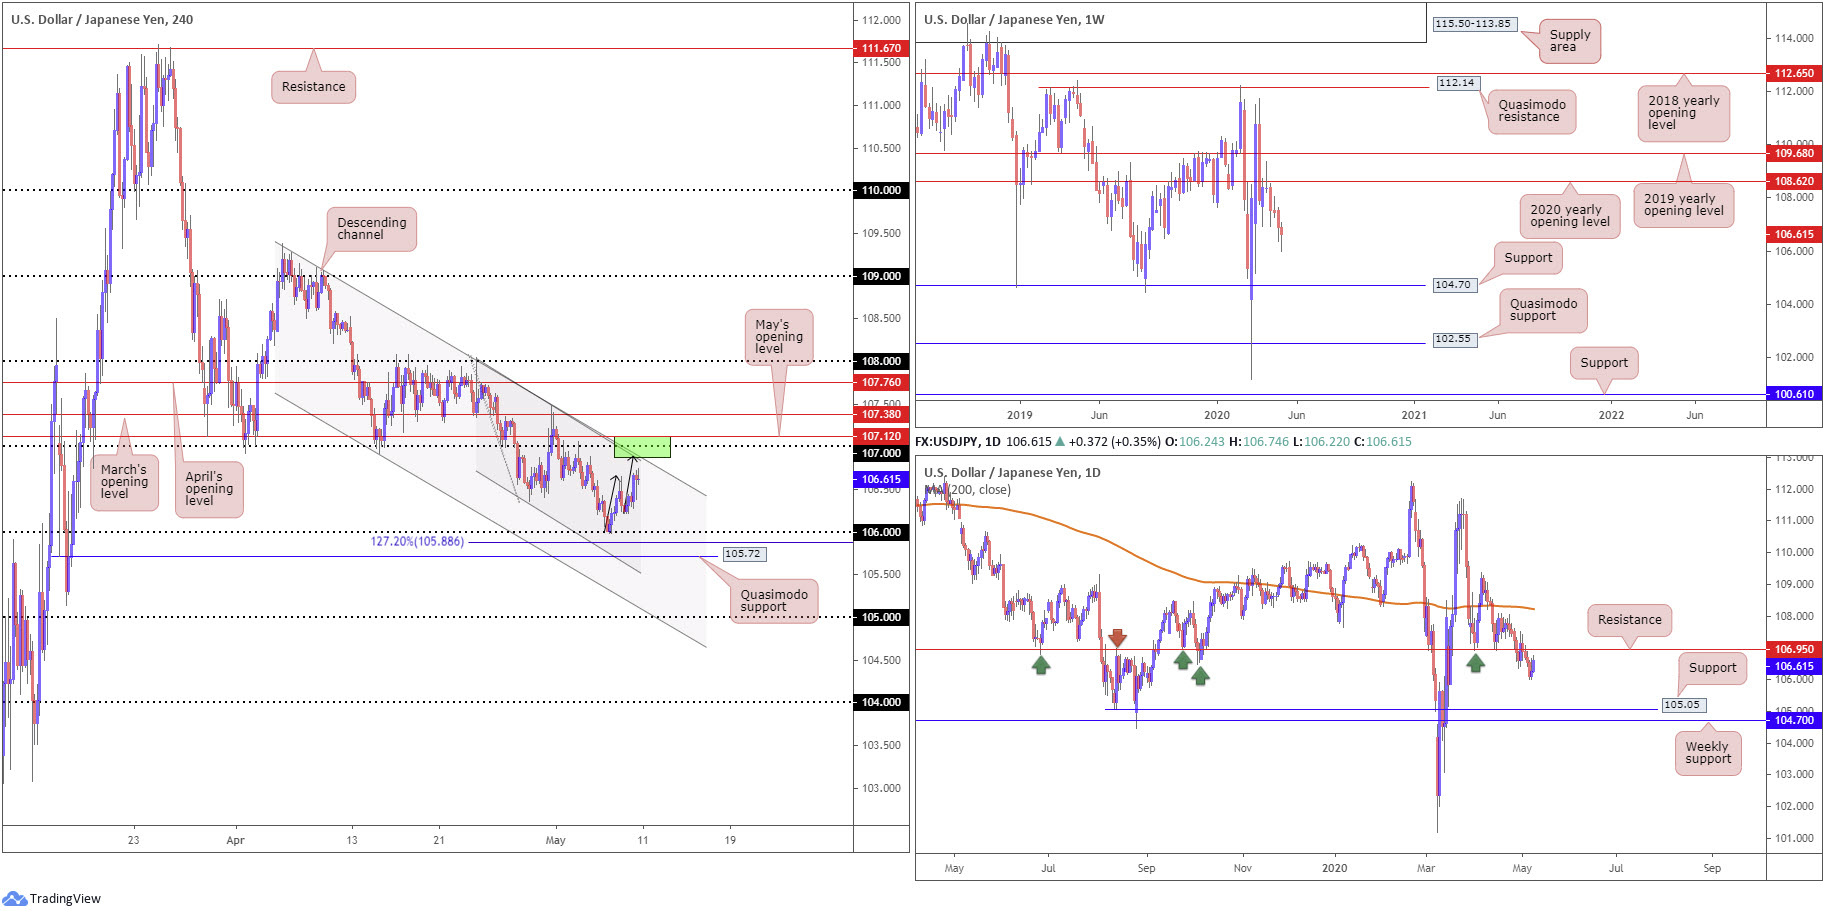
USD/JPY:
Weekly gain/loss: -0.25%
Weekly close: 106.61
Weekly perspective:
The weekly timeframe continues to underscore a bearish tone south of the 2020 yearly opening level at 108.62, with USD/JPY registering its fourth consecutive decline last week.
Despite extending losses, the session ended sharply off worst levels, forming a notable tail, with some analysts perhaps pointing to a hammer candlestick pattern (a bullish signal). Support on this timeframe is not expected to emerge until reaching 104.70.
Daily perspective:
Resistance at 106.95 maintains a presence on the daily timeframe, boasting significant history as far back as June 2019. At this stage, the odds of a retest forming at 106.95 is high. A strong close above the said base would likely sideline the possibility of further selling, though a rejection, preferably one with a little enthusiasm, could eventually see an approach to support at 105.05. Additional resistance is not seen on this timeframe until reaching the 200-day SMA (orange – 108.22).
H4 perspective:
USD/JPY finished the week marginally lower as traders digested dismal non-farm payrolls and unemployment data. The greenback rose modestly following the release, but failed to sustain gains past 106.70ish, pulling back to lows at 106.38. A recovery has been seen since, however, drawing the H4 candles towards two closely merging channel resistance levels (109.38/108.04), followed by 107 and May’s opening level at 107.12 (green).
It might also interest some traders to note that upside, since connecting with 106, has seen price form an approach by way of a potential AB=CD approach (black arrows) which terminates at the said channel resistances.
Areas of consideration:
The point which the two H4 channel resistance levels unite, along with the round number 107 and May’s opening level at 107.12, may offer resistance this week (green). This area also aligns with higher-timeframe direction, meaning both the weekly and daily timeframes exhibit scope to explore lower levels.
A fakeout through orders at 106 to Quasimodo support at 105.72 is also a scenario worth underlining this week, in the event we push lower. A whipsaw through 106 followed up with a H4 close north of the round number could signal buyers want to take things higher. However, this would unfortunately entail going up against daily and weekly directional flow.
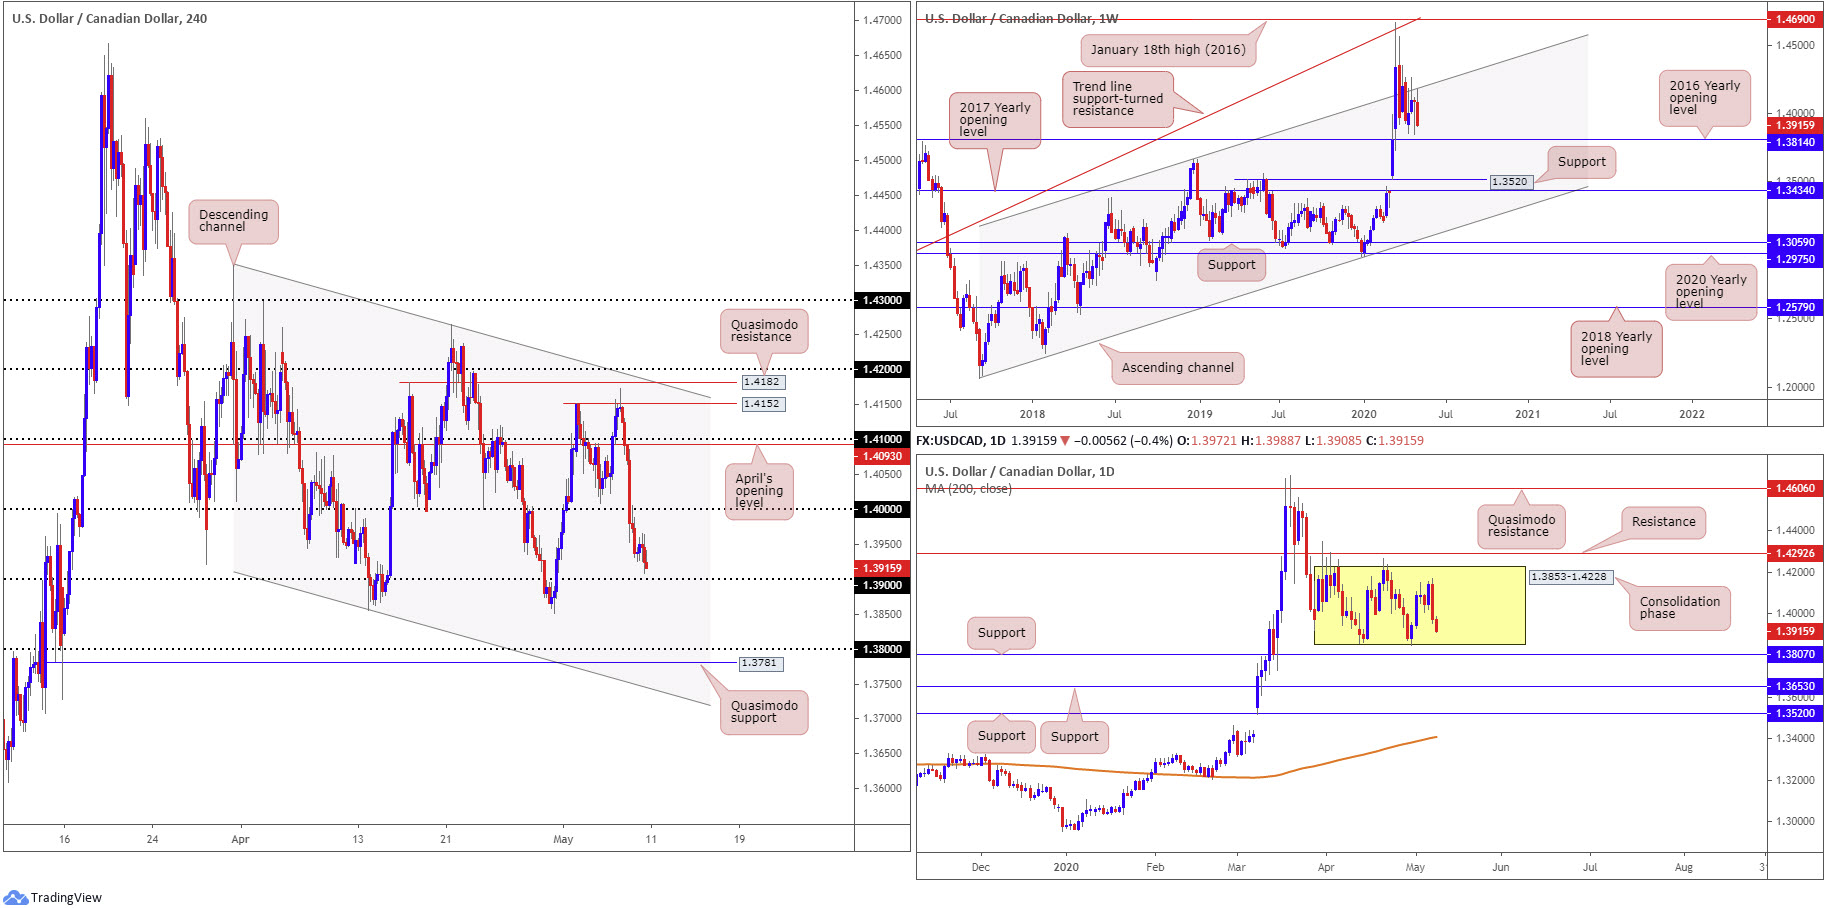
USD/CAD:
Weekly gain/loss: -1.22%
Weekly close: 1.3915
Weekly perspective:
USD/CAD came within inches of clipping a long-term channel resistance, taken from the high 1.3661, last week, before collapsing to lows at 1.3908. Overlooking the prior week’s dragonfly doji candlestick pattern, sellers face possible support off the 2016 yearly opening level at 1.3814 this week.
1.3814 stands in a reasonably healthy position, as overall we’ve been trending higher since September 2017.
Daily perspective:
Following Thursday’s bearish outside day formation, buyers took a back seat Friday, generating additional losses into the close. Since kicking off April, we have been carving out a consolidation between 1.3853-1.4228. Areas outside of this base can be found at resistance drawn from 1.4292 and support at 1.3807.
The 200-day SMA (orange – 1.3407), as you can probably see, has been drifting northbound since March.
H4 perspective:
US/Canadian employment data failed to deliver much in terms of price movement Friday.
A record number of Americans lost their jobs in April. Total non-farm payroll employment fell by 20.5 million in April, and the unemployment rate increased by 10.3 percentage points to 14.7 percent, according to the US Bureau of Labour Statistics. Canada also saw record-breaking job loss in April along with surging unemployment.
Friday’s technical briefing noted the following (italics):
Kicking off Thursday by way of a H4 shooting star signal through 1.4152, the pair nosedived through 1.41, April’s opening level at 1.4093 and the 1.40 handle. The latter, as evident from the chart, is currently being retested as resistance, unlocking the possibility of extending losses to 1.39.
Friday held the underside of 1.40 by means of a half-hearted shooting star candlestick formation and, as anticipated, crossed into lower terrain, closing a few points short of 1.39. Beyond this figure, the lower edge of the daily range at 1.3853 may hamper downside attempts, though a close through here could see 1.38/Quasimodo support enter play at 1.3781.
Areas of consideration:
1.39 will likely invite an approach in early trade this week; however, longs from this region may unnerve some traders as weekly price eyes 1.3814 and daily price is poised to grip 1.3853.
As a result of the above, a H4 close under 1.39 may see sellers strengthen their grip and provide an opportunity for breakout sellers.
Should we reach as far south as 1.38 this week, technical structure suggests sellers may lose their flavour and hand the baton to buyers. The 1.38 handle brings with it a H4 Quasimodo support at 1.3781, a H4 channel support (taken from the low 1.3855) weekly support (the 2016 yearly opening level) at 1.3814 and daily support at 1.3807. What’s also interesting around 1.38 is a test of this psychological level entails whipsawing through the lower edge of the current daily range (1.3853), potentially providing liquidity to buy into from sell-stops.
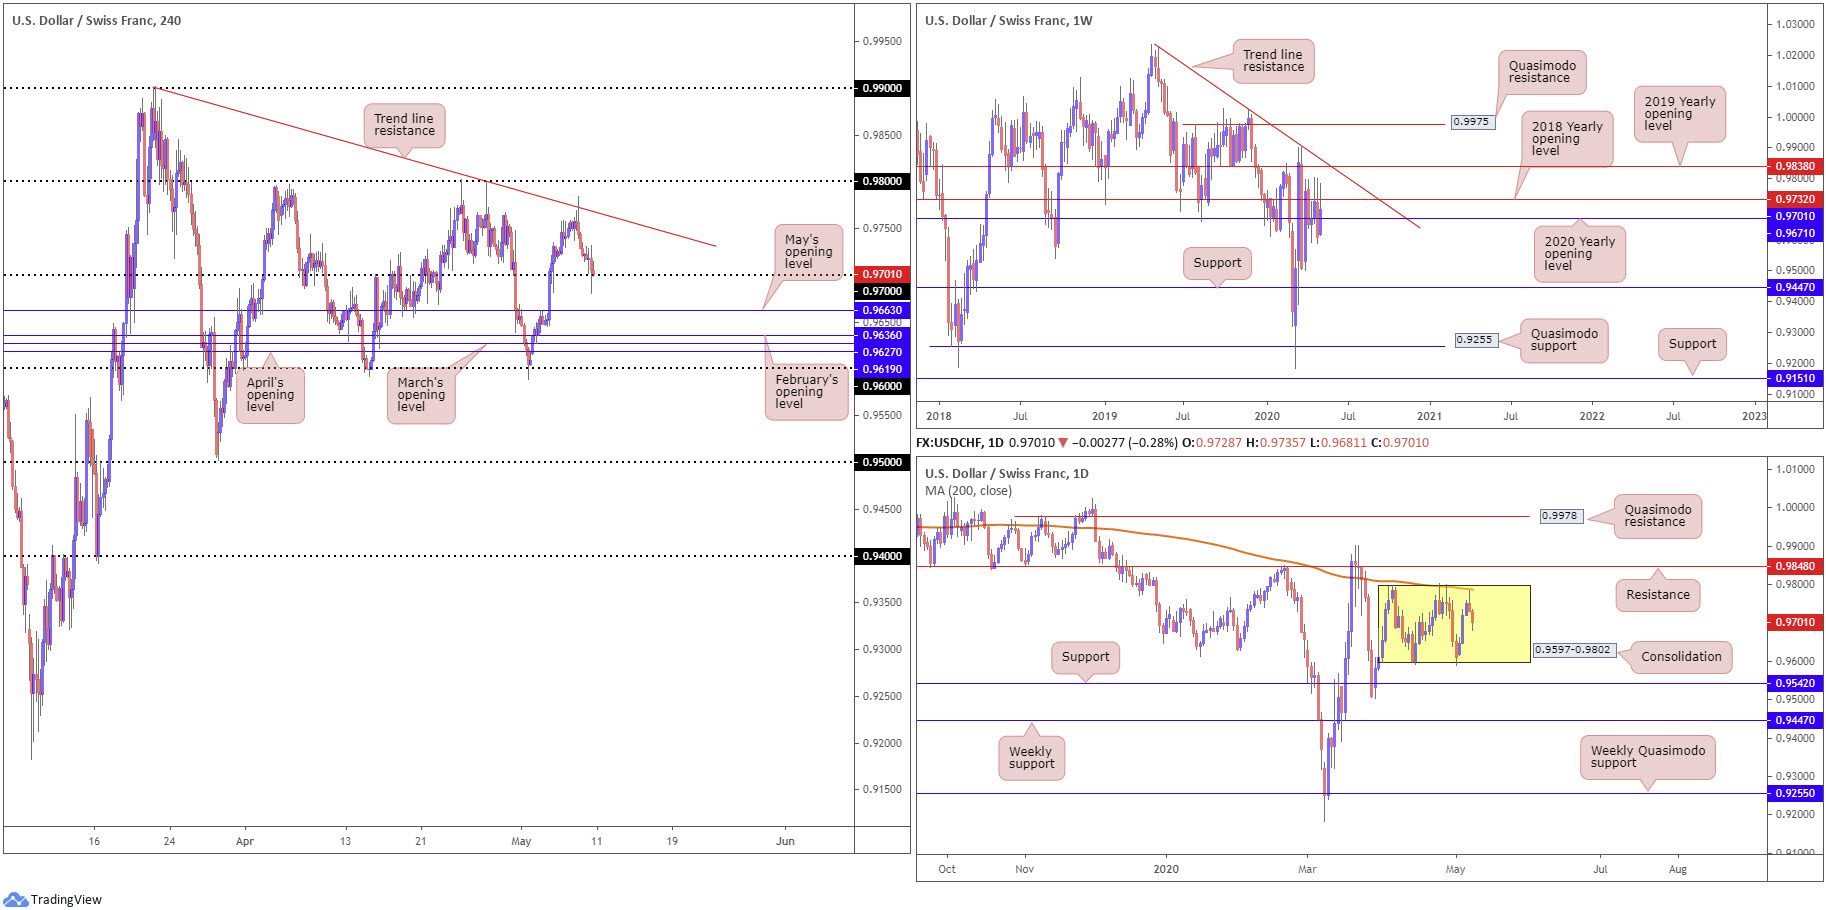
USD/CHF:
Weekly gain/loss: +0.95%
Weekly close: 0.9701
Weekly perspective:
Back-to-back selling wicks grace the weekly chart, representing thin air above the 2018 yearly opening level at 0.9732. In terms of resistance above 0.9732, we have a trend line formation, extended from the high 1.0226, along with the 2019 yearly opening level at 0.9838.
Probable support is seen at the 2020 yearly opening level from 0.9671, with a break throwing light on the possibility of a run to support coming in at 0.9447.
Daily perspective:
Price action is seen fading levels just ahead of the upper boundary of a month-long range between 0.9597-0.9802. Note the 200-day SMA (orange – 0.9786) is also seen circling the upper edge of the said range. Outside of the consolidation, we see resistance at 0.9848 while support is found at 0.9542.
H4 perspective:
Following Friday’s US job’s data, which provided a temporary relief rally to highs at 0.9731, price ultimately extended Thursday’s rejection off trend line resistance, etched from the high 0.9900, consequently surpassing 0.97 to lows at 0.9681.
A H4 close beneath 0.97 reveals a relatively clear run to May’s opening level at 0.9663, followed by 0.9619/0.9636, an area made up of April, March and February’s opening levels.
Areas of consideration:
Those short the current H4 trend line resistance have likely reduced risk to breakeven at 0.97 and banked a large portion of their position.
Although H4 price has yet to pencil in anything meaningful to the upside off 0.97 (echoing potential weakness), and daily price indicates further selling may be seen, moves under 0.97 are likely. However, traders are urged to take into account the 2020 yearly opening level lurking close by at 0.9671. This may deter breakout sellers south of 0.97, leaving less than 30 pips of room to play with. This is not to say moves beneath 0.97 won’t be fruitful, it is more to highlight a potential road bump.
Moves higher this week, action that immerses the current H4 trend line, may draw 0.98 into the spotlight, which aligns with the upper boundary of the daily range at 0.9802 and the 200-day SMA. For that reason, a show from sellers here is possible.
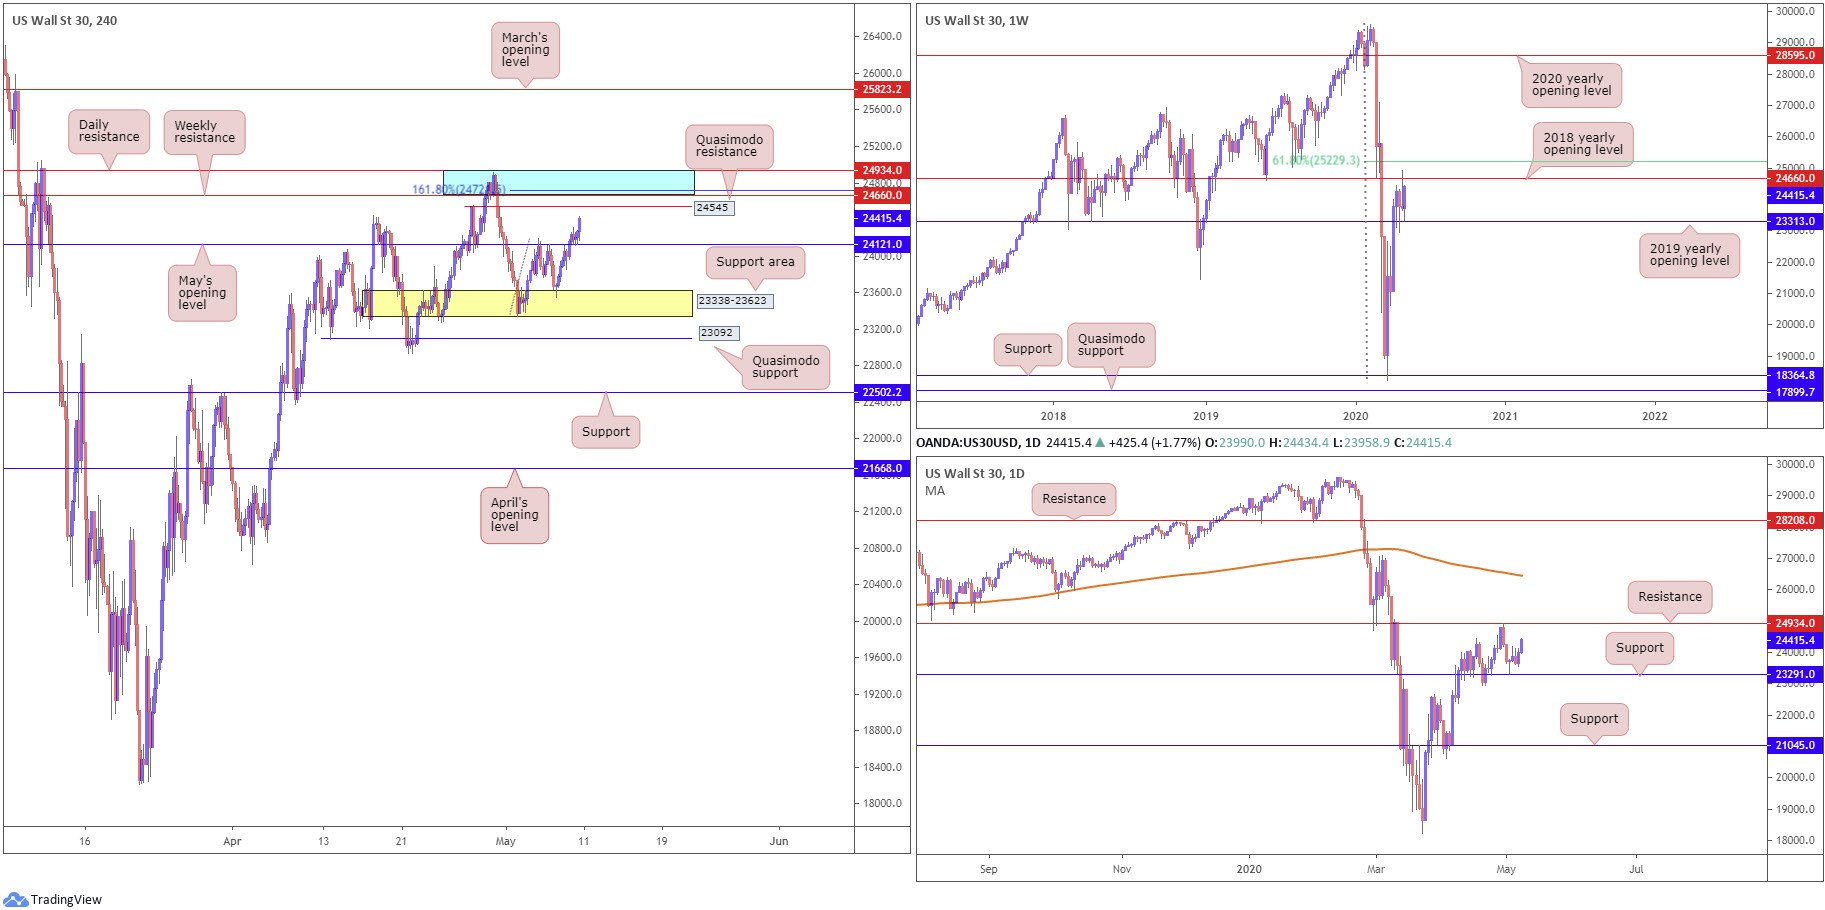
Dow Jones Industrial Average:
Weekly gain/loss: +2.90%
Weekly close: 24415
Weekly perspective:
Technical action welcomed a strong offensive play ahead of the 2019 yearly opening level at 23313 last week, positioning price in close proximity of the 2018 yearly opening level at 24660 and 61.8% Fibonacci retracement ratio at 25229. This pretty much invalidates the prior week’s gravestone doji candlestick pattern, a formation that generally implies sellers may have the upper hand.
Breaking through 25229 this week potentially sets the stage for moves towards the 2020 yearly opening level at 28595; a violation of 23313, on the other hand, shines light on support from 18364.8.
Daily perspective:
The week kicked off with a hammer candlestick signal, a few points ahead of support at 23291. Mid-week was reasonably lacklustre until buyers regained consciousness and elevated price higher into the close, placing resistance at 24934 on the radar.
H4 perspective:
Wall Street’s main indexes finished higher Friday, lifted on the back of a grim April jobs report that wasn’t as bad as initially feared. The Dow Jones Industrial Average rallied 455.43 points, or 1.91%; the S&P 500 advanced 48.61 points, or 1.69%, and the tech-heavy Nasdaq 100 concluded higher by 118.48 points, or 1.30%.
24934/24660, an area (blue) marked on the H4 timeframe made up of daily resistance at 24934 and weekly resistance at 24660 (the 2018 yearly opening level), may re-enter the fight this week. Note also we see a 161.8% Fibonacci extension at 24721 merging with the blue zone, and a nearby Quasimodo resistance seen at 24545.
In terms of support, May’s opening level at 24121 offers a nearby ‘floor’. A break, nonetheless, could see the H4 support area at 23338-23623 (yellow) come into being once again.
Areas of consideration:
24934/24660 has the potential to hamper upside this week and provide sellers a platform. Conservative sellers may seek candlestick confirmation before committing; yet, aggressive traders may enter at 24660 with protective stop-loss orders tucked above 24934.
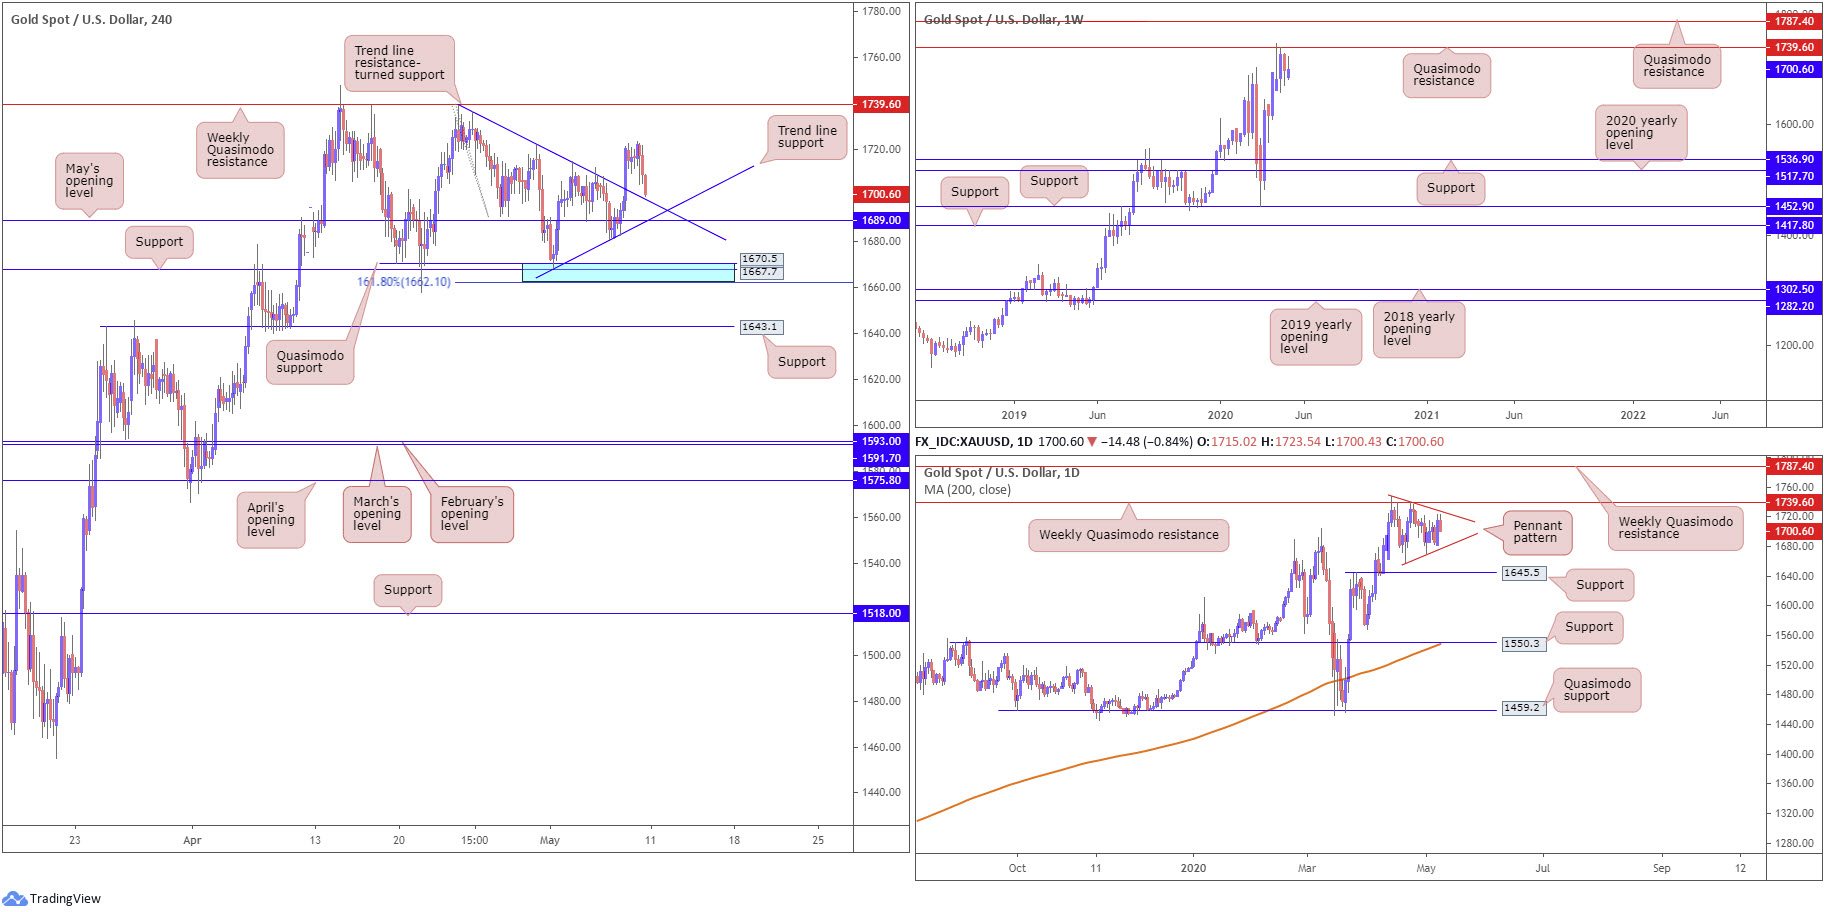
XAU/USD (GOLD):
Weekly gain/loss: +0.14%
Weekly close: 1700.6
Weekly perspective:
Buyers and sellers continue to square off around the underside of Quasimodo resistance at 1739.6. Downside from this region echoes the prospect of eventually reaching support at 1536.9, while a breach of 1739.6 shifts focus towards another layer of Quasimodo resistance at 1787.4. It may also interest some traders to note the primary trend on gold has faced a northerly trajectory since 2016.
Daily perspective:
In similar fashion to the weekly timeframe, the weekly Quasimodo formation at 1739.6 is also posted as prominent resistance on the daily chart. The difference can be seen with reference to supports: the next support target on the daily timeframe falls in at 1645.5. Pattern traders may also acknowledge a forming pennant pattern at the underside of the weekly Quasimodo base, established from a high of 1747.7 and a low of 1658.1.
H4 perspective:
Upbeat risk sentiment dented demand for bullion Friday, finishing 0.84% lower against the greenback. Trend line resistance-turned support, taken from the high 1739.1 is in the firing range, reinforced closely by another trend line support, extended from the low 1668.0, and May’s opening level at 1689.0. South of here, traders may recognise familiar support (blue), comprised of a 161.8% Fibonacci extension point at 1662.1, support at 1667.7 and Quasimodo support at 1670.5.
Areas of consideration:
Until we close above the weekly Quasimodo resistance at 1739.6, swing traders are unlikely to execute fresh long positions. Printing a H4 close above 1739.6 will see breakout buyers make a show, perhaps taking aim at weekly Quasimodo resistance from 1787.4. This would also likely seal a daily close above the upper boundary of the current daily pennant pattern, adding fuel to any upside.
Intraday, however, could see a response from May’s opening level at 1689.0 on the H4 timeframe, bolstered by the closely converging trend line supports. Failure to hold here swings focus to the H4 support zone highlighted above between 1662.1/1670.5.
Regarding short positions, traders will note the area beneath H4 support at 1643.1. Overthrowing this level clears the pathway south to at least 1600.0, offering plenty of room for sellers to consider bearish themes.
The accuracy, completeness and timeliness of the information contained on this site cannot be guaranteed. IC Markets does not warranty, guarantee or make any representations, or assume any liability regarding financial results based on the use of the information in the site.
News, views, opinions, recommendations and other information obtained from sources outside of www.icmarkets.com.au, used in this site are believed to be reliable, but we cannot guarantee their accuracy or completeness. All such information is subject to change at any time without notice. IC Markets assumes no responsibility for the content of any linked site.
The fact that such links may exist does not indicate approval or endorsement of any material contained on any linked site. IC Markets is not liable for any harm caused by the transmission, through accessing the services or information on this site, of a computer virus, or other computer code or programming device that might be used to access, delete, damage, disable, disrupt or otherwise impede in any manner, the operation of the site or of any user’s software, hardware, data or property.
[1] https://www.bls.gov/news.release/archives/empsit_05082020.htm


