DXY:
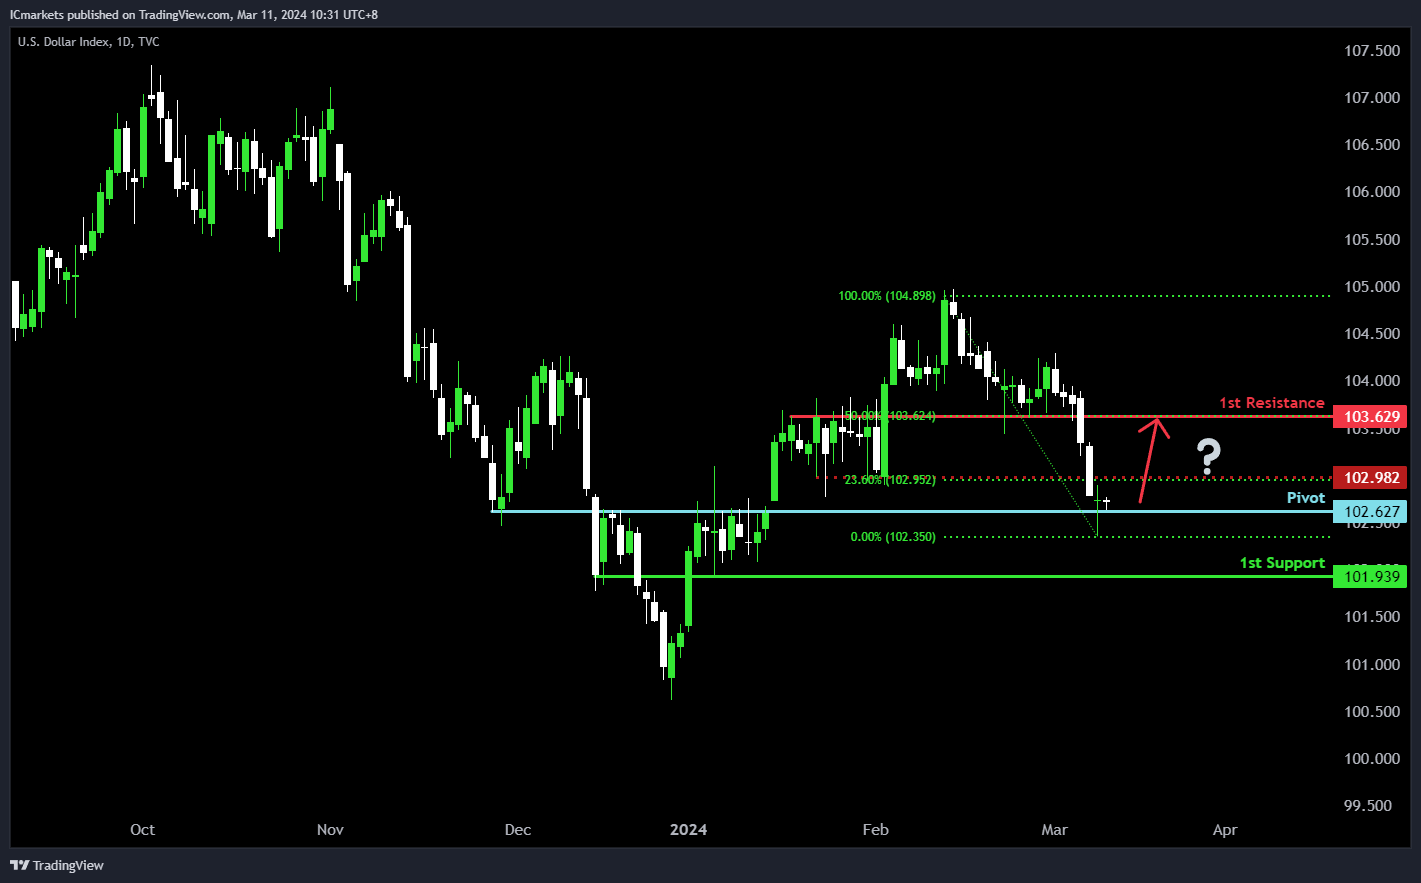
The DXY (Dollar Index) chart reflects bullish momentum, indicating a possible bullish rebound near the pivot level and subsequent movement towards the 1st resistance. The pivot at 102.62 acts as significant overlap support, suggesting potential buyer intervention for a bullish bounce. The 1st support at 101.93 reinforces this pattern.
On the resistance side, the 1st resistance at 103.62, along with the 50% Fibonacci Retracement, could impede upward movement due to increased selling pressure. Further resistance is seen at 102.98, supported by the 23.60% Fibonacci Retracement, potentially intensifying selling pressure in that zone.
EUR/USD:
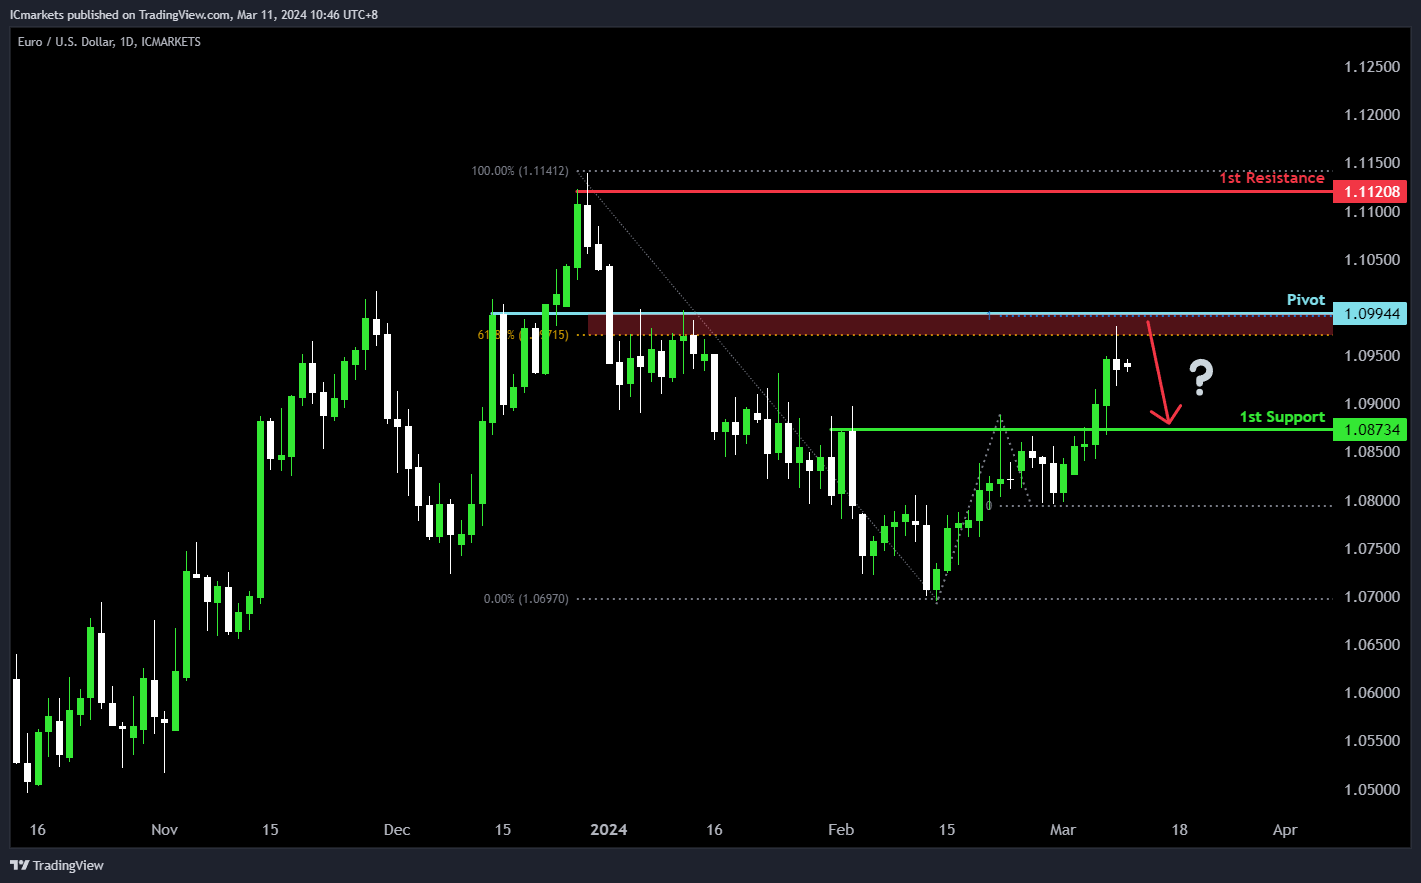
The EUR/USD chart indicates a bearish momentum, suggesting a potential bearish reaction near the pivot level, followed by a decline towards the 1st support.
The pivot at 1.0994 serves as a significant overlap support, coinciding with the 61.80% Fibonacci Retracement level. The 1st support at 1.0873 also provides additional reinforcement as an overlap support level,
On the resistance side, the 1st resistance at 1.1120 is identified as a swing high resistance, suggesting historical significance as a level where selling interest has intensified, potentially impeding further upward movement.
.
EUR/JPY:
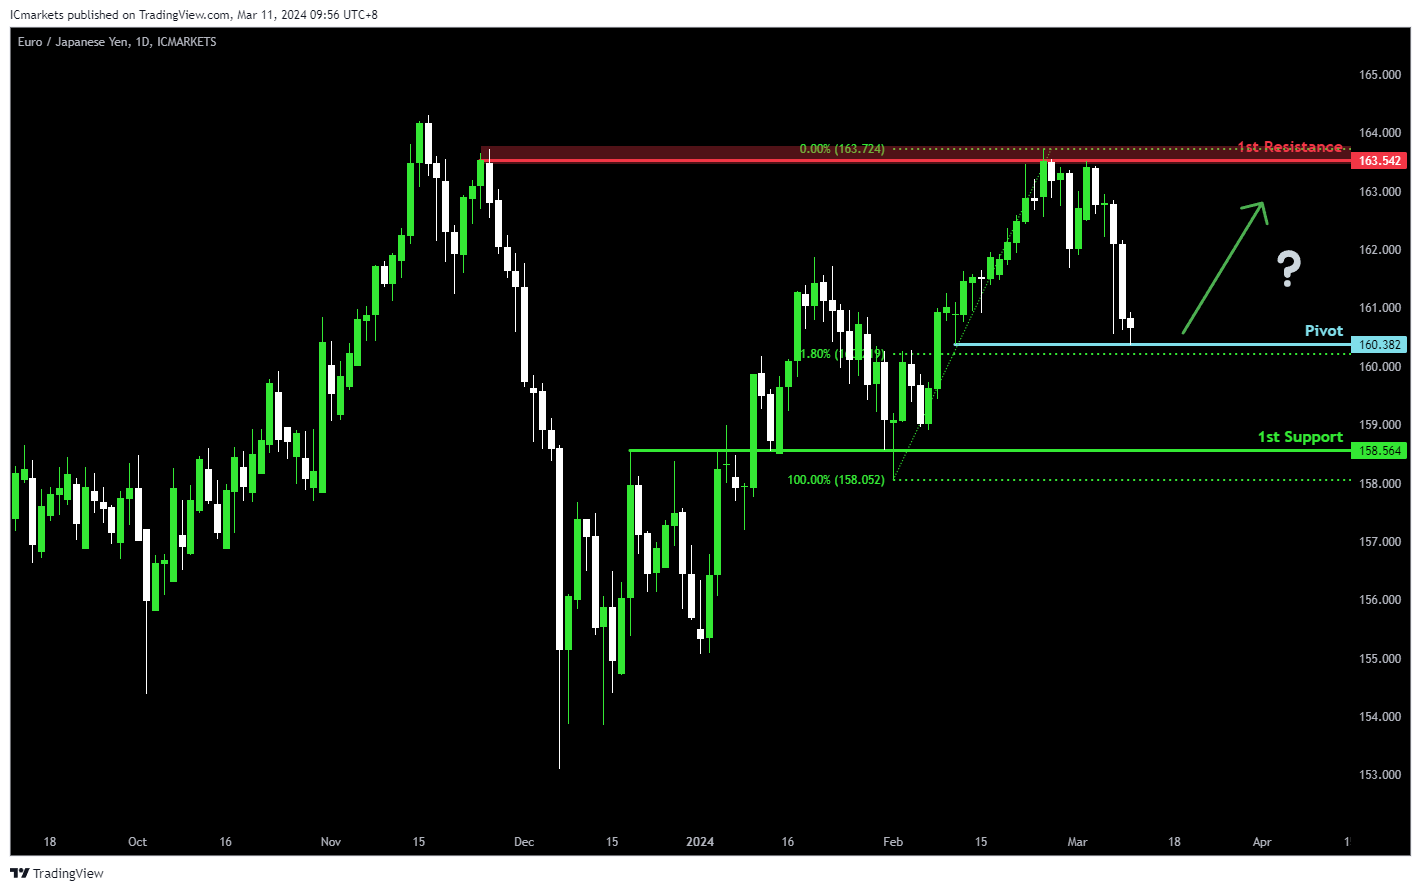
The EUR/JPY chart currently demonstrates bullish momentum, indicating a potential continuation of the upward trend. There are indications that price could potentially make a bullish bounce off the 1st support level and head towards the 1st resistance.
The Pivot level at 160.382 aligns with the 61.80% Fibonacci Retracement, suggesting a significant historical level where buying interest might emerge. Additionally, the 1st support at 158.564 is identified as an overlap support, further reinforcing its importance as a potential area of support.
On the resistance side, the 1st resistance level at 163.542 is characterized as a swing high resistance, indicating a historical barrier to upward movement.
EUR/GBP:
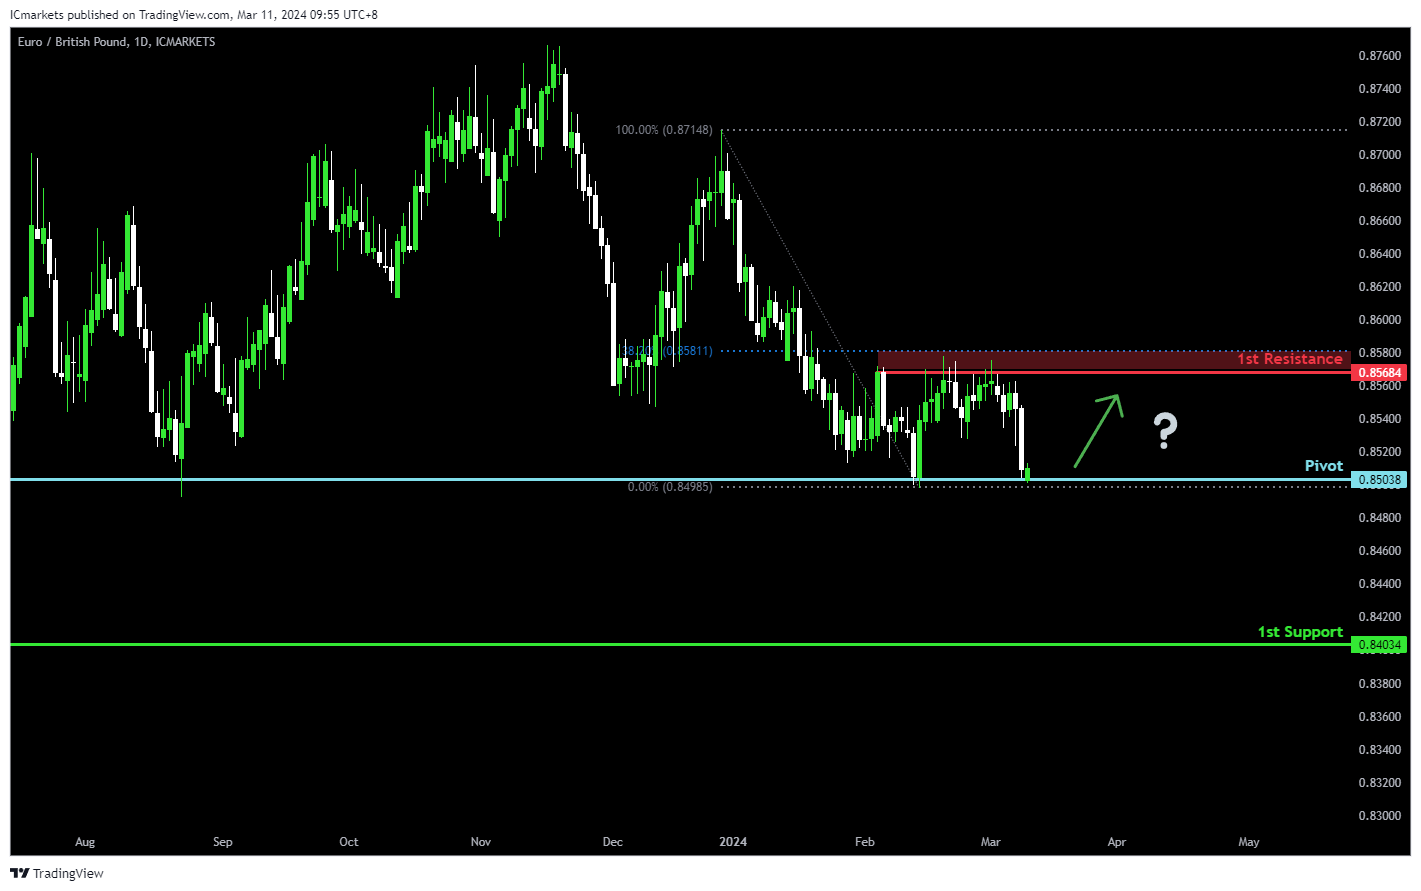
The EUR/GBP chart currently demonstrates bullish momentum, indicating a potential continuation of the upward trend. There are indications that price could potentially make a bullish bounce off the 1st support level and head towards the 1st resistance.
The Pivot level at 0.85038 serves as a swing low support, suggesting a significant historical level where buying interest could emerge. Additionally, the 1st support at 0.84034 is identified as a pullback support, further reinforcing its importance as a potential area of support.
On the resistance side, the 1st resistance level at 0.85684 is characterized as a swing high resistance, indicating a historical barrier to upward movement. Furthermore, the confluence with the 38.20% Fibonacci Retracement adds to its significance as a potential barrier to further bullish movement.
GBP/USD:
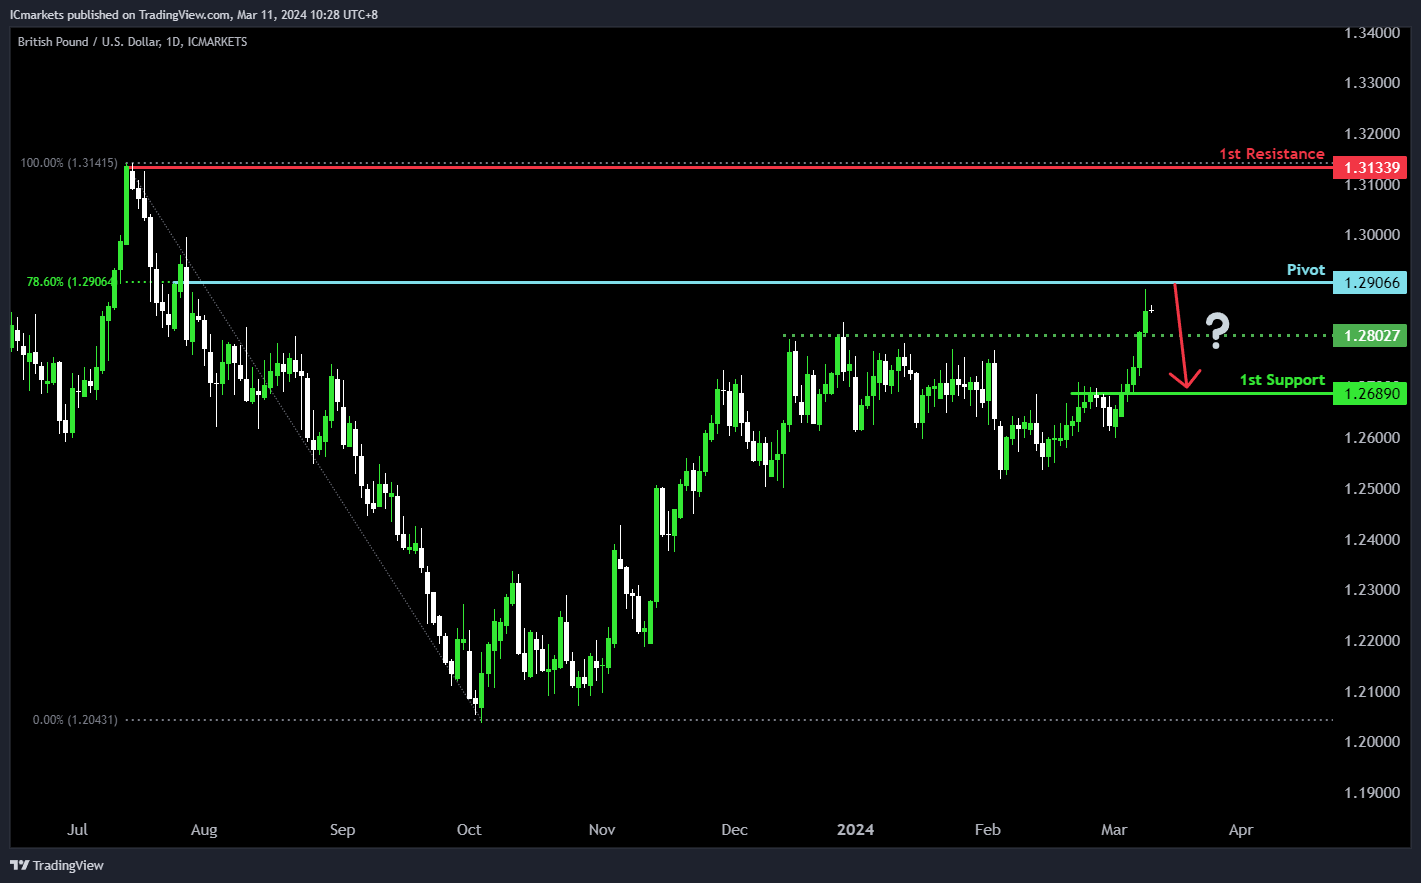
The GBP/USD chart reflects a bearish momentum, suggesting a possible bearish response around the pivot level, leading to a decline towards the 1st support.
The pivot at 1.2906 exhibits notable resistance, marked by a swing high and the 78.60% Fibonacci Retracement level, implying a potential area of selling pressure. Additionally, the 1st support at 1.2689 serves as an overlap support, indicating a historical level where buying interest has emerged, potentially offering a foothold for price support.
Conversely, the 1st resistance at 1.3233 presents a significant barrier, characterized by a swing high, likely attracting selling interest and impeding further upward movement.
.
GBP/JPY:
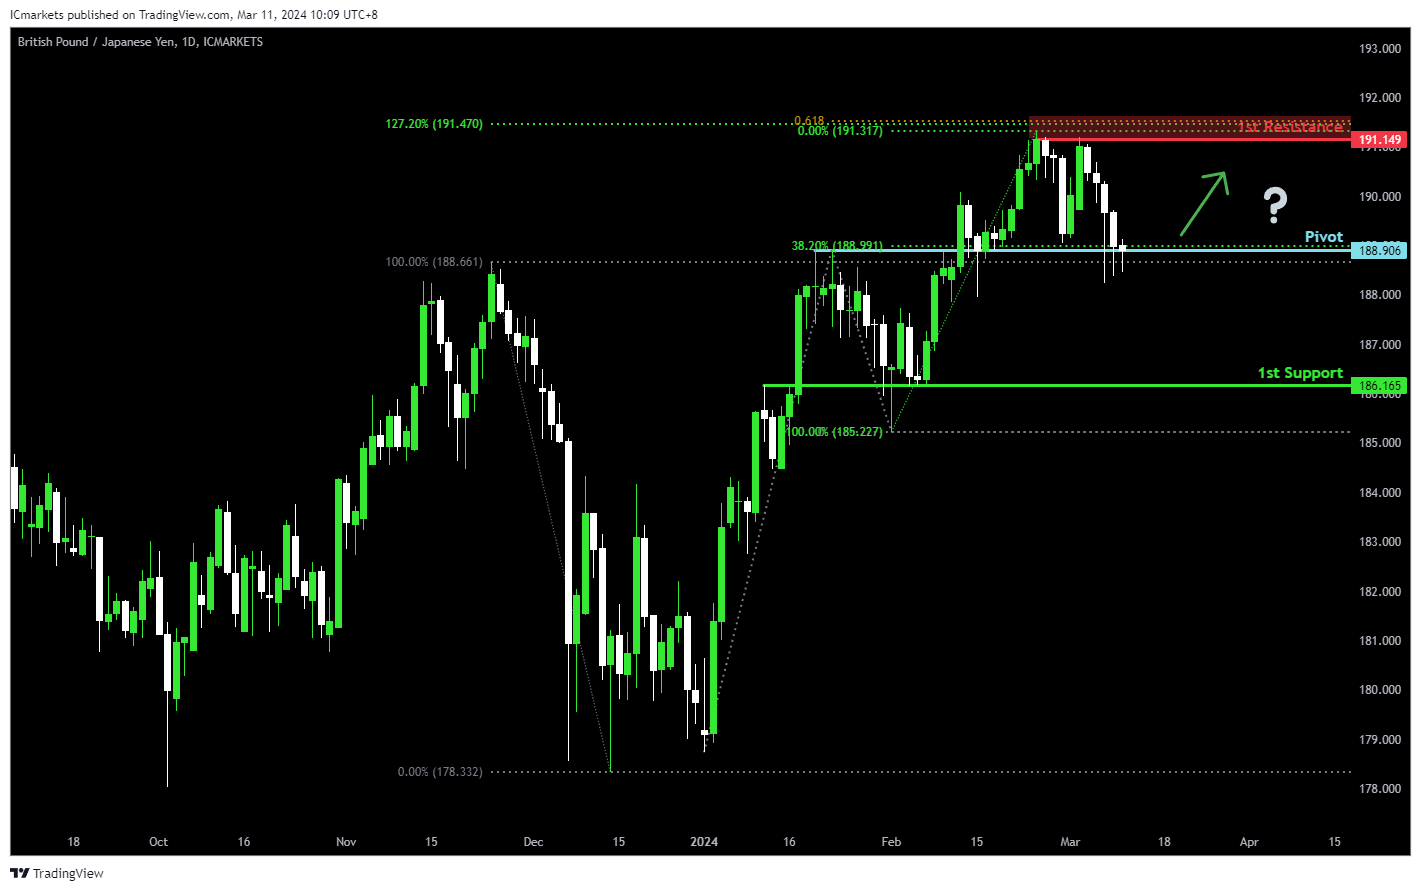
The GBP/JPY chart currently exhibits bullish momentum, suggesting a potential continuation of the upward trend. There are indications that price could potentially make a bullish bounce off the 1st support level and head towards the 1st resistance.
The Pivot level at 188.906 serves as a pullback support and coincides with the 38.20% Fibonacci Retracement level, indicating a significant historical level where buying interest may emerge. Additionally, the 1st support at 186.165 further reinforces the potential area of support.
On the resistance side, the 1st resistance level at 191.149 is identified as a swing high resistance, suggesting a historical barrier to upward movement. Furthermore, the confluence with the 61.80% Fibonacci Projection and the 127.20% Fibonacci Extension strengthens the significance of this resistance level.
USD/CHF:
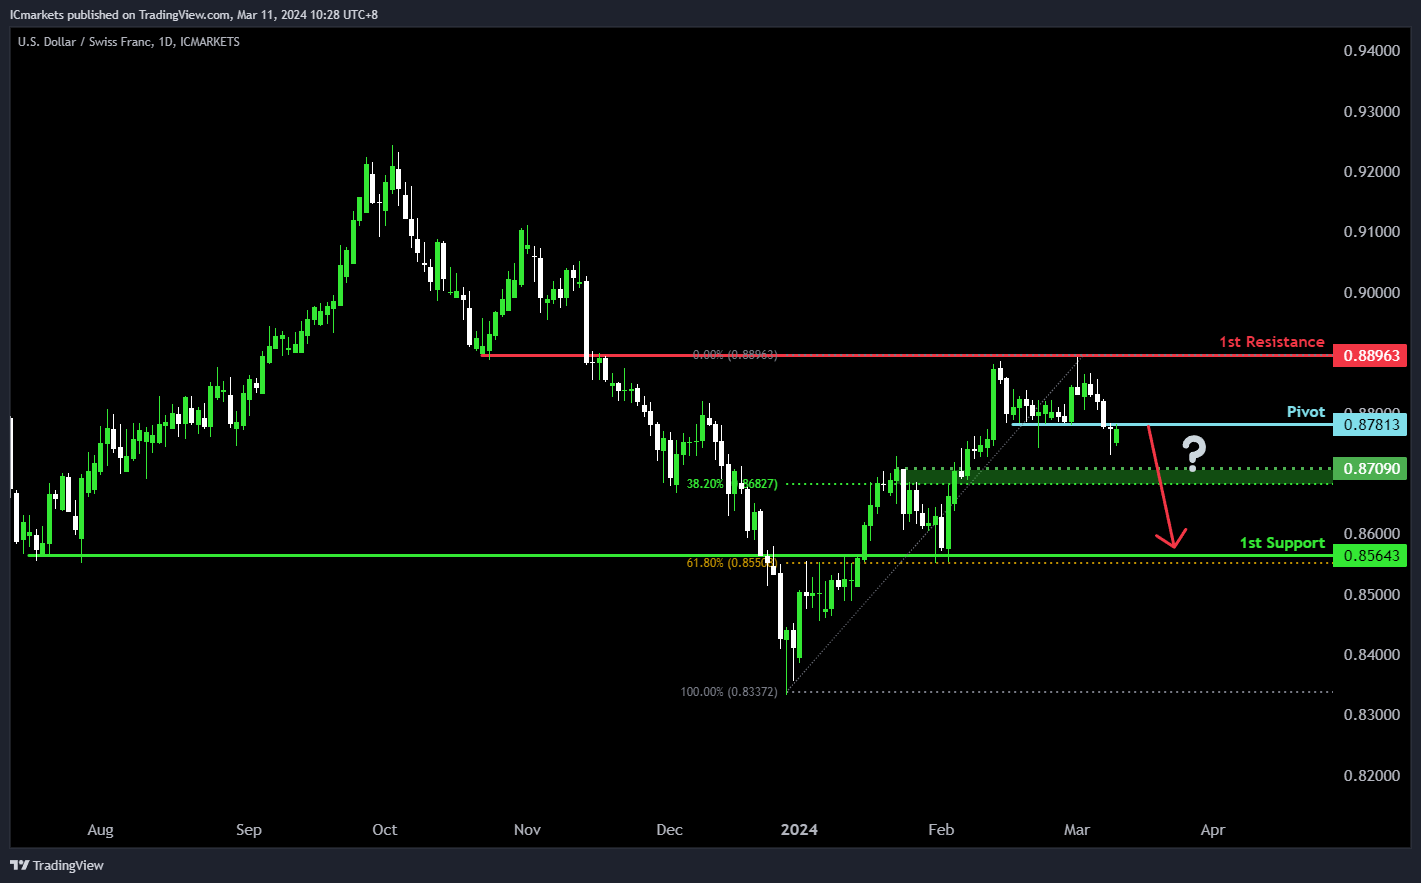
The USD/CHF chart indicates a bearish trend, suggesting a possible bearish response around the pivot level, leading to a decline towards the 1st support.
The pivot at 0.8781 acts as a significant level of pullback resistance, indicating potential selling pressure. Furthermore, the 1st support at 0.8564, coupled with the 61.80% Fibonacci Retracement, presents an overlap support, historically attracting buyers’ interest and potentially providing a level of price support.
Conversely, the 1st resistance at 0.8896 serves as an overlap resistance, marking a significant barrier where selling interest may intensify, hindering further upward movement in the price.
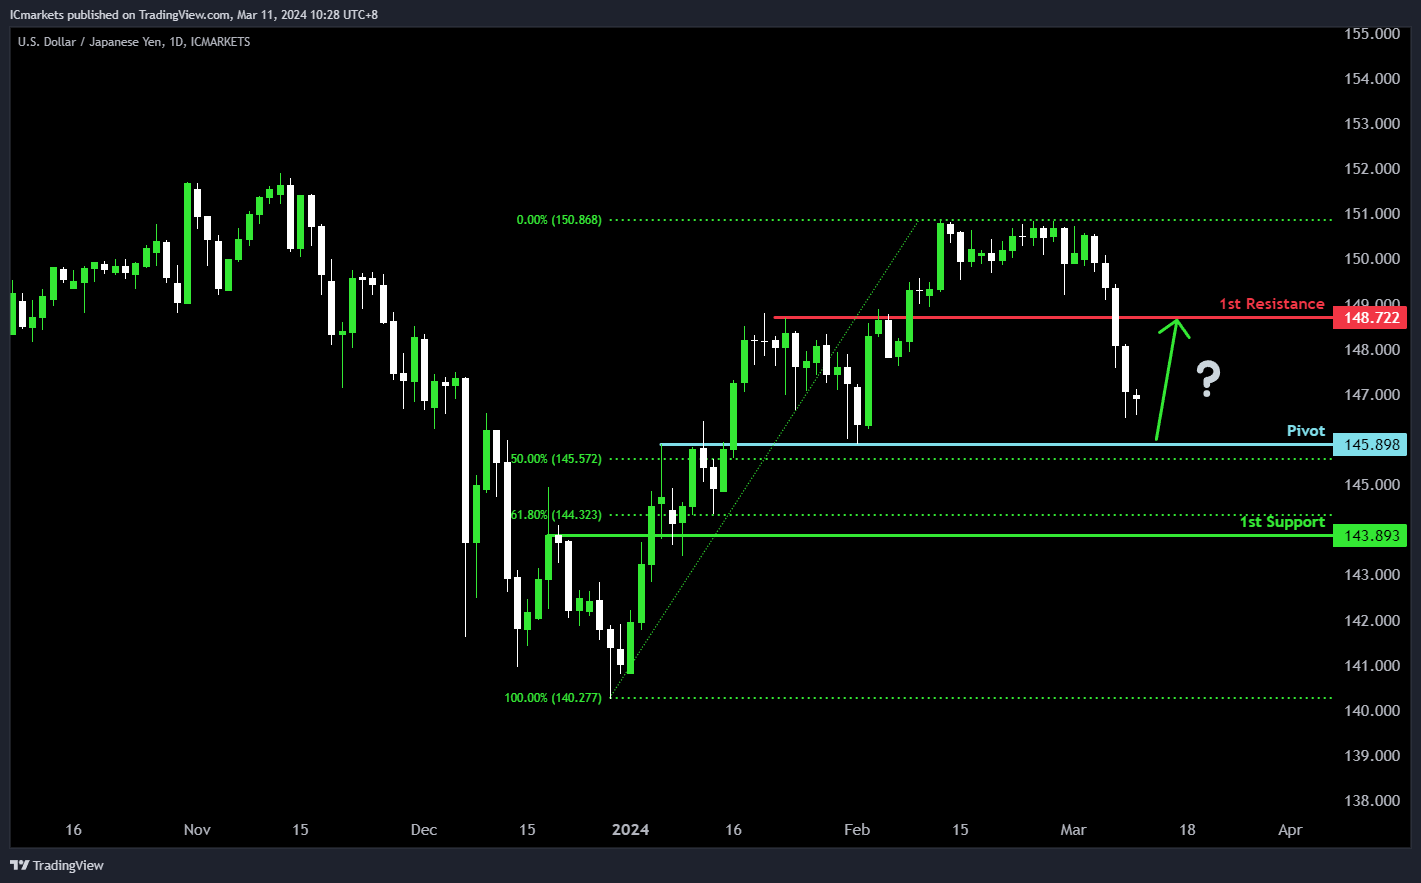
USD/JPY:
The USD/JPY chart indicates bullish momentum, suggesting a potential bullish bounce around the pivot level, leading towards the 1st resistance.
The pivot at 145.89 serves as a significant overlap support, coinciding with the 50% Fibonacci Retracement level, indicating a potential area where intervention may occur, supporting the price. Additionally, the 1st support at 143.89 is identified as another overlap support, reinforced by the 61.80% Fibonacci Retracement, suggesting a level where buying interest might emerge.
On the resistance side, the 1st resistance at 148.72 is recognized as a pullback resistance, indicating a historical barrier where selling pressure may increase, potentially limiting further upward movement in the price.
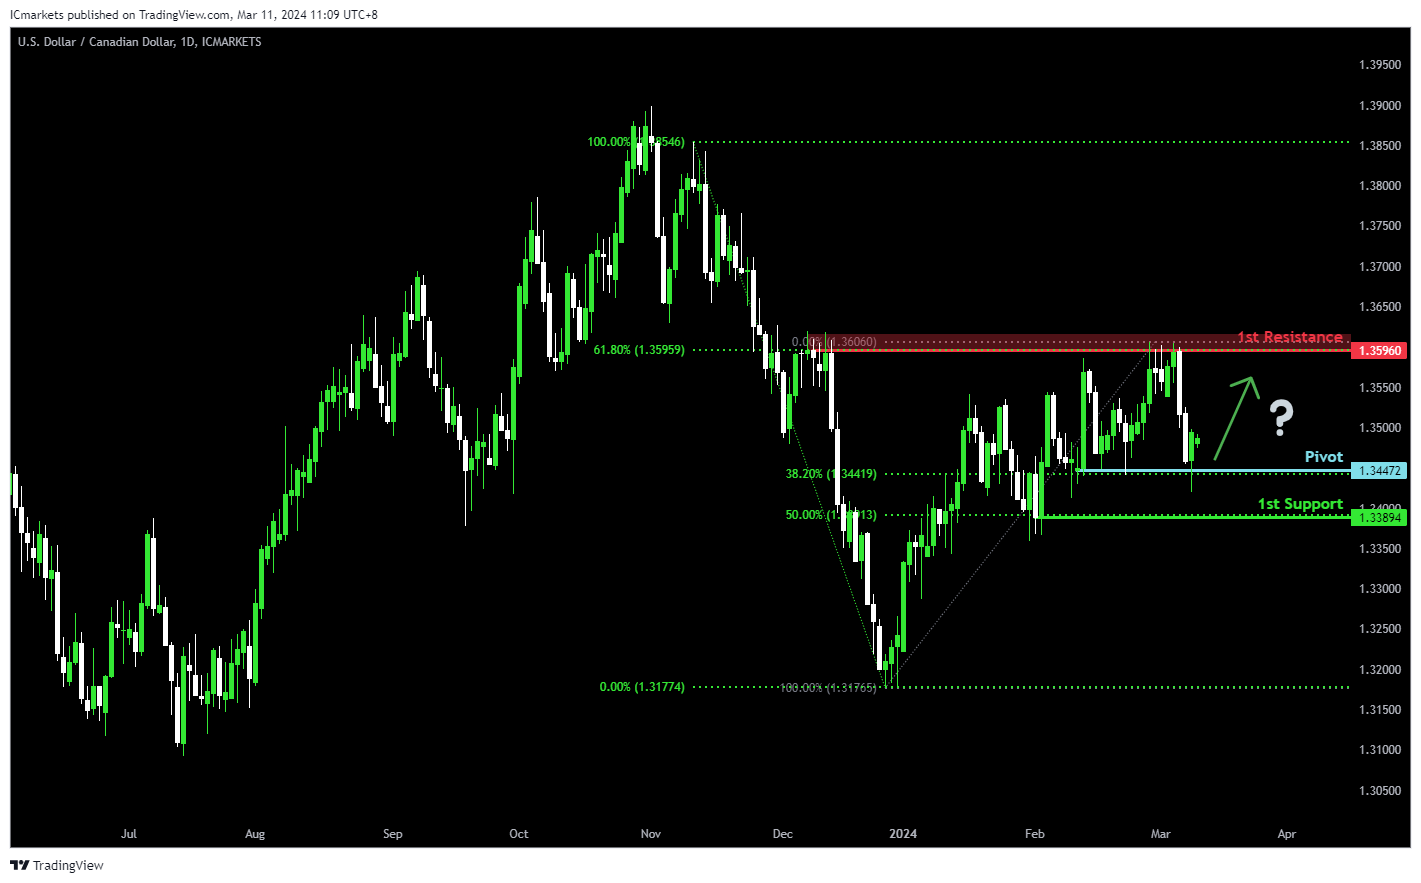
USD/CAD:
The USD/CAD chart currently exhibits an overall bearish momentum. However, there is a potential scenario for price to bounce off the pivot level and rise towards the 1st resistance.
The pivot level at 1.3447 is identified as a pullback support that aligns with the 38.20% Fibonacci Retracement level. Further below, the 1st support level at 1.3389 is also marked as a pullback support that aligns with the 50.00% Fibonacci Retracement level, reinforcing its significance as a key support level.
To the upside, the 1st resistance level at 1.3596 is identified as a pullback resistance that aligns with the 61.80% Fibonacci Retracement level, further highlighting its importance as a potential resistance zone.
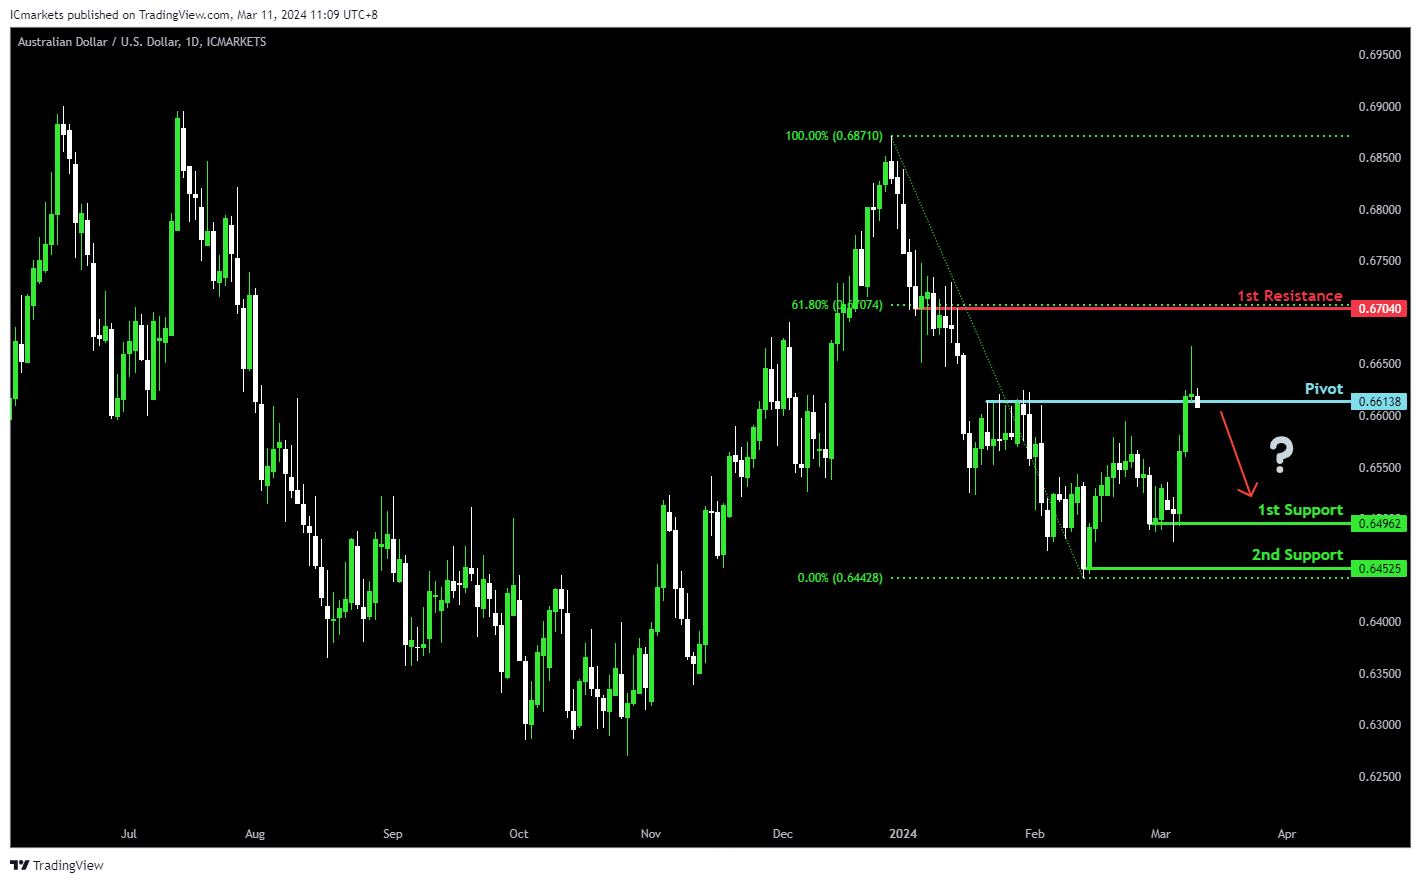
AUD/USD:
The AUD/USD chart currently demonstrates an overall bullish momentum. However, there is a potential scenario for price to reverse around the pivot level and drop towards the 1st support.
The pivot level at 0.6613 is identified as a pullback resistance where price could potentially reverse from to drop lower. The 1st support level at 0.6496 is marked as a pullback support while the 2nd support level at 0.6452 is also noted as a pullback support, reinforcing its significance as a key support level.
On the resistance side, the 1st resistance level at 0.6704 is identified as an overlap resistance that aligns with the 61.80% Fibonacci Retracement level, potentially limiting any further upward movement.
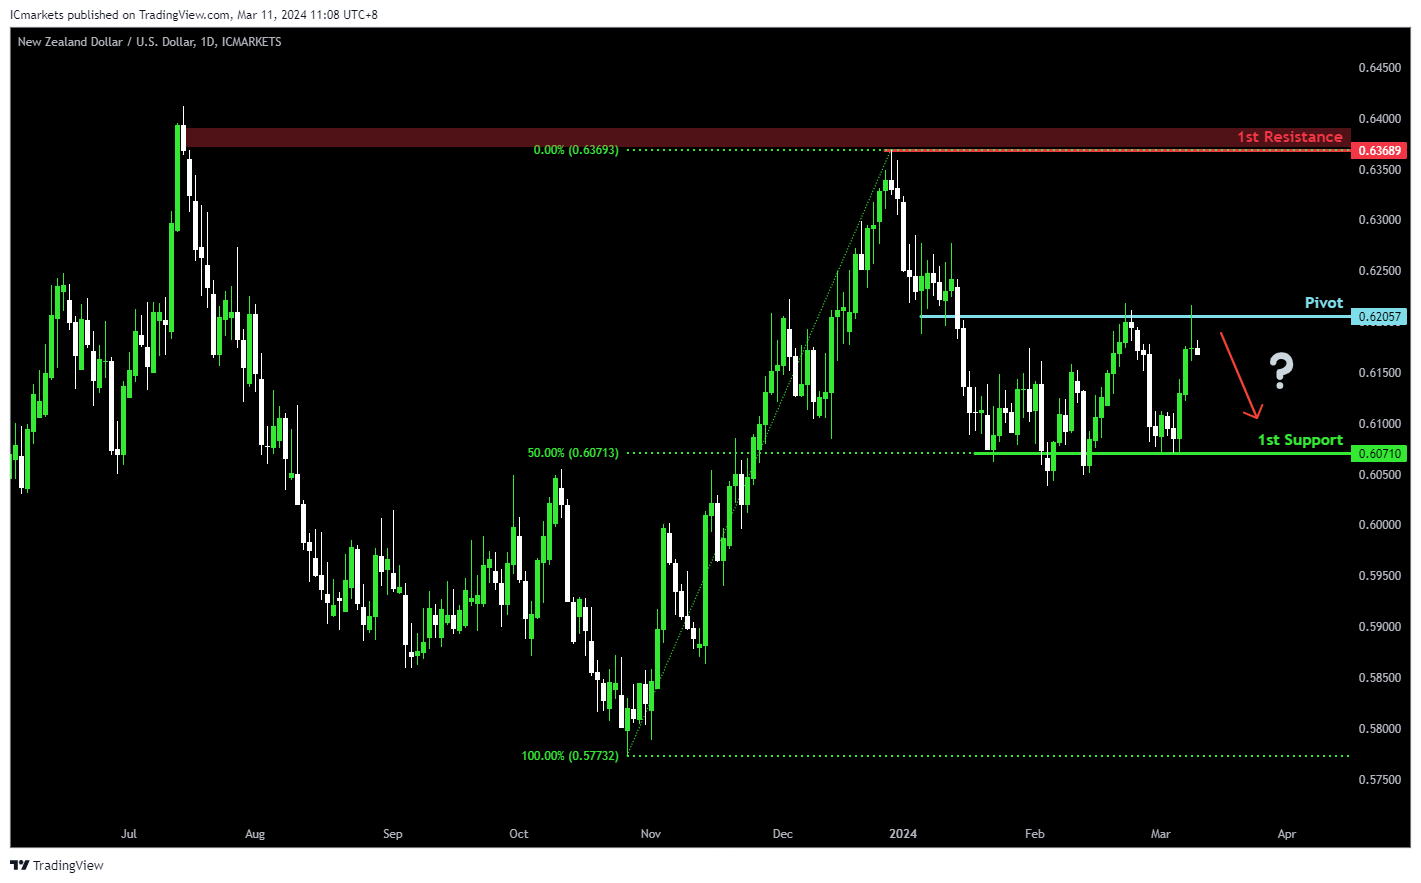
NZD/USD
The NZD/USD chart currently exhibits an overall bullish momentum. However, there is a potential scenario for price to reverse around the pivot level and drop towards the 1st support.
The pivot level at 0.6205 is identified as an overlap resistance where price could potentially reverse from to drop lower. The 1st support level at 0.6071 is marked as a pullback support that aligns with the 50.00% Fibonacci Retracement level, reinforcing its significance as a key support level.
On the resistance side, the 1st resistance level at 0.6368 is identified as a swing-high resistance, potentially limiting any further upward movement.
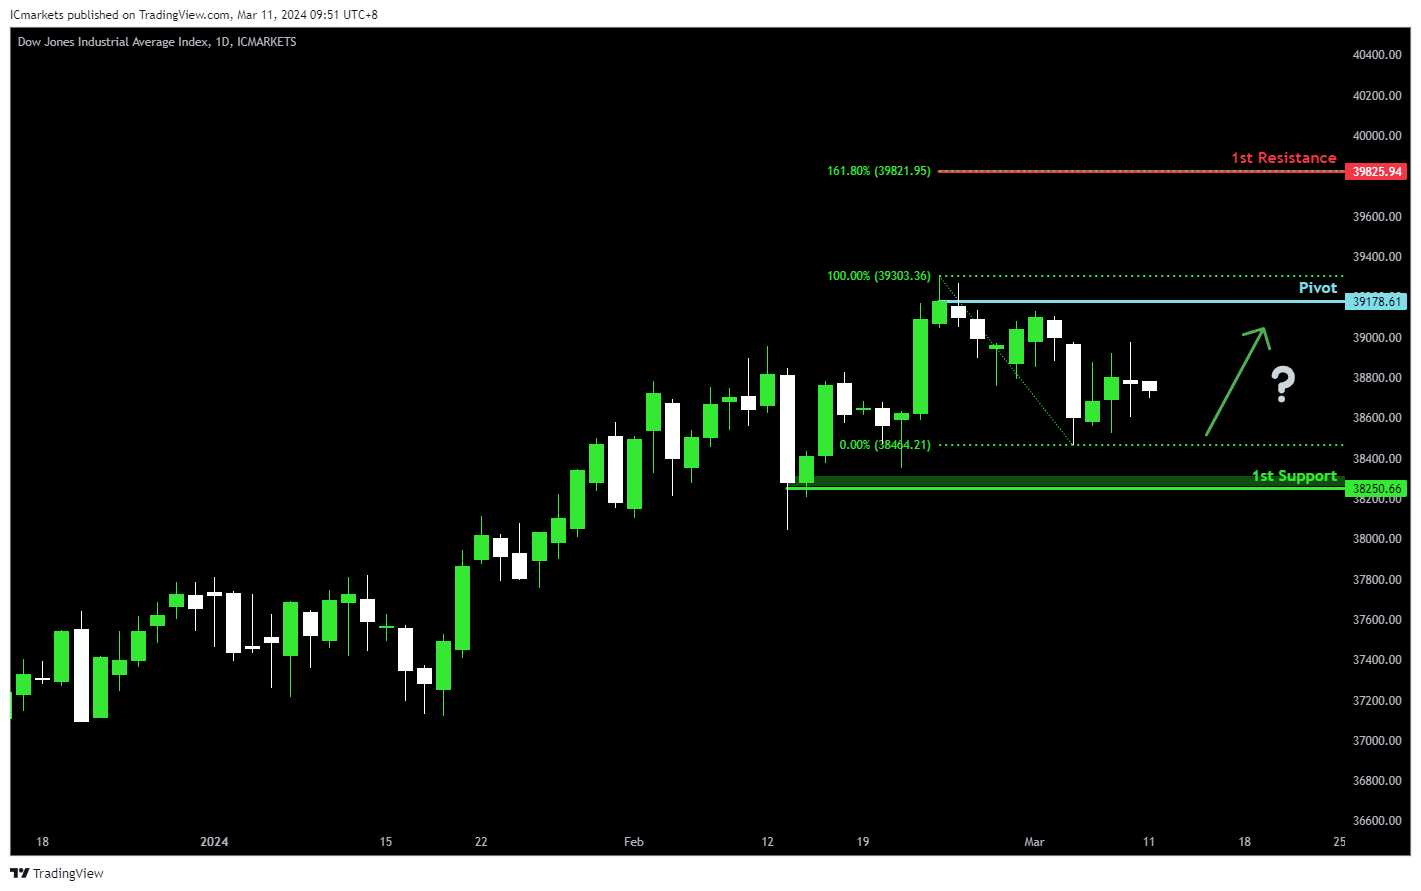
DJ30:
The DJ30 chart currently demonstrates bullish momentum, indicating a potential continuation of the upward trend. There are indications that price could potentially make a bullish continuation towards the 1st resistance level.
The Pivot level at 39178.61 is identified as a swing high resistance, suggesting a significant historical barrier to upward movement. Additionally, the 1st support at 38250.66 corresponds to a swing low support, indicating a potential area where buying interest might emerge.
On the resistance side, the 1st resistance level at 39825.94 aligns with the 161.80% Fibonacci Extension, further reinforcing its significance as a potential barrier to further bullish movement.
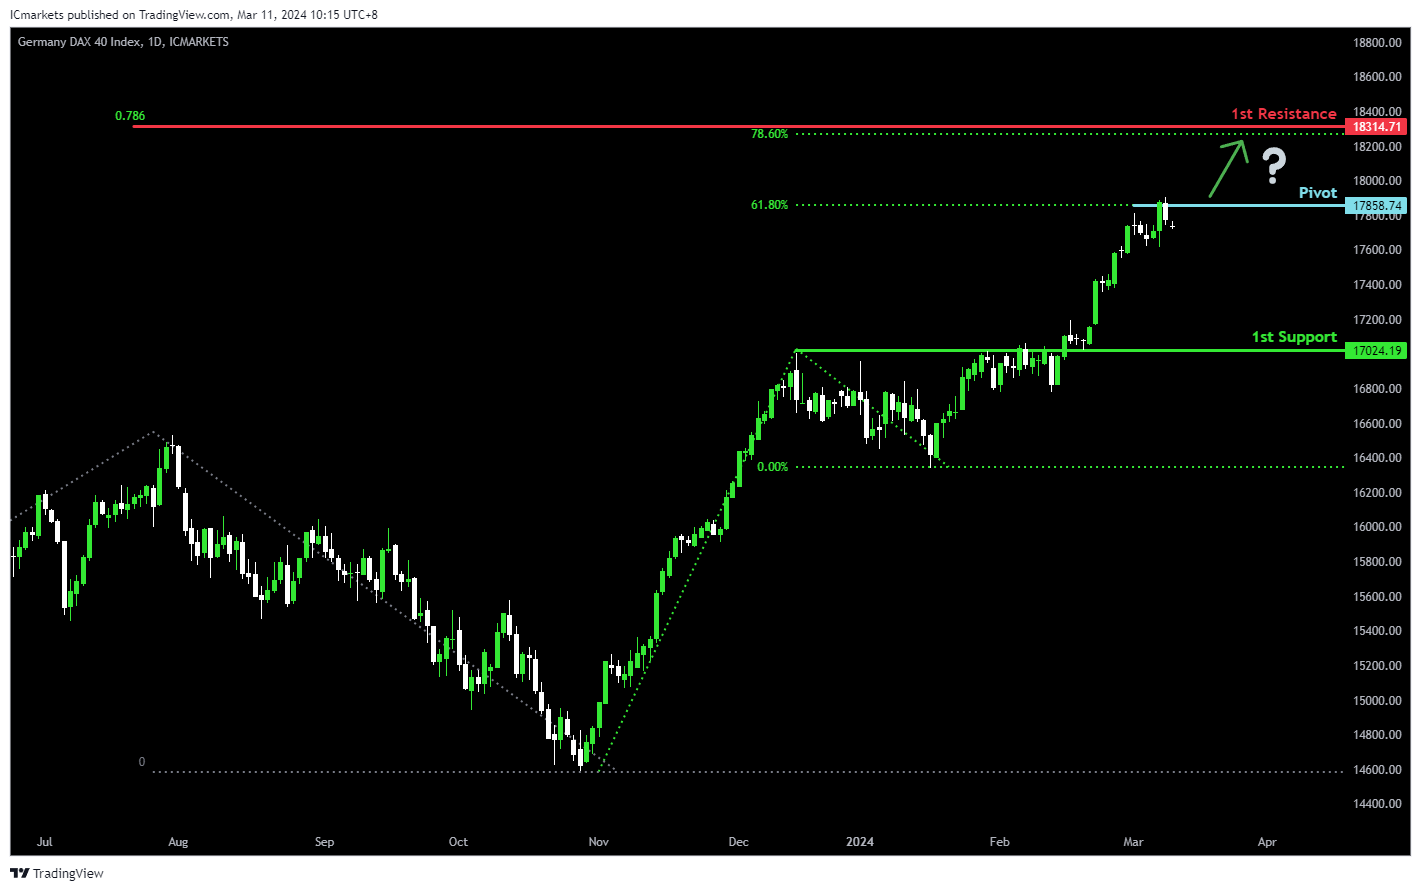
GER40:
The GER40 chart currently demonstrates bullish momentum, indicating a potential continuation of the upward trend. Several factors contribute to this momentum, suggesting a bullish movement towards the 1st resistance level.
The Pivot level at 17858.74 aligns with the 61.80% Fibonacci Retracement, indicating a significant historical level where buying interest could emerge. Additionally, the 1st support at 17024.19 corresponds to a pullback support, reinforcing its significance as a potential area of support.
On the resistance side, the 1st resistance level at 18314.71 is characterized by the confluence of the 78.60% Fibonacci Retracement and the 78.60% Fibonacci Projection, further reinforcing its significance as a potential barrier to further bullish movement.
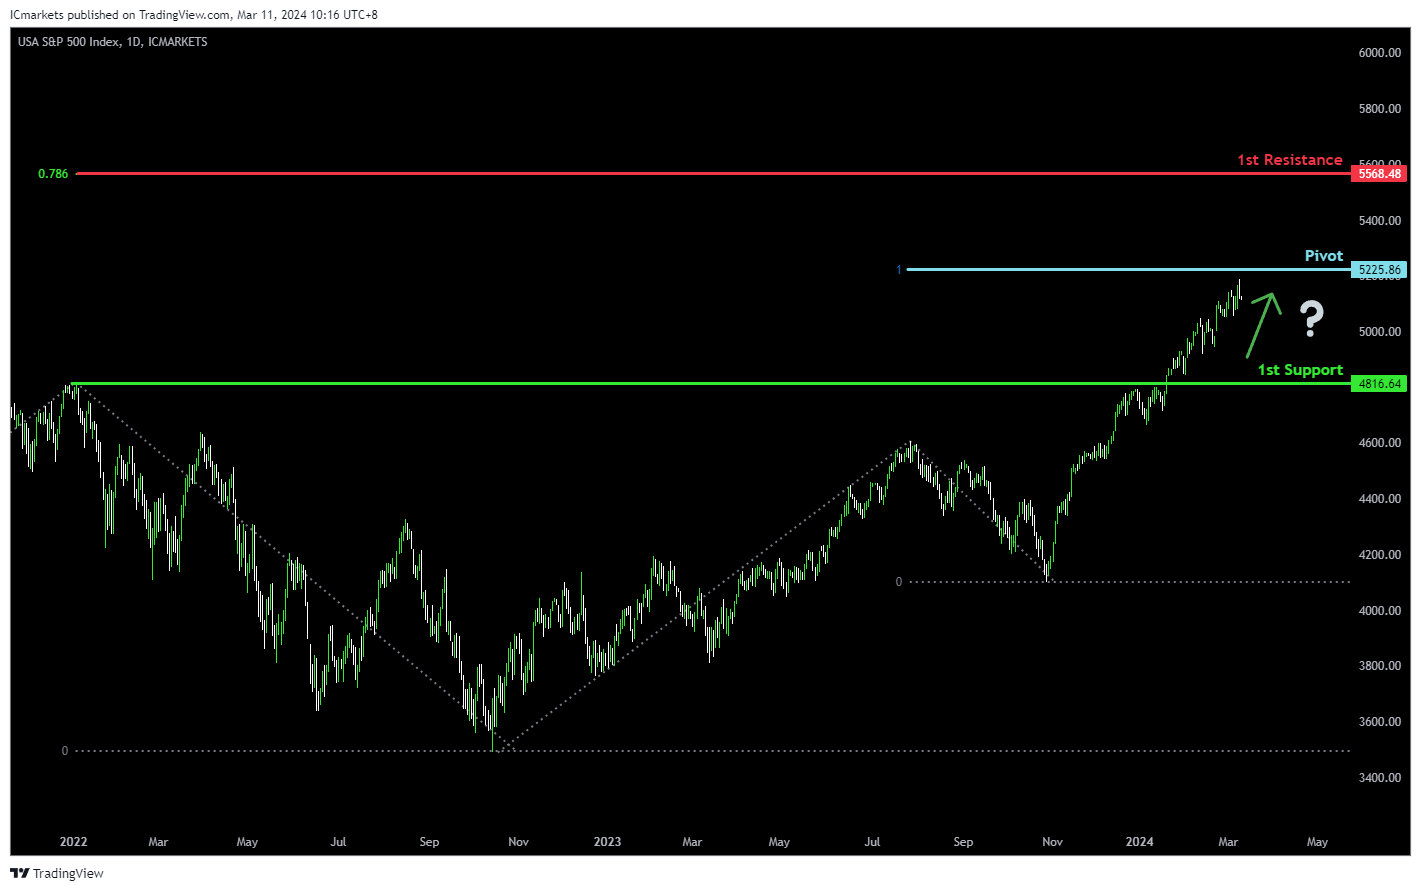
US500:
The US500 chart currently exhibits bullish momentum, indicating a potential continuation of the upward trend. The pivot level at 5225.86 aligns with the 100% Fibonacci Projection, suggesting a significant historical level where buying interest might emerge. Additionally, the 1st support at 4816.64 corresponds to a pullback support, reinforcing its significance as a potential area of demand.
On the resistance side, the 1st resistance level at 5668.48 is characterized by the 78.60% Fibonacci Projection, indicating a historical barrier to upward movement.
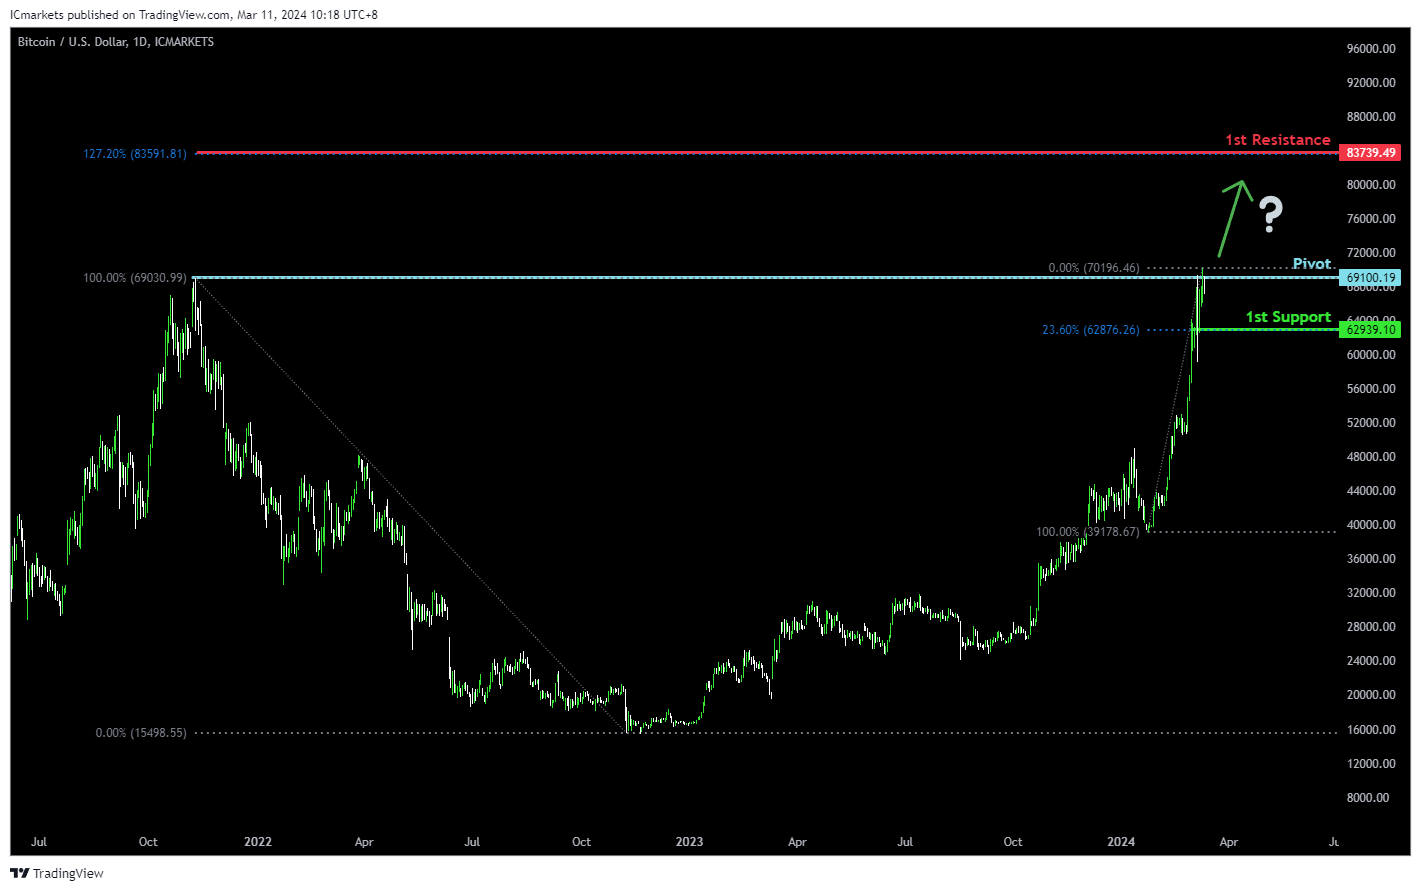
BTC/USD:
The BTC/USD chart currently demonstrates bullish momentum, suggesting a potential continuation of the upward trend. The pivot level at 69100.19 corresponds to a swing high resistance, indicating a significant historical barrier where selling pressure may emerge.
The 1st support level at 62939.10 aligns with an overlap support and coincides with the 23.60% Fibonacci Retracement level, highlighting its significance as a potential area of demand where buyers might enter the market.
On the resistance side, the 1st resistance level at 83739.49 is identified by the 127.20% Fibonacci Extension, suggesting a significant historical barrier to further upward movement.
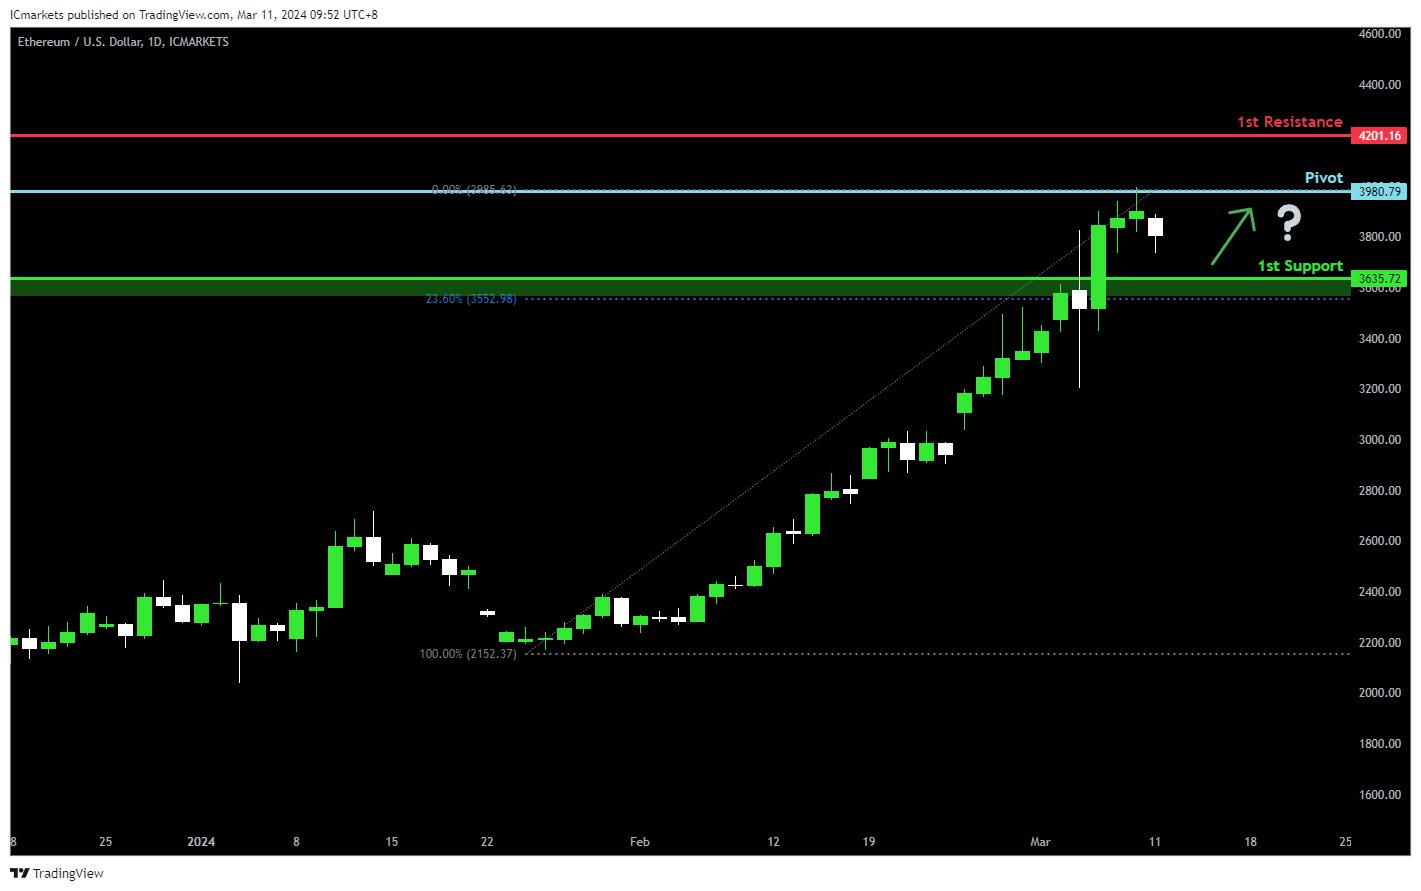
ETH/USD:
The ETH/USD chart currently exhibits bullish momentum, with several factors contributing to the upward movement. The pivot level at 3980.79 acts as an overlap support, indicating a significant historical level where buying interest could emerge.
The 1st support at 3635.72 aligns with a pullback support and coincides with the 23.60% Fibonacci Retracement level, reinforcing its significance as a potential area of demand where buyers might step in.
On the resistance side, the 1st resistance level at 4201.16 serves as a pullback resistance, suggesting a historical barrier to further upward movement.
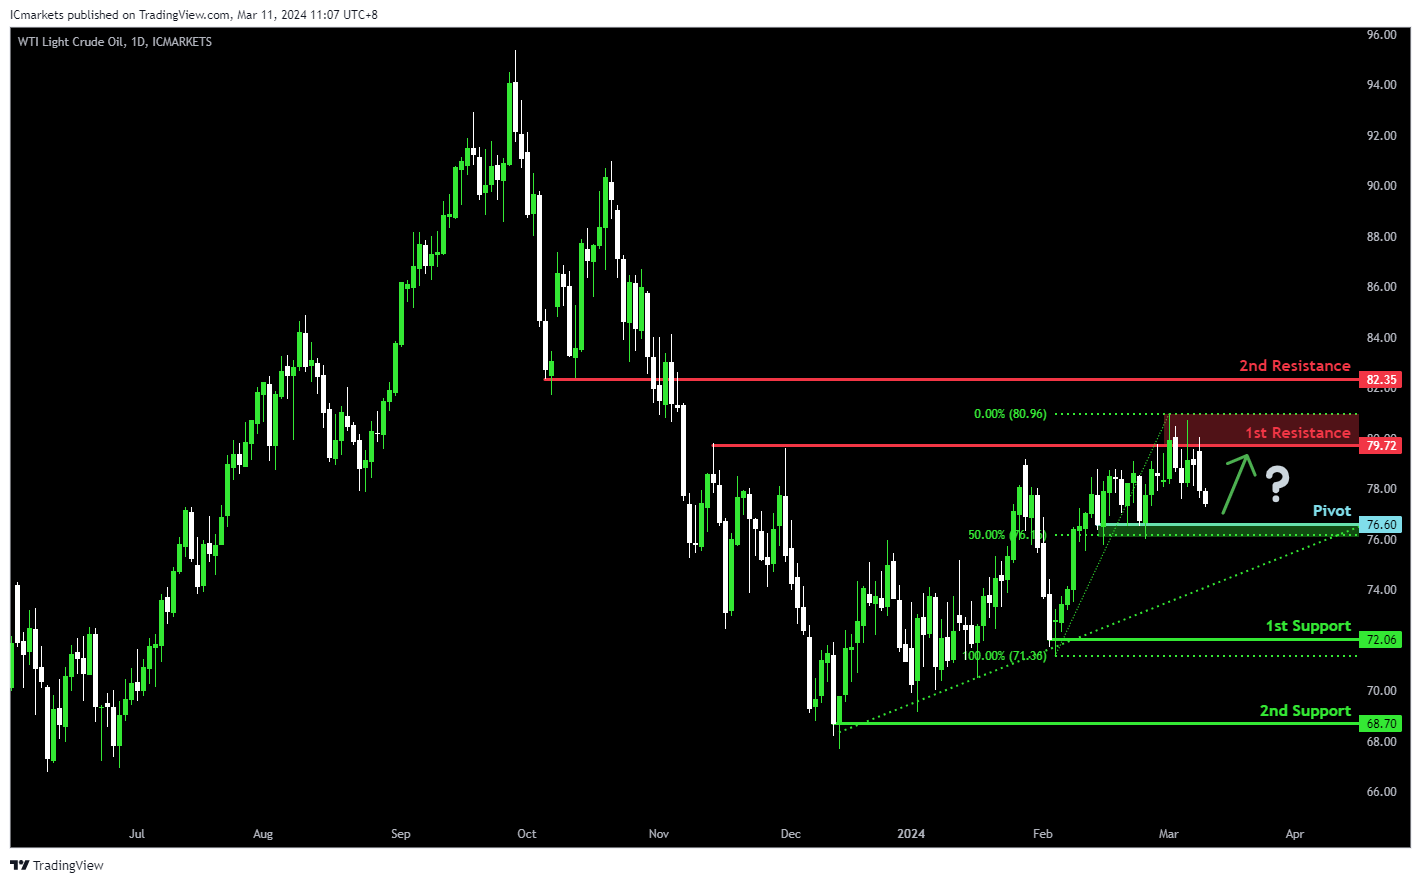
WTI/USD:
The WTI (West Texas Intermediate) chart currently demonstrates an overall bearish momentum. However, there is a potential scenario for price to bounce off the pivot level and rise towards the 1st resistance.
The pivot level at 76.60 is identified as a pullback support that aligns with the 50.00% Fibonacci Retracement level. Further below, the 1st support level at 72.06 is marked as a swing-low support while the 2nd support level at 64.70 is noted as a pullback support, reinforcing its significance as a key support level.
To the upside, the 1st resistance level at 79.72 is identified as a pullback resistance while the 2nd resistance level at 82.35 is noted as an overlap resistance, further reinforcing its significance as a potential barrier to further bullish movement.
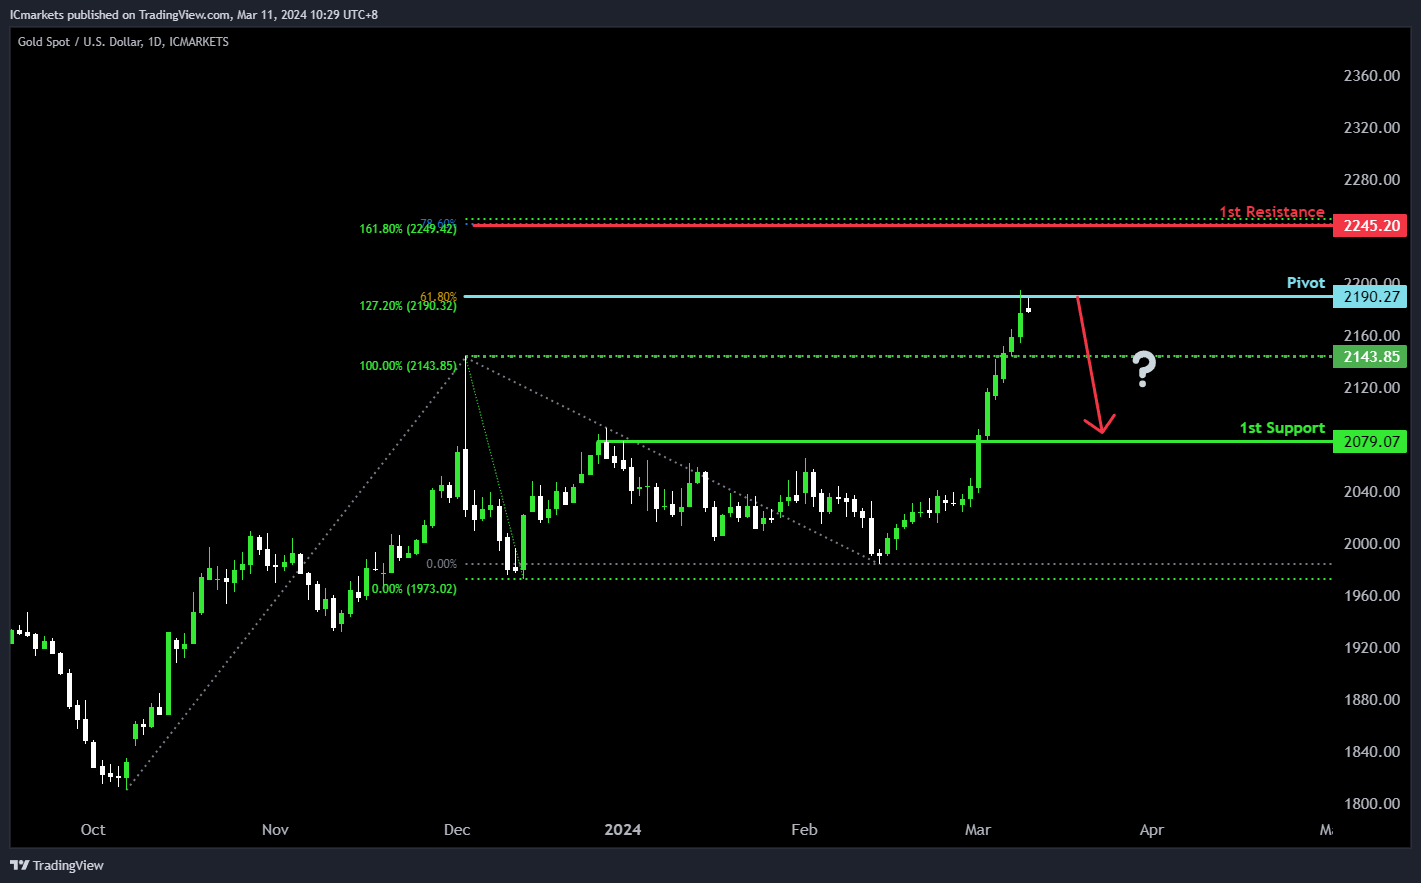
XAU/USD (GOLD):
The XAUUSD chart indicates bearish momentum, potentially leading to a bearish reaction from the pivot towards the 1st support.
The pivot at 2190.27 presents significant swing high resistance, supported by the 127.20% Fibonacci Extension and the 61.80% Fibonacci Projection, suggesting a potential area of resistance where selling pressure could intensify.
The 1st support level at 2079.07 serves as pullback support, offering a potential area where buying interest might emerge, potentially halting the downward movement.
Conversely, the 1st resistance at 2245.20 presents a significant barrier, reinforced by the 161.80% Fibonacci Extension and the 78.60% Fibonacci Projection, indicating a strong resistance zone where selling pressure may increase, potentially limiting further upward movement in the price.
The accuracy, completeness and timeliness of the information contained on this site cannot be guaranteed. IC Markets does not warranty, guarantee or make any representations, or assume any liability regarding financial results based on the use of the information in the site.
News, views, opinions, recommendations and other information obtained from sources outside of www.icmarkets.com, used in this site are believed to be reliable, but we cannot guarantee their accuracy or completeness. All such information is subject to change at any time without notice. IC Markets assumes no responsibility for the content of any linked site.
The fact that such links may exist does not indicate approval or endorsement of any material contained on any linked site. IC Markets is not liable for any harm caused by the transmission, through accessing the services or information on this site, of a computer virus, or other computer code or programming device that might be used to access, delete, damage, disable, disrupt or otherwise impede in any manner, the operation of the site or of any user’s software, hardware, data or property.


