
A note on lower timeframe confirming price action…
Waiting for lower timeframe confirmation is our main tool to confirm strength within higher timeframe zones, and has really been the key to our trading success. It takes a little time to understand the subtle nuances, however, as each trade is never the same, but once you master the rhythm so to speak, you will be saved from countless unnecessary losing trades. The following is a list of what we look for:
- A break/retest of supply or demand dependent on which way you’re trading.
- A trendline break/retest.
- Buying/selling tails/wicks – essentially we look for a cluster of very obvious spikes off of lower timeframe support and resistance levels within the higher timeframe zone.
- Candlestick patterns. We tend to only stick with pin bars and engulfing bars as these have proven to be the most effective.
We search for lower timeframe confirmation between the M15 the H1 timeframes, since most of our higher-timeframe areas begin with the H4. Stops are usually placed 5-10 pips beyond confirming structures.
EUR/USD:
Weekly gain/loss: – 88 pips
Weekly closing price: 1.1047
Weekly opening price: 1.1045
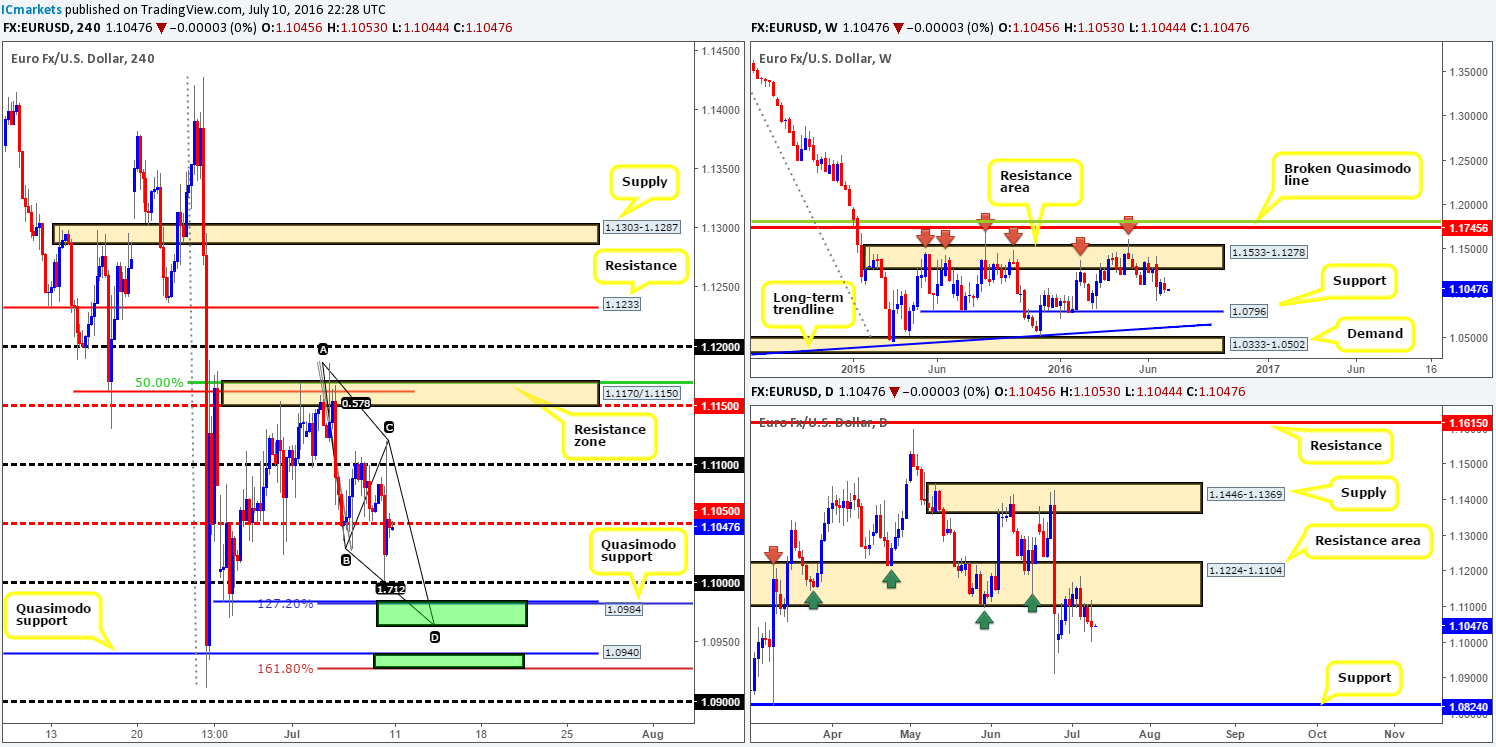
Weekly view: From the top, we can see that weekly movement continues to trade mid-range between a long-term weekly resistance area coming in at 1.1533-1.1278, and a long-term weekly support line seen at 1.0796. Both areas have stood the test of time, and with that either one could play a significant role during trading this week.
Daily view: The daily resistance area at 1.1224-1.1104 did a pretty good job in holding this market lower last week. Since January 2015, this zone has provided the pair strong support and resistance on numerous occasions. Apart from the referendum low 1.0911, there’s little support seen stopping price from reaching the daily support chalked in at 1.0824 this week.
H4 view: A quick recap of Friday’s trade on the H4 shows that price turned bearish, following a hotter than expected US jobs report. However, the sell-off was a short-lived one with price rotating from just ahead of the 1.10 handle to highs of 1.1120, before ending the week consolidating around the H4 mid-way point 1.1050.
In view of the higher timeframe structures, our team feels that the shared currency will eventually dive lower sometime this week. Prior to this, however, there are two strong-looking barriers of support on the H4 where price is likely to bounce from:
- The minor H4 Quasimodo support line seen at 1.0984. This line also coincides with a 127.2% extension from the high 1.1186, and sits just above a H4 AB=CD completion point at 1.0964. Collectively, this zone is high-probability area for a bounce to be seen.
- The larger H4 Quasimodo support at 1.0940. Not only did the H4 candles bounce from this line during the ‘Brexit’ fallout (indicating strong support), it also fuses with a 161.8% extension (1.0926) from the high 1.1186. If we’re not mistaken, between the 127.2% and 161.8% extensions is in fact the reversal zone for the above said H4 AB=CD pattern. Be that as it may, at least in this case, we prefer to look at the areas individually.
Our suggestions: Watch both of the aforementioned H4 support barriers this week for potential long positions. We are confident a bounce will be seen from these areas, but would still advise traders to trade cautiously since fakeouts here are still a possibility!
Levels to watch/live orders:
- Buys: 1.0964/1.0984 [Tentative – confirmation required] (Stop loss: dependent on where one confirms this area). 1.0926/1.0940 [Tentative – confirmation required] (Stop loss: dependent on where one confirms this area).
- Sells: Flat (Stop loss: N/A).
GBP/USD:
Weekly gain/loss: – 307 pips
Weekly closing price: 1.2938
Weekly opening price: 1.2942
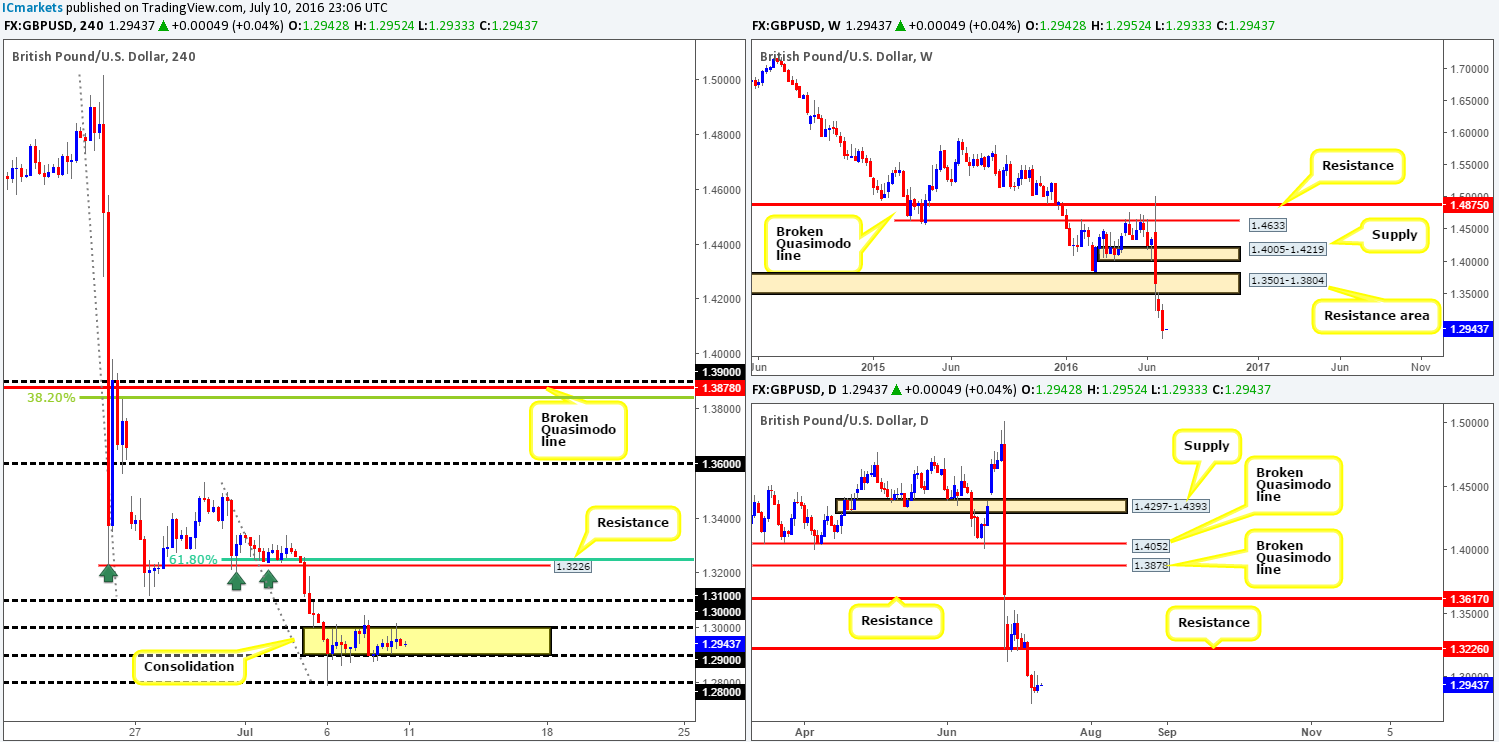
Weekly view: Last week’s action shows that the GBP extended its bounce from the weekly resistance area given at 1.3501-1.3804 to lows of 1.2789 by the close. With little structure seen to the left of current price, we’ve had to look back to 1986 where there’s some heavy demand seen around the 1.20 mark. However, there’s a lot of ground to cover before this barrier is brought into view. For now, at least from a technical standpoint, this pair, in our opinion has the potential to continue much lower!
Daily view: There is not much difference seen between the weekly and daily charts on this pair other than there is a daily resistance drawn in at 1.3226, where price could effectively retest sometime this week.
H4 view: Although Friday’s job’s report did move the market, it made little difference to H4 structure. Since Wednesday last week, the buyers and sellers have been seen battling for position between the key figure 1.30 and the 1.29 support handle. Given the relatively stable open that we’ve seen this morning, and taking into consideration what our team has noted above, 1.29 is likely cave in before 1.30.
Our suggestions: Watch for price to close below 1.29 and look to trade any retest seen at this line, targeting 1.28 as a first take-profit target. On top of this, we would strongly recommend waiting for a lower timeframe sell signal following the retest (see the top of this report for confirmation techniques), since the UK’s political situation is far from stable!
Levels to watch/live orders:
- Buys: Flat (Stop loss: N/A).
- Sells: Watch for price to consume the 1.29 handle and look to trade any retest seen thereafter (lower timeframe confirmation required).
AUD/USD:
Weekly gain/loss: + 66 pips
Weekly closing price: 0.7562
Weekly opening price: 0.7561
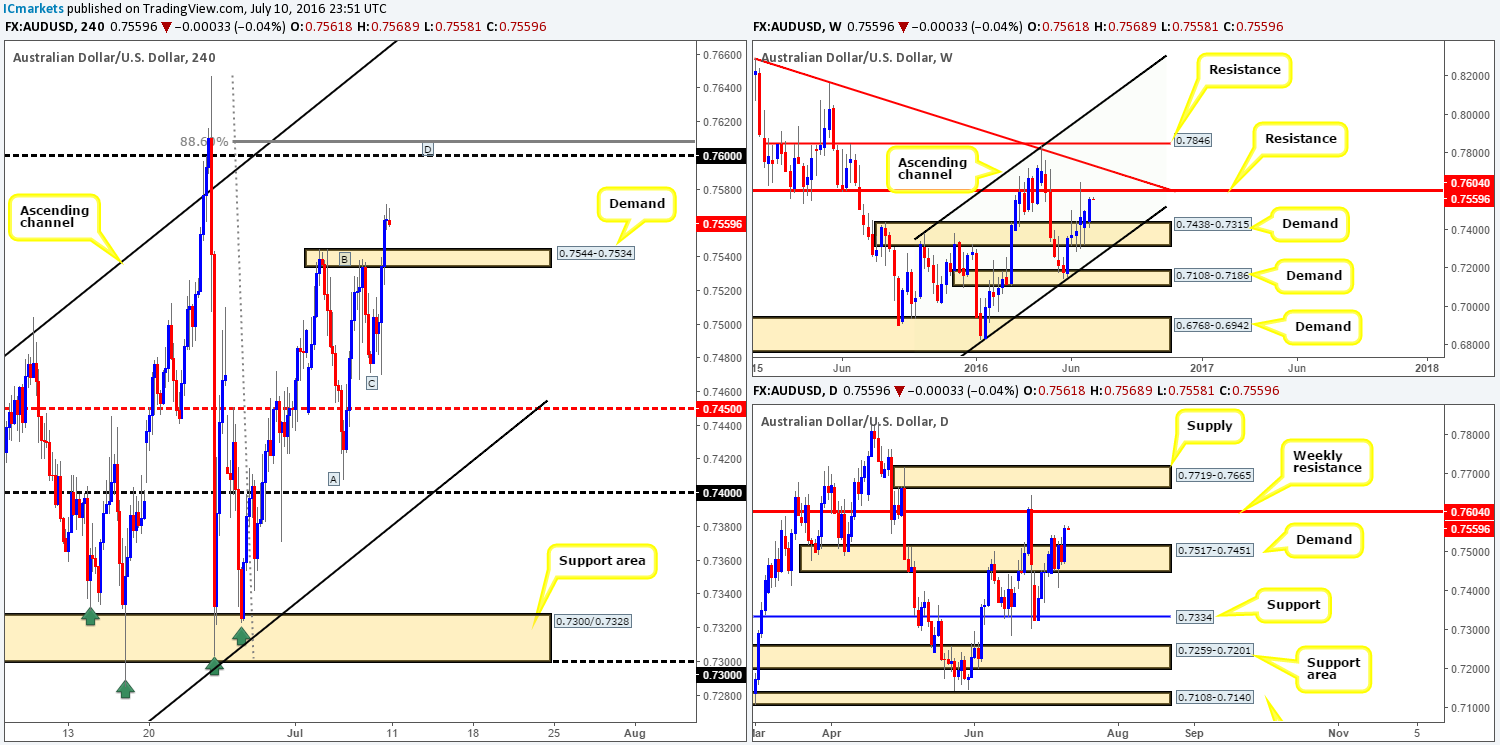
Weekly view: A succession of bids flowed into the market last week, extending the prior week’s bounce from deep within weekly demand coming in at 0.7438-0.7315. Thanks to this recent surge in buying, the commodity-linked currency is now seen trading within touching distance of a weekly resistance line drawn from 0.7604. We believe a reaction from this vicinity is likely this week, so do make a note of this level in your watch lists!
Daily view: In conjunction with weekly price, the daily candles also show that the next objective to reach is the aforementioned weekly resistance line. However, just like we saw going into the ‘Brexit’ sell-off, price could potentially fake through this weekly level before driving lower. The daily supply at 0.7719-0.7665, although positioned over sixty pips above the weekly line, may be tagged if price does indeed whipsaw again.
H4 view: Looking at Friday’s action on the H4 shows that price sold-off sharply to lows of 0.7470 on the back of stronger than expected US jobs data. For all that though, the Aussie quickly reversed from here and marched higher, forcing price to close the week above H4 supply at 0.7544-0.7534 (now acting demand).
With little change seen at this morning’s open, here is what our team has logged going forward:
- Weekly resistance at 0.7604 is the next level likely on the hit list.
- The weekly resistance level at 0.7604 (the next upside target on the bigger picture) also coincides beautifully with the 0.76 handle and a deep H4 88.6% Fib level at 0.7608.
- The H4 candles appears to also be in the process of forming a nice-looking H4 AB=CD bearish pattern, which tops out around the 0.76 region (see H4 chart).
Our suggestions: Given the confluence seen around the 0.76 handle, our team has placed a pending sell order at 0.7599, with a stop above the high 0.7647 at 0.7649. Regarding our first take-profit target, this is a little difficult to judge since the approach has yet to be completed. Usually though we look to aim for the next logical area of demand on the H4 timeframe.
Levels to watch/live orders:
- Buys: Flat (Stop loss: N/A).
- Sells: 0.7599 [Pending order] (Stop loss: 0.7649).
USD/JPY:
Weekly gain/loss: – 190 pips
Weekly closing price: 100.56
Weekly opening price: 100.59
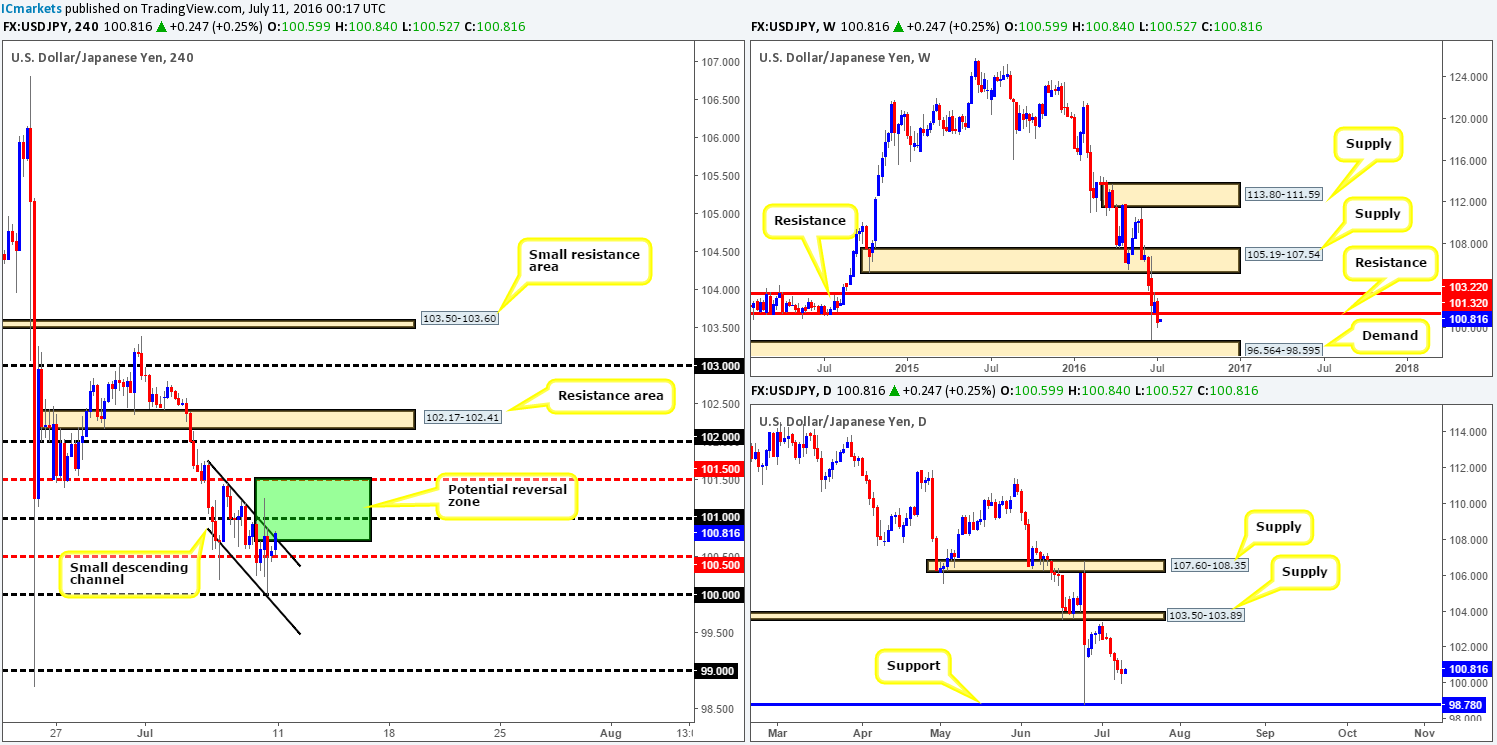
Weekly view: The recently closed weekly candle, as can be seen from the chart, ended the week closing below weekly support at 101.32 (now acting resistance). Apart from watching to see if price retests this line as resistance this week, the next notable area to keep an eye on is the weekly demand base drawn from 96.564-98.595.
Daily view: As things stand on the daily chart, however, there’s very little support, as far as we can see, until the 98.780 region (‘Brexit’ referendum low), which is conveniently positioned just a few pips above the aforementioned weekly demand barrier.
H4 view: Much like the GBP/USD, although the US jobs report came in better than expected it made little difference to the structure seen on the USD/JPY H4 chart. Shortly after the market opened this morning, the bulls dug in deep and pushed this unit to the upper edge of a minor H4 descending channel resistance extended from the high 101.76.
Given weekly structure (see above), the pair has a potential reversal zone of around seventy pips at the time of writing (see green box), before trading lower. The ideal sell zone from here is seen be between the 101 handle and the H4 mid-way point 101.50, so do keep an eyeball on this area for possible shorts today.
In addition to the above, we also like the space seen below the key figure 100, down to the 0.99 handle. A close below 100 followed by a retest and a lower timeframe sell signal would, in our opinion, be a beautiful short trade which could run all the way down to the 0.99 handle (sits just above the daily support line at 98.78).
Our suggestions: Keep an eye on the 105.50/101 area for short trades. Also watch for price to close below the 100 line. The only thing we’ve not talked about yet is how to go about entering. Between 101.50/101, given that this zone is bolstered by a weekly resistance level (see above), could be stable enough for a market order. However, we prefer to wait for lower timeframe confirmation to form, since a fakeout above 101.50 is likely. Likewise, should price trade below 100 and retest this number as resistance, waiting for a lower timeframe sell signal is the safer route to take to avoid the dreaded fakeout. For those who struggle to find entries, please see the top of this report.
Levels to watch/live orders:
- Buys: Flat (Stop loss: N/A).
- Sells: 101.50/101.00 region [Tentative – confirmation required] (Stop loss: dependent on where one confirms this area). Watch for price to consume the 100 handle and look to trade any retest seen thereafter (lower timeframe confirmation required).
USD/CAD:
Weekly gain/loss: + 129 pips
Weekly closing price: 1.3036
Weekly opening price: 1.3041
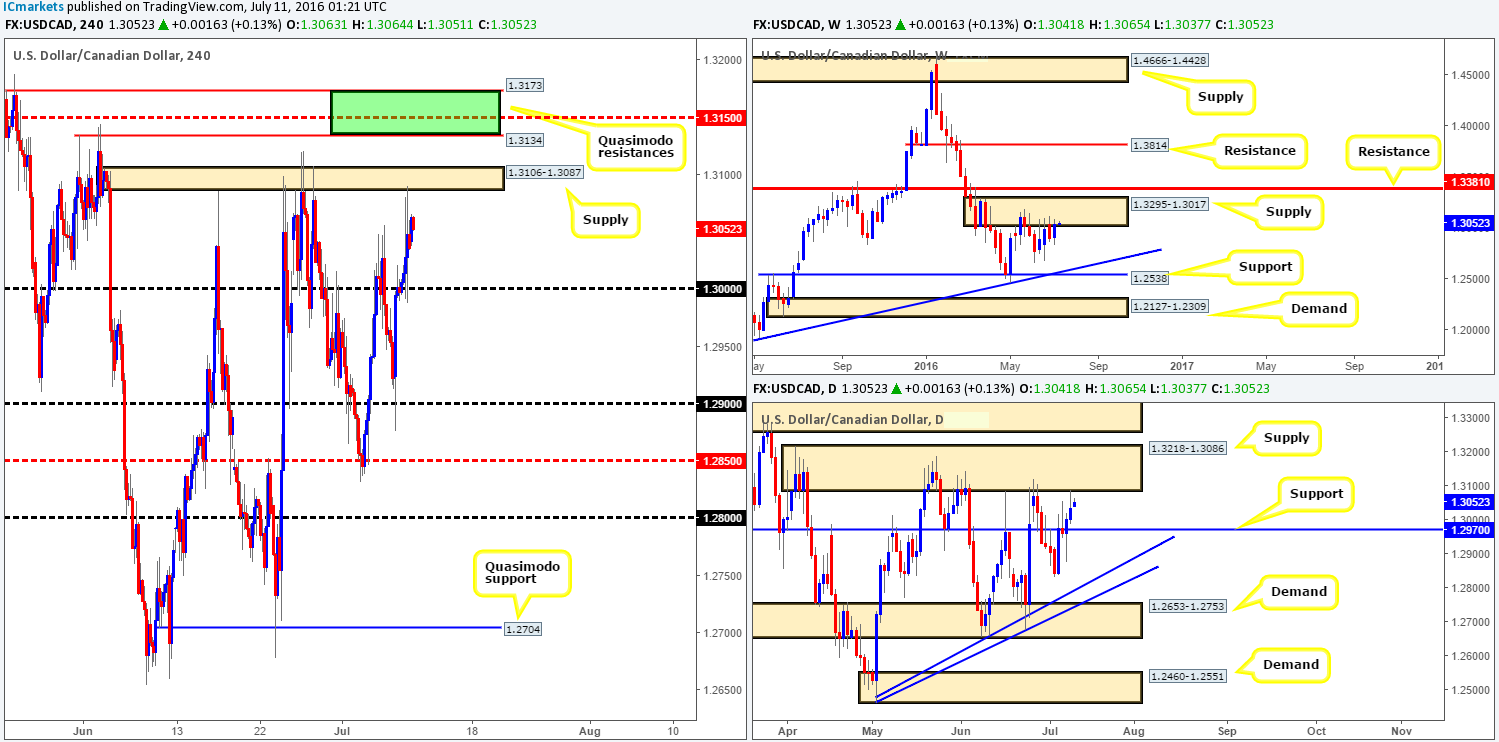
Weekly view: For the past four weeks, the USD/CAD pair has been seen clinging to the underside of a weekly supply base drawn from 1.3295-1.3017. Although this is a relatively newly-formed area, it has managed to cap upside in this market since the 16th May. Assuming that the bears do eventually stamp their authority on this zone, the next downside target can be seen at a weekly trendline support extended from the high 1.1278.
Daily view: Besides weekly offers holding firm around supply, we can also see that the buyers and sellers on the daily chart are currently battling for position just ahead of daily supply coming in at 1.3218-1.3086 (lodged within the current weekly supply area). Should the market rotate from this zone, the next area likely on the hit list is daily support drawn from 1.2970.
H4 view: Reviewing Friday’s movement on the H4 chart saw price initially whipsaw to highs of 1.3080, and then quickly reverse and whipsaw through the key figure 1.30 to lows of 1.2988, following the release of US and Canadian jobs data. Shortly after this, price went on to test H4 supply at 1.3106-1.3087 and ended the week closing below the H4 mid-way point 1.3050.
Given that the current H4 supply base has been attacked on several occasions now, we feel, despite Friday’s reversal from here, that this area is weak. Granted, this zone could continue to hold this week given that it is bolstered by the above said higher timeframe supplies. However, we still expect this H4 zone to eventually break and for price to rally higher to connect with clean offers seen between 1.3173/1.3134 (green zone). This zone is comprised of two H4 Quasimodo resistances (both positioned within the aforementioned higher timeframe area), and also houses a H4 mid-way resistance line drawn from 1.3150.
Our suggestions: We currently have a pending order set on the Aussie dollar to short, so placing pending orders in this market, also a commodity-linked instrument, may not be the best path to take! Since both markets look incredibly attractive, however, we’ll be keeping a close eye on both and watch to see which pair hits first and consider our options from there.
Levels to watch/live orders:
- Buys: Flat (Stop loss: N/A).
- Sells: 1.3133 [Potential place for a pending order] (Stop loss: 1.3190).
USD/CHF:
Weekly gain/loss: + 91 pips
Weekly closing price: 0.9817
Weekly opening price: 0.9813
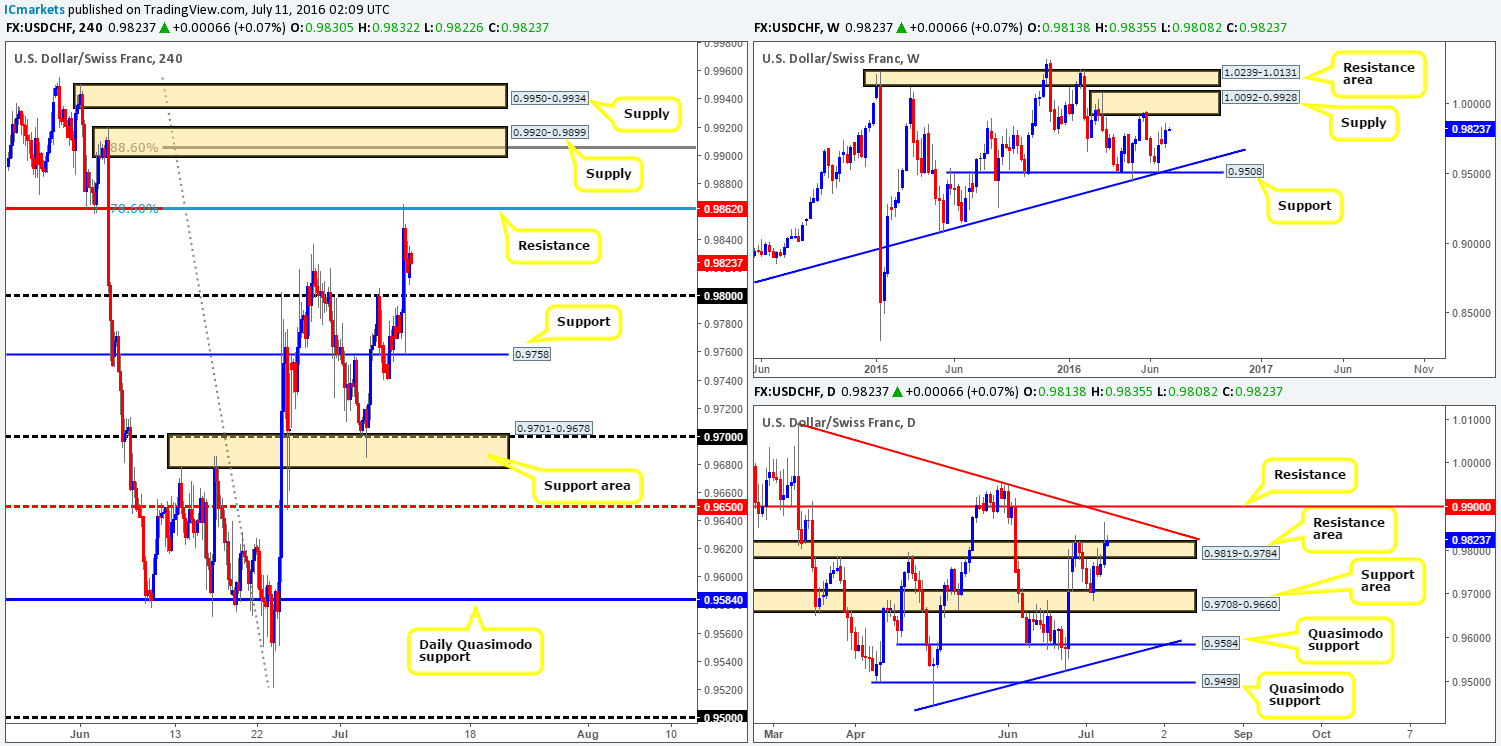
Weekly view: During the course of last week’s trading, renewed buying pressure came into the market, consequently printing a decent-sized weekly bullish engulfing candle. As far as structure is concerned, we see an overhead weekly supply drawn from 1.0092-0.9928 while below there’s a weekly support seen at 0.9508 (coincides with a weekly trendline support taken from the low 0.8703). Both areas have proved reliable in the past so the two will remain firmly on our radar this week.
Daily view: A bullish rotation was seen on Tuesday last week from within the confines of a daily support area coming in at 0.9708-0.9660. This, as you can see, forced price to tag in offers around a daily resistance area at 0.9819-0.9784 on Wednesday, which managed to hold firm until mid-way through Friday’s session, where the market aggressively spiked above the zone. Assuming that stops have been taken here, the path north may be clear up to the daily trendline resistance taken from the high 1.0092, followed closely by daily resistance at 0.9900.
H4 view: Following a stronger than expected US jobs report on Friday, the initial reaction saw the Swissy surge higher and tag in H4 resistance at 0.9862 (coincides with a H4 78.6% Fib resistance). From this hurdle, price just as aggressively tumbled lower, whipsawing through the 0.98 handle and striking lows of 0.9759, before ending the day closing just ahead of the 0.98 hurdle.
In view of the higher timeframe picture, we feel higher prices might be on the cards today/this week. However, since daily price has yet to clear the current daily resistance area, buying is tricky. As for selling, we have our eye on the following zones:
- The H4 resistance line at 0.9862. This level has no higher timeframe confluence but what it does have is a deep H4 78.6 Fib resistance bolstering the zone. In addition to this, the line has provided adequate support and resistance in the past on multiple occasions, hence deserving a place on this list.
- The two H4 supply areas marked at 0.9950-0.9934/ 0.9920-0.9899 are interesting. The upper zone is located within the aforementioned weekly supply area, whilst the lower H4 area sits just beneath it. Nevertheless, the lower zone fuses with a deep H4 88.6% Fib resistance level at 0.9906 and also a psychological number at 0.99.
Our suggestions: Watch for a bounce from the nearby H4 resistance line at 0.9862. Waiting for lower timeframe confirmation here is a MUST since price has the potential to fake through this zone (see the top of this report for lower timeframe entry techniques), or completely ignore it according to the higher timeframes (see above). The lower H4 supply area at 0.9920-0.9899 is attractive due to its converging structure, but we feel the best area to look for shorts, other than the H4 resistance just mentioned above, is the H4 supply seen just above at 0.9950-0.9934. One can only imagine how many traders are looking to short the lower H4 supply given its confluence. As such, there are likely to be a truckload of stops above, and where those stops are placed is where we’ll be looking to short – just below the most extreme H4 supply!
Levels to watch/live orders:
- Buys: Flat (Stop loss: N/A).
- Sells: 0.9862 region [Tentative – confirmation required] (Stop loss: dependent on where one confirms this area). 0.9950-0.9934 [Dependent on the time of day, a market order from this zone is possible] (Stop loss: 0.9957).
DOW 30:
Weekly gain/loss: + 155 points
Weekly closing price: 18121
Weekly opening price: 18121
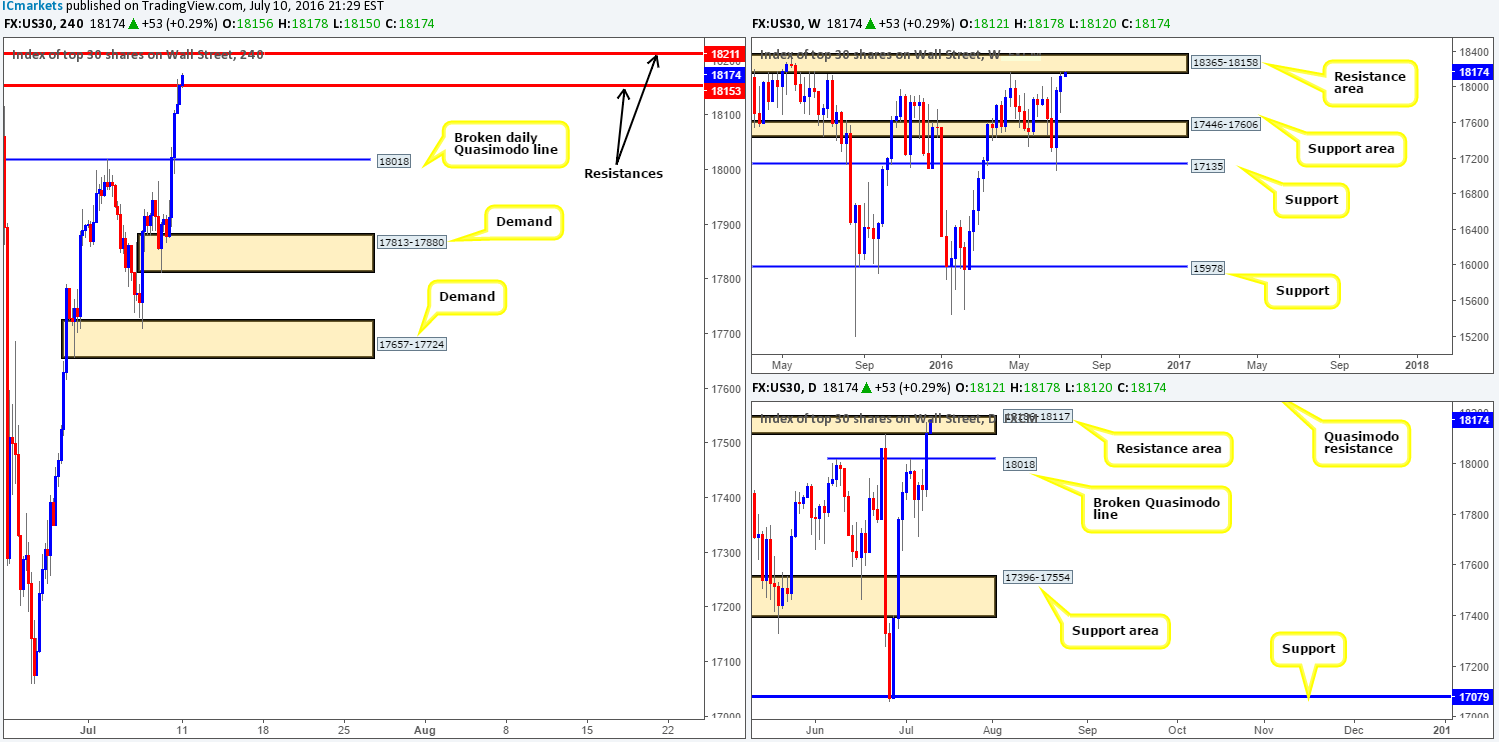
Weekly view: US stocks enjoyed another relatively successful week, increasing its value by a further 155 points into the close. What this also did, as you can probably see from the weekly chart, is force the index to attack a weekly resistance area drawn from 18365-18158, which has held prices lower since February 2015!
Daily view: From this viewpoint, the daily resistance area at 18186-18117 (glued to the underside of the aforementioned weekly resistance area) is currently under pressure. In the event that this barrier fails to hold, the next upside target on this timeframe can be seen at 18279 – a daily Quasimodo resistance (lodged within the above said weekly resistance area).
H4 view: Bolstered by a strong US jobs report on Friday, the DOW marched higher, taking out the H4 Quasimodo resistance line at 18018 (now acting support) and tagging in the H4 resistance level at 18153 into the close. Although we had a steady open this morning, the market still remains relatively well-bid. The current H4 resistance at 18153 is now under pressure, and price looks to be heading in the direction of the H4 resistance seen at 18211.
Our suggestions: Despite the bullish tone this market has taken on over the past two weeks, price is considered overbought in our book. Therefore, quite simply, our team is looking to short from the H4 resistance at 18211 today. In that price could effectively fake above our sell line, bringing price deeper into the aforementioned weekly resistance area, one has two choices. Either enter at market from this level and place your stop above the current weekly resistance area, or wait for lower timeframe confirmation around the H4 level and place you stops five to ten pips above your confirming structure. For anyone new to the markets, please take the time to look at the top of this report as we have laid out which methods we look for when confirming higher timeframe zones from the lower timeframes.
Levels to watch/live orders:
- Buys: Flat (Stop loss: N/A).
- Sells: 18211 region [Tentative – confirmation required] (Stop loss: dependent on where one confirms this area).
Gold:
Weekly gain/loss: + $25.2
Weekly closing price: 1366.1
Weekly opening price: 1366.1
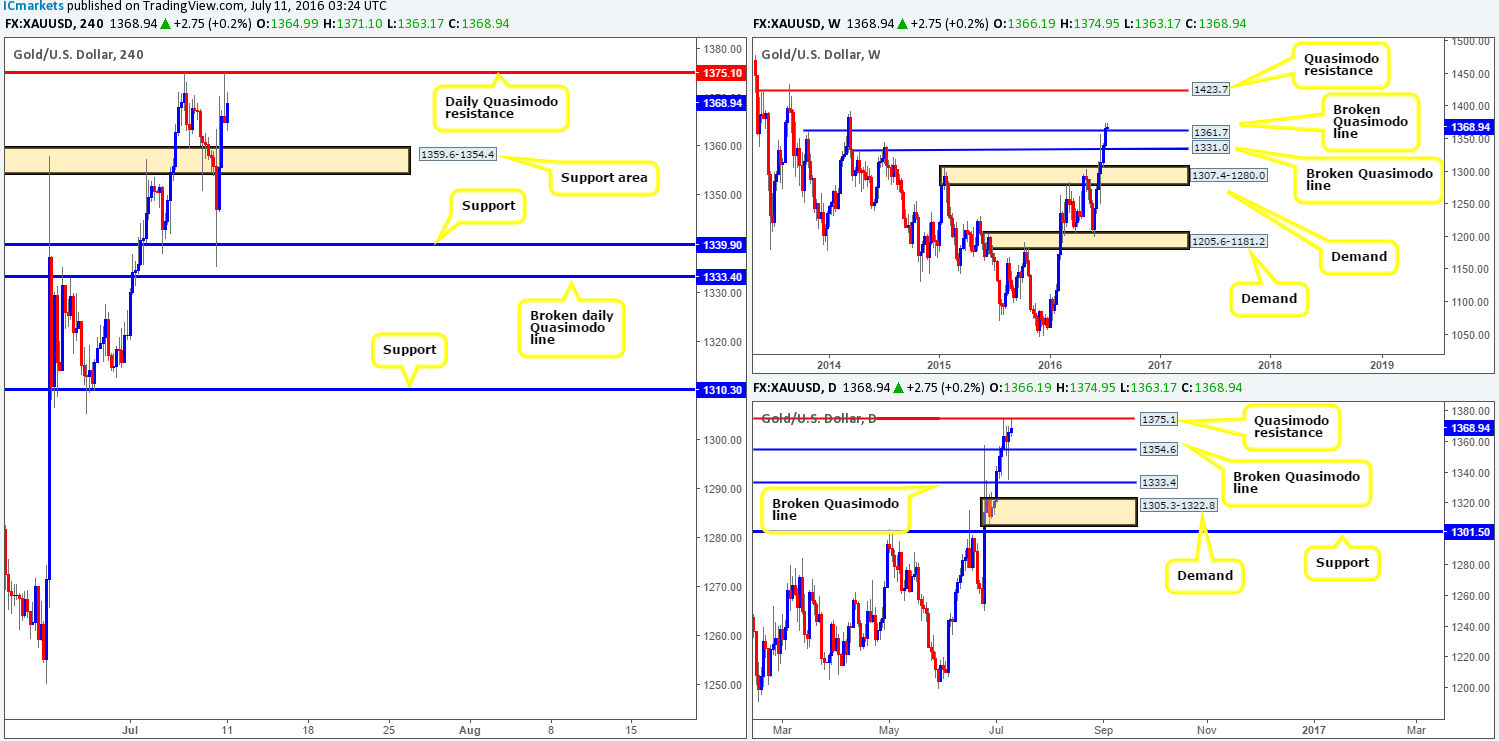
Weekly view: Since the yellow metal struck the top-side of the weekly demand base at 1205.6-1181.2 six weeks ago, gold has been on fire! Two weeks back, the weekly Quasimodo resistance line at 1331.0 was wiped out, and last week we saw yet another weekly Quasimodo resistance line at 1361.7 consumed. Provided that the buyers remain dominant above this line, apart from the 17th March high formed way back in 2014 at 1391.9, we see little resistance until 1423.7 comes into view – another weekly Quasimodo resistance barrier!
Daily view: Before weekly buyers can bid this market higher, however, offers at the daily Quasimodo resistance line drawn from 1375.1 remain firm. A close above this line would, as far as we can see, further confirm bullish intention from the current weekly broken Quasimodo line at 1361.7
H4 view: Consequent to a positive US jobs report on Friday, the price of gold fell sharply, whipsawing through H4 support at 1339.9, and just missing the broken daily Quasimodo line at 1333.4. Despite this, the metal made a snappy comeback and broke above pre-NFP levels, closing the day positively.
Our suggestions: In light of weekly action suggesting that further upside could be on the cards this week, and both the H4 and daily charts showing price trading below a daily Quasimodo resistance line at 1375.1, one has two options to trade:
- Risk going against weekly flow and look for (preferably confirmed – see the top of this report) sell trades at the aforementioned daily Quasimodo resistance line.
- Be patient and see if price continues to trade higher and closes above the current daily Quasimodo barrier. This would, at least for us, confirm bullish strength exists in this market, and by extension permit us to begin looking for lower timeframe buy entries into the market, with an overall take-profit target of 1423.7 – the weekly Quasimodo resistance level.
Levels to watch/live orders:
- Buys: Watch for price to consume the daily Quasimodo resistance line at 1375.1 and look to trade any retest seen thereafter (lower timeframe confirmation required).
- Sells: Flat (Stop loss: N/A).


