
EUR/USD:
Weekly gain/loss: -1.17%
Weekly close: 1.1320
Weekly perspective:
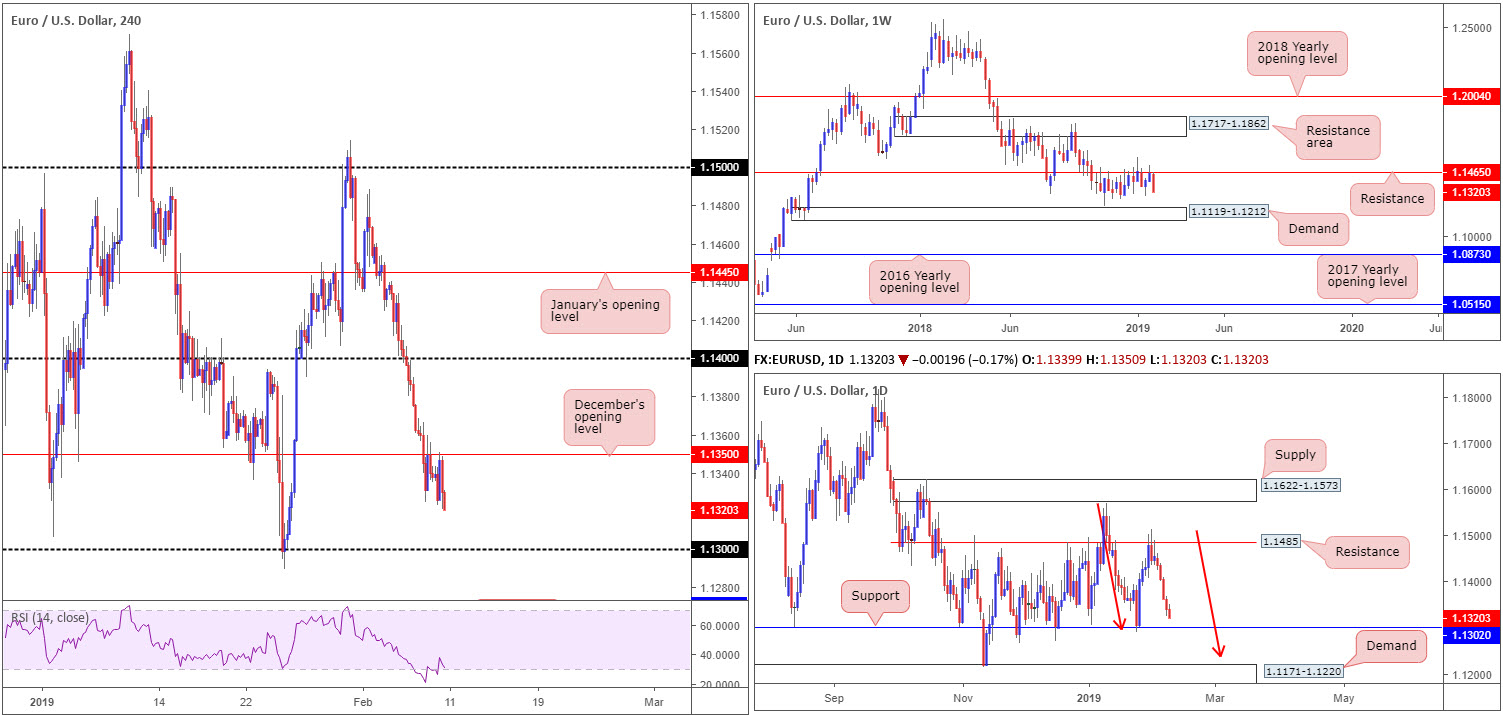
Boasting historical significance as far back as early February 2015 and capping upside action since late October 2018, long standing support/resistance at 1.1465, once again, contained upside last week. In the shape of a near-full-bodied bearish candle, the EUR/USD erased two weeks’ worth of gains and positioned demand at 1.1119-1.1212 in sight as a possible downside target this week.
Daily perspective:
By way of five consecutive bearish candles, recent trade concluded the week within striking distance of support coming in at 1.1302. In play since early September 2016, and capping downside throughout December 2018 and January 2019, this level has ‘market floor’ written all over it on this timeframe. Should we push for lower ground, nonetheless, as the weekly timeframe suggests, demand at 1.1171-1.1220 is next in the firing range (glued to the top edge of the current weekly demand area).
It might also be worth noting a possible ABCD bullish correction (red arrows) is in the process of forming that completes a few pips north of the aforementioned demand zone.
H4 perspective:
Amid early US Friday, the H4 candles faded the underside of December’s opening level at 1.1350, reinforced by a modest US dollar advance observed off lows at 96.45 (US dollar index).
For those who read Friday’s morning briefing you may recall the piece underlined a potential sell from 1.1350, having seen both weekly and daily charts expressing interest in lower levels. The report also went on to highlight potential downside targets around the 1.13 handle that boasts additional support out of the daily timeframe from 1.1302.
Well done to any of our readers who managed to jump aboard the move off 1.1350. All three timeframes point to further selling today/early week at least until we shake hands with 1.13.
Areas of consideration:
For traders who remain short, hopefully risk was reduced to breakeven prior to the close of trading Friday. The first take-profit target is 1.13. As mentioned above, this number is likely to enter the mix today or early in the week. A reaction is expected from here given its connection to the daily support at 1.1302, therefore keep eyes on H4 price action for signs of buying (entry/stop parameters can be defined according to the candlestick configuration) as this could offer an opportunity to enter long back up to December’s opening level at 1.1350.
In the event of a push beyond 1.13, however, the next profit target on the H4 scale is seen at support drawn from 1.1271, followed by a Quasimodo support at 1.1240 (both levels not visible on the screen).
Today’s data points: FOMC Member Bowman Speaks.
GBP/USD:
Weekly gain/loss: -1.06%
Weekly close: 1.2935
Weekly perspective:
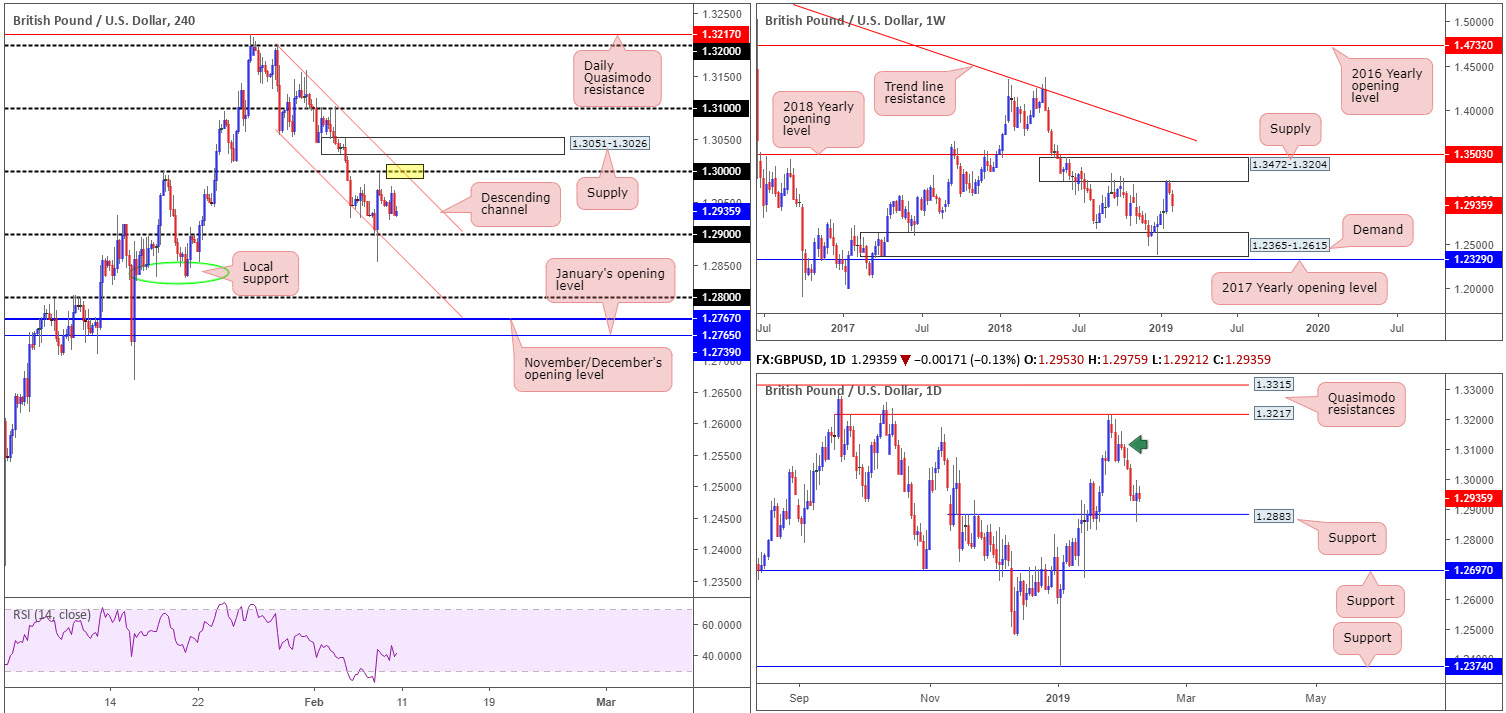
After cable found itself engaging with the lower border of supply drawn from 1.3472-1.3204 two weeks ago, this triggered further loss last week, down 138 pips at the close.
According to this timeframe, sellers remain in the driving seat. The next obvious downside target from this region can be seen at demand carved from 1.2365-1.2615.
Daily perspective:
Contrary to the outlook on the weekly timeframe, daily flow witnessed support at 1.2883 elbow its way into the spotlight (a Quasimodo resistance-turned support) in the later stages of last week. A rotation to the upside from 1.2883 this week has possible supply emerging from around the 1.3120 neighbourhood (green arrow), shadowed closely by Quasimodo resistance at 1.3217 in view. The research team is unsure regarding the said supply since the move from its base has not engulfed anything of note to the downside. A violation of 1.2883 this week, nevertheless, opens the gates to support registered at 1.2697.
H4 perspective:
Following Thursday’s somewhat turbulent session, Friday, although concluded marginally in negative territory, entered a relatively consolidative phase.
In terms of surrounding structure, we have key figure 1.30 to the upside and the 1.29 handle offering possible support. Both levels are contained within a descending channel formation (1.3199/1.3051). Beyond 1.29, local support (green oval) is observed around 1.2833, tailed closely by the 1.28 psychological mark. Above 1.30 it may also be worth noting supply coming in at 1.3051-1.3026.
Areas of consideration:
In a nutshell, the GBP/USD shows active sellers in play on the weekly timeframe, with potential to push lower; daily action respecting support and showing room to advance and the H4 candles trading 35 pips north of its 1.29 handle. Note this level may be weak due to Thursday’s whipsaw to lows at 1.2854 wiping out buyers, therefore, along with weekly structure, the pendulum looks to be swinging toward more of a decline this week.
A sell from 1.30, preferably close by where the aforementioned H4 channel resistance merges (yellow), is of interest. To avoid being whipsawed out of a trade on a fakeout (common viewing around psychological numbers), waiting for additional candlestick confirmation could be an idea. That way, not only is there seller intent, there’s also defined entry/exit levels to work with.
Should the market fail to advance and break 1.29 to the downside (and retest the underside of the level as resistance), shorts, preferably on the back of a H4 bearish candlestick pattern, towards local support mentioned above on the H4 timeframe at 1.2833 as an initial target could be seen.
Today’s data points: UK GDP m/m; UK Manufacturing Production m/m; UK Prelim GDP q/q; UK Prelim Business Investment q/q; FOMC Member Bowman Speaks.
AUD/USD:
Weekly gain/loss: -2.23%
Weekly close: 0.7084
Weekly perspective:
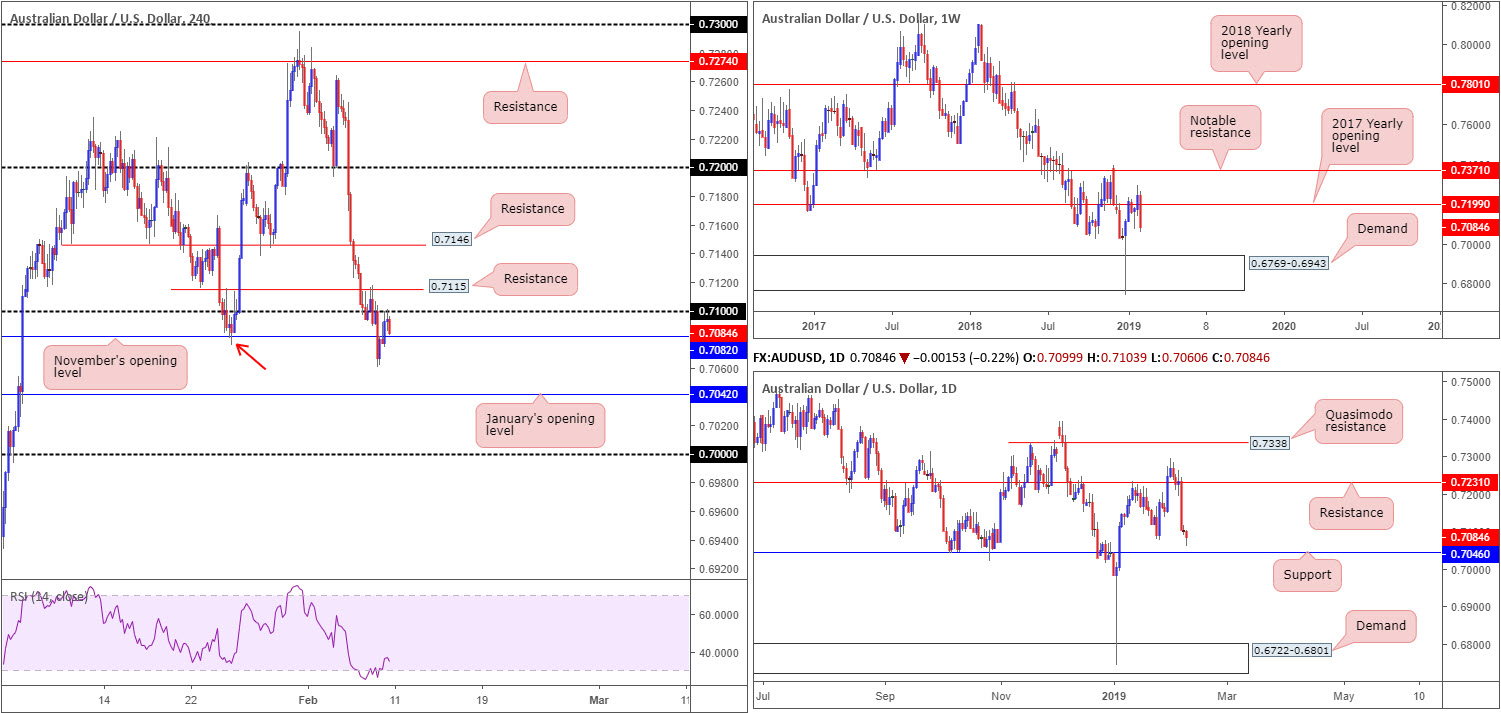
A key underperformer last week, the Australian dollar fell sharply against its US peer, erasing more than 160 pips off its value. Reclaiming the 2017 yearly opening level at 0.7199 to the downside in strong fashion, this has potentially set the stage for further selling this week, targeting demand at 0.6769-0.6943.
Daily perspective:
With buyers’ stops likely filled around the 0.7076 January 25 low, the runway appears clear towards nearby support priced in at 0.7046 this week. Beyond this number, there’s little support seen until the unit crosses swords with demand at 0.6722-0.6801 (glued to the underside of weekly demand highlighted above at 0.6769-0.6943).
H4 perspective:
A quick recap of Friday’s action on the H4 timeframe reveals the break of the 0.7076 January 25 low (red arrow) underlined above, was swiftly followed by a pullback to the 0.71 handle as resistance. What’s notable from a technical perspective here is the closing H4 candle’s strength off 0.71: a near-full-bodied bearish candle. This – coupled with the higher timeframes eyeing lower levels – could be enough evidence to suggest a selloff from here, targeting 0.7046: the daily support level and January’s opening level at 0.7042. The only grumble, however, is nearby November’s opening level directly below current price at 0.7082.
Areas of consideration:
Keeping it simple, the research team feels a sell at current price, with stop-loss orders tucked above 0.71, could be an option. Granted the sell has to contend with possible support from November’s opening level mentioned above at 0.7082, though having seen both weekly and daily timeframes emphasise further downside, along with the bearish H4 candle close off 0.71 mentioned above, sellers appear to have the upper hand at least until reaching daily support at 0.7046.
Today’s data points: FOMC Member Bowman Speaks.
USD/JPY:
Weekly gain/loss: +0.18%
Weekly close: 109.72
Weekly perspective:
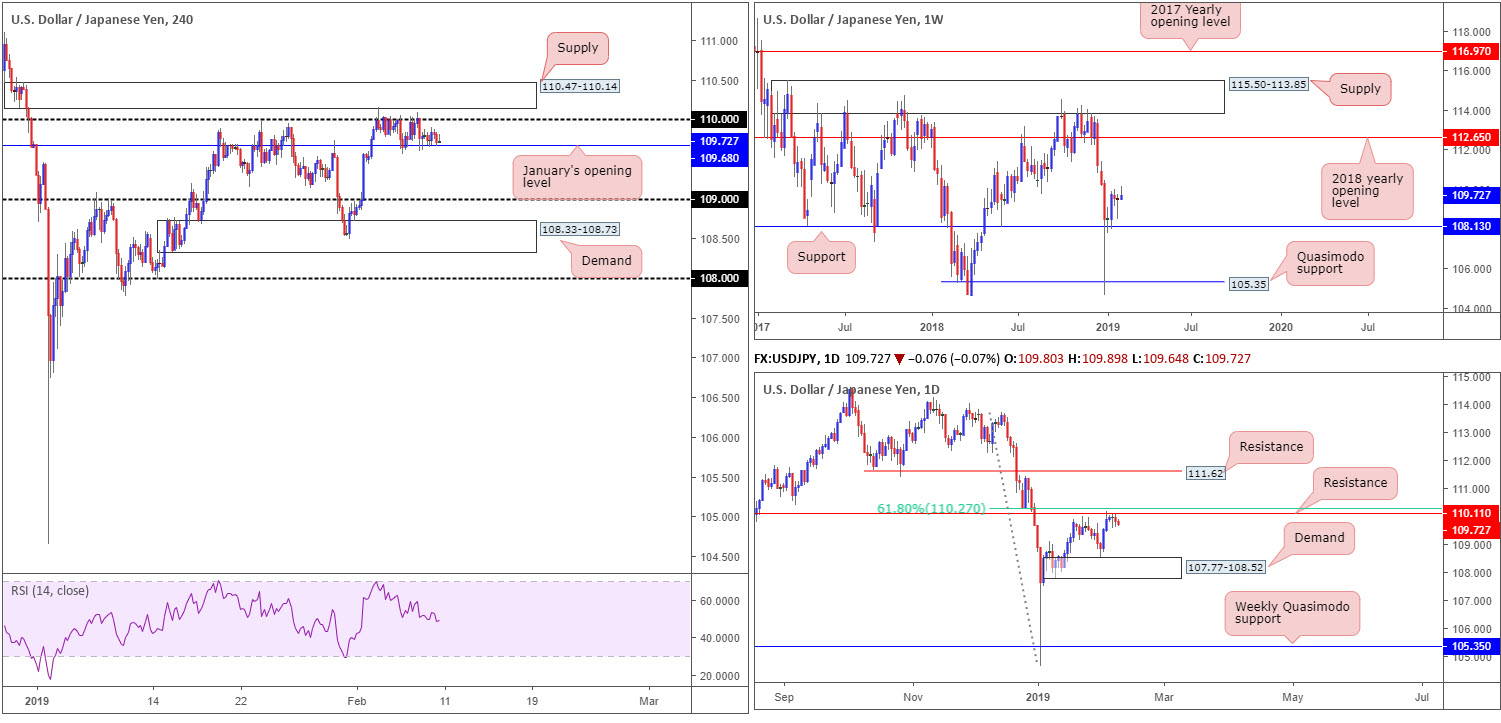
Despite the prior week’s bullish pin-bar candlestick pattern, limited upside movement took shape last week. In terms of structure on the weekly timeframe, the research team notes a clear path to the upside from the 108.13 support until connecting with the 2018 yearly opening level at 112.65. Should the market spin south, nonetheless, Quasimodo support at 105.35 is the next level on the hit list to be aware of beyond 108.13.
Daily perspective:
Aside from Monday’s advance, price entered into a phase of consolidation a few pips south of resistance at 110.11 and its nearby 61.8% Fibonacci resistance value at 110.27 last week. A violation of this level could lead to a move being seen towards resistance parked at 111.62, while a move lower has demand at 107.77-108.52 to target.
H4 perspective:
Since the beginning of the week, the pair has been busy carving out a tight range between the 110 handle and January’s opening level at 109.68.
On account of this somewhat dreary market of late, much of the following analysis will echo thoughts put forward in previous reports.
The 110 handle remains a forceful ceiling in this market. The supply hovering above 110 at 110.47-110.14, though, also remains of interest.
Another push above 110 this week not only trips stop-loss orders from traders attempting to fade the psychological mark, which, when filled, become buy orders to sell in to, breakout buyers will also likely attempt to join the movement here. This offer of liquidity to sell to, coupled with daily resistance seen plotted at 110.11 (and its nearby 61.8% Fibonacci resistance value at 110.27), will likely offer traders another opportunity to sell the current supply zone.
The only grumble in regard to selling the pair is weekly price trading above support at 108.13 and demonstrating room to press as far north as the 2018 yearly opening level at 112.65.
Areas of consideration:
Traders who believe the H4 supply and daily resistance is sufficient evidence to draw sellers’ attention will likely short this market at 110.14 with stop-loss orders planted just north of 110.47, should the supply area re-enter the fight. Once, or indeed if, the H4 candles reclaim 109.68 to the downside from here, this may be a good opportunity to begin thinking about reducing risk to breakeven and taking partial profits off the table. For conservative traders threatened by weekly structure exhibiting potential to the upside, however, waiting for additional H4 candlestick confirmation might be an idea worth exploring before pulling the trigger (entry/stop parameters can be defined according to this structure).
Today’s data points: FOMC Member Bowman Speaks; Japanese banks are closed in observance of National Foundation Day.
USD/CAD:
Weekly gain/loss: +1.34%
Weekly close: 1.3274
Weekly perspective:
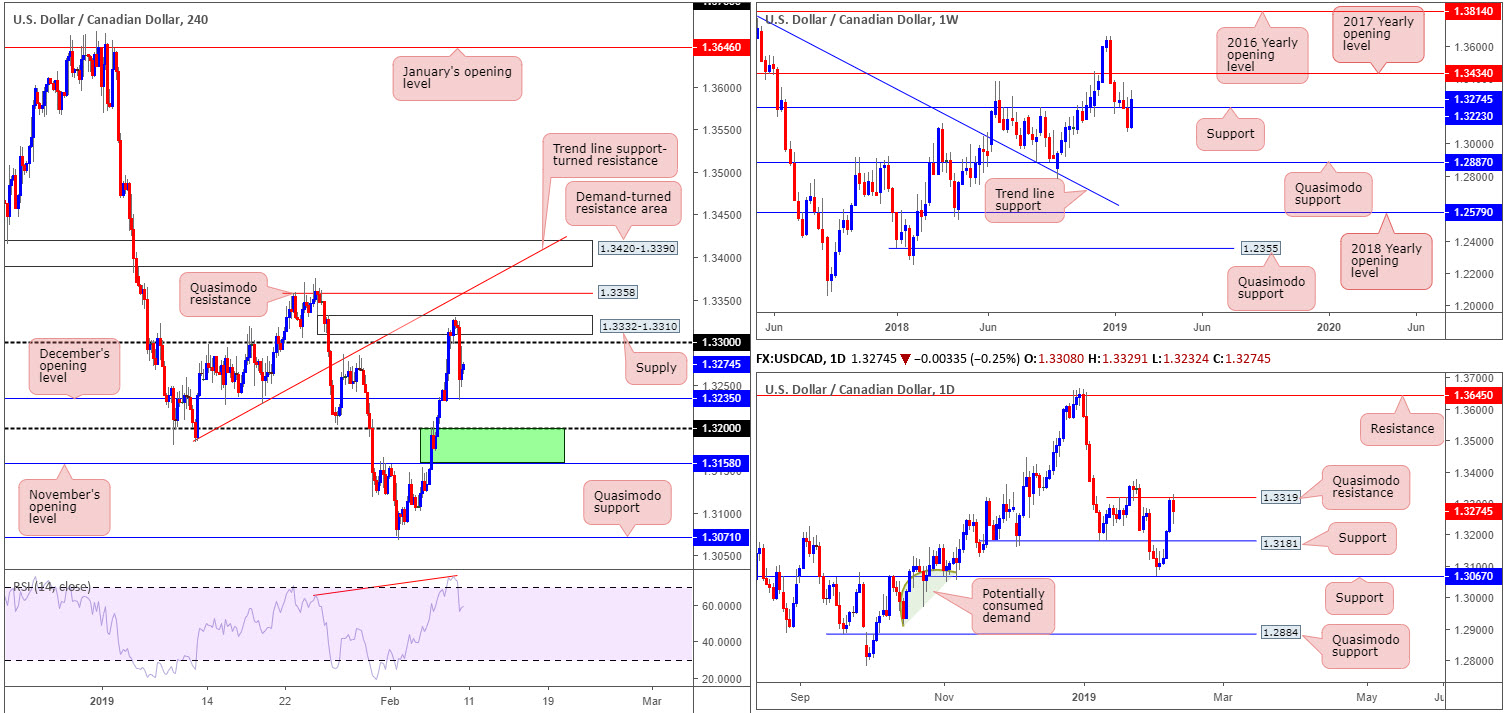
Reclaiming two weeks’ worth of losses and recapturing resistance at 1.3223, last week’s action potentially cleared the river north towards the 2017 yearly opening level at 1.3434. Still, before reaching this base of resistance, a possible retest of the recently broken resistance as support may be seen this week.
Daily perspective:
Upward momentum on the daily timeframe, spanning over four consecutive days, hit the pause switch Friday. Following a test of Quasimodo resistance at 1.3319, the pair consequently chalked up a reasonably worthy bearish candle. Assuming further selling takes form on the back of this, a move in the direction of support coming in at 1.3181 could be in store this week.
H4 perspective:
The number of people employed in Canada, according to Statcan’s report Friday, grew by 67,000 in January, beating market expectations. The unemployment rate increased 0.2 percentage points to 5.8% as more people looked for work, though ticked higher than market consensus. On a year-over-year basis, total employment was up 327,000 or 1.8%, reflecting increases in both full-time (+166,000) and part-time (+162,000) work.
The after effects of the latest job’s data, as you can see from the H4 chart, sent the USD/CAD spiralling south. After finding resistance from supply at 1.3332-1.3310, along with the RSI indicator drawing up a divergence/overbought reading, sellers overthrew the 1.33 handle to the downside and shook hands with December’s opening level at 1.3235, which, as you can see, held firm as support into the close.
Areas of consideration:
Having observed weekly price indicate further buying and daily price suggest a pullback to support at 1.3181, a retest of the weekly support at 1.3223 is likely this week, traders. With this being the case, buying opportunities between the 1.32 handle and November’s opening level at 1.3158 on the H4 timeframe may be something to watch for this week (green). Conservative traders might opt to wait and see how H4 action behaves within the said zone and enter based on a notable bullish candlestick formation (entry/stop parameters can be defined according to this structure). Assuming a setup comes to fruition, traders will be looking for a close above December’s opening level mentioned above at 1.3235. This, dependent on where one entered within the green area, could serve as a breakeven trigger, with the expectation of price reaching 1.33 as an initial take-profit target.
Today’s data points: FOMC Member Bowman Speaks.
USD/CHF:
Weekly gain/loss: +0.45%
Weekly close: 0.9997
Weekly perspective:
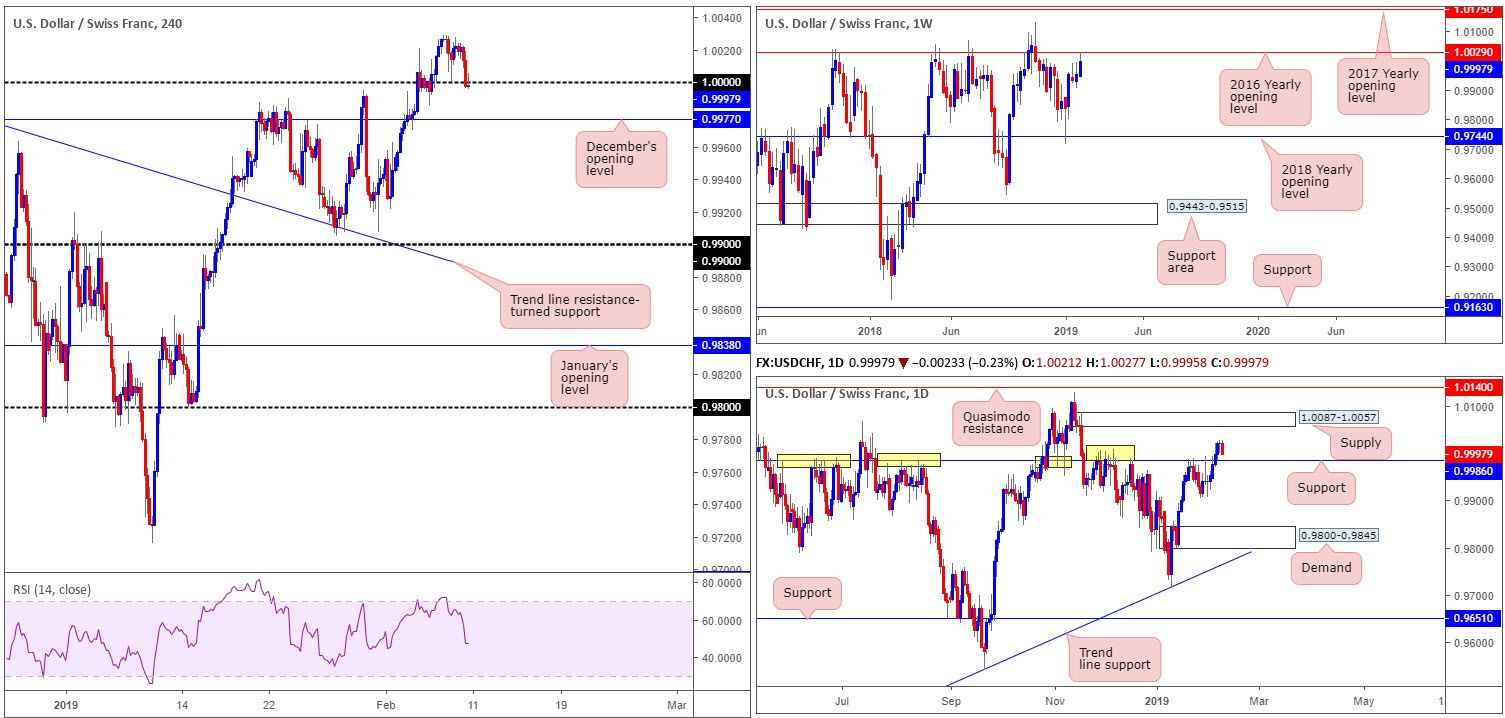
The USD/CHF market enjoyed another successful session in the green, up more than 40 pips on the week. According to our technical studies, though, weekly flow is seen dipping its toe into resistance territory at 1.0029: the 2016 yearly opening level. This is an incredibly strong barrier which should not be overlooked this week, with history dating as far back as early 2015.
Daily perspective:
Although weekly sellers may enter the fray off its respective resistance, daily players, after violating resistance at 0.9986 (now acting support) in recent trading, have supply at 1.0087-1.0057 in view as its next upside target. Note this is a fresh area of supply, meaning it has yet to be tested and is likely a strong barrier. It is also worth noting a move to this supply does not negate the weekly resistance at 1.0029. Between 1.0029 and the lower edge of daily supply at 1.0057 is less than thirty pips which is little more than a blip on the weekly scale.
However, before we reach this supply zone, the unit, thanks to Friday’s selling, appears poised to retest support at 0.9986. This barrier holds notable history (yellow); therefore at least a bounce to the upside is likely.
H4 perspective:
The story over on the H4 candles resembled a perfect buying environment Thursday. Amid early US hours, the pair retested 1.0000 (parity) as support in the shape of a bullish pin-bar formation. This, alongside H4 action exhibiting scope for a move towards resistance at 1.0053 (not seen on the screen), as you can imagine, excited candlestick enthusiasts.
Having weekly resistance at 1.0029 clouding 1.0000 proved too much for H4 buyers Friday, sending the H4 candles marginally sub 1.0000 into the closing stages of the week. In view of a H4 bearish pin-bar formation printing just beneath this key figure, December’s opening level at 0.9977 is next in line as support on the H4 timeframe. It might be worth noting, however, daily support enters the fold before this level at 0.9986.
Areas of consideration:
Given clear support seen nearby on the H4 timeframe at 0.9977, along with daily support plotted at 0.9986, selling this market based on where we’re coming from on the weekly timeframe is chancy. An alternative is to wait and see if the H4 candles close beyond 0.9977. This, according to our reading, opens the path south towards 0.99ish.
Upon observing a H4 close sub 0.9977, traders have a number of options they can explore in terms of selling. First is simply sell the breakout candle and position stop-loss orders above its wick. The second, and more conservative, route is waiting for a retest of 0.9977 to play out following the close lower. The retest, preferably moulded in the shape of a bearish candlestick pattern, offers traders a high-probability entry into the market with structured entry and stop levels.
Today’s data points: FOMC Member Bowman Speaks.
Dow Jones Industrial Average:
Weekly gain/loss: +0.39%
Weekly close: 25097
Weekly perspective:
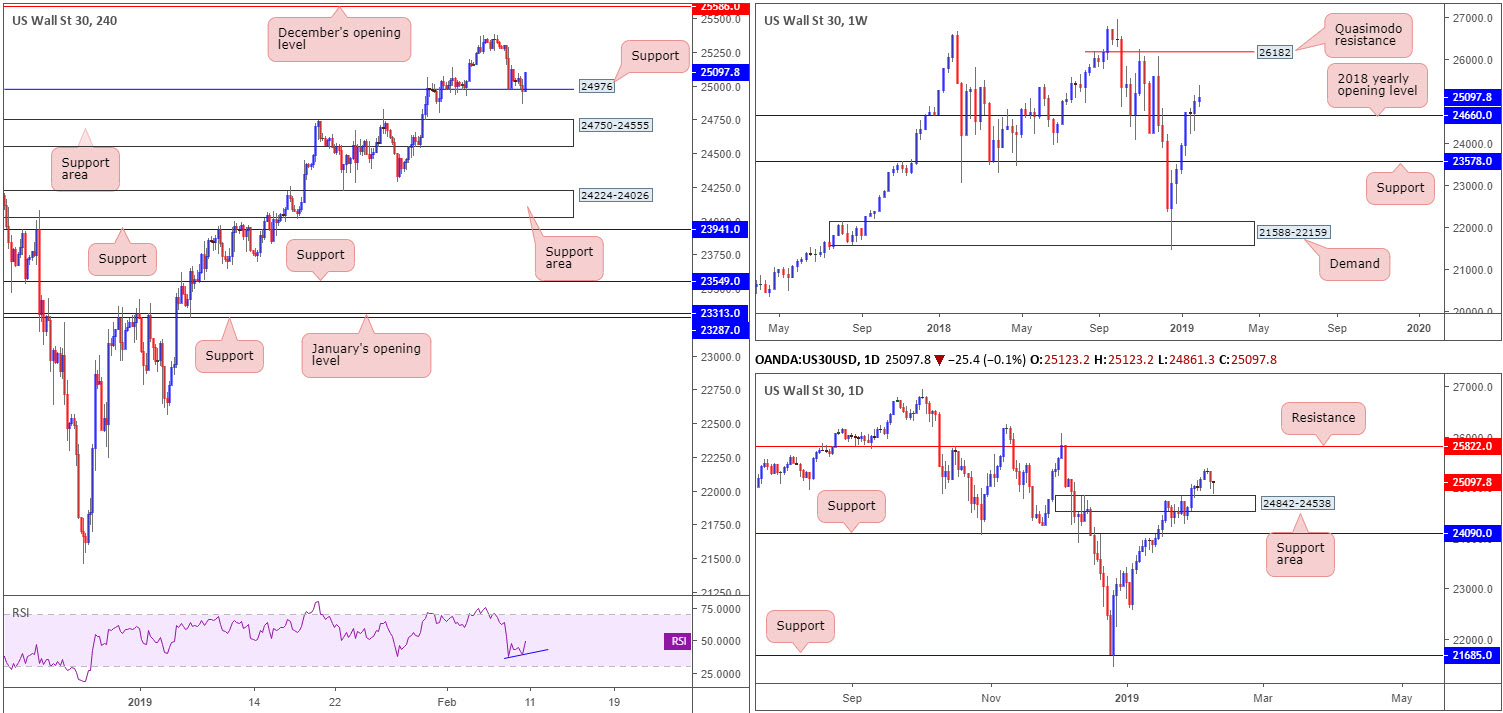
Despite firmly conquering the 2018 yearly opening level at 24660 to the upside in recent weeks, buyers were somewhat fragile last week. After striking highs at 25385, the index pulled back and chalked up a rather significant selling wick. A resurgence of buying this week could potentially place the index within trading distance of a Quasimodo resistance level at 26182.
Daily perspective:
A closer reading of this market shows Friday’s session created a strong bullish pin-bar formation a few points north of a support area at 24842-24538, after Thursday’s reasonably strong downside move. This candlestick pattern, coupled with a nearby support area, reflects a bullish stance going into this week.
H4 perspective:
A brief look at recent dealings on the H4 timeframe Friday shows consolidated movement off support at 24976. Note this level held price beautifully at the beginning of last week. In light of Friday’s closing candle forming in the shape of a full-bodied bullish candle, further buying could be seen today/early week, targeting last week’s highs at 25385, followed closely by December’s opening level at 25586. In addition to this, traders may also want to acknowledge the RSI printing a modest divergence reading (blue).
Areas of consideration:
A long from the H4 support mentioned above at 24976 is, of course, an option today on the back of Friday’s closing candle: enter long at the next opening candle, with stop-loss orders positioned beneath either its tail (24953) or 24861 (Friday’s low). As for initial take-profit targets, see above in bold.
Today’s data points: FOMC Member Bowman Speaks.
XAU/USD (GOLD):
Weekly gain/loss: -0.23%
Weekly close: 1314.2
Weekly perspective:
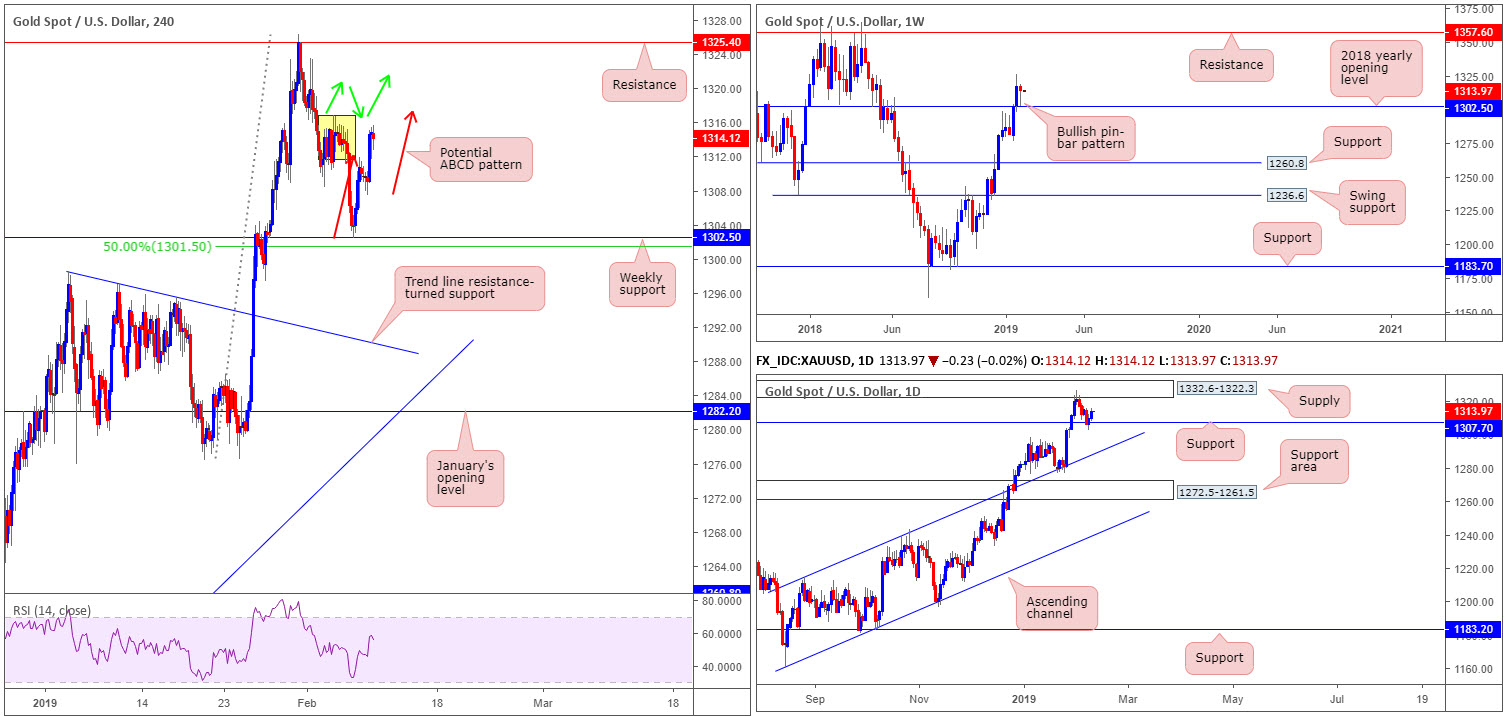
Over the course of last week’s session, the yellow metal receded to the 2018 yearly opening level at 1302.5. Although bullion registered a loss, the market concluded the week by way of a bullish pin-bar formation. This, given it came from support, is likely of interest to candlestick traders this week. With respect to upside targets from the current angle, buyers could potentially stretch this market as far north as resistance plotted at 1357.6.
Daily perspective:
Support at 1307.7, although suffering a minor breach to the downside, held ground at the later stages of last week. With the market now poised to test the underside of supply at 1332.6-1322.3, modest upside on this timeframe could be on the cards this week. A move beyond the current supply, as the weekly timeframe suggests, however, has Quasimodo resistance at 1356.8 to target (not seen on the screen).
H4 perspective:
By way of a partially completed ABCD formation to the upside (red arrows), the H4 candles responded from the weekly support noted above at 1302.5 (sited just north of a 50.0% support value on the H4 timeframe at 1301.5). This, along with daily support at 1307.7, was an area noted in previous reports as being somewhere active buyers likely inhabited. Well done to any of our readers who managed to jump aboard Thursday’s move and remain in the position.
Although we have some H4 supply lurking nearby around 1316.7/1311.5 (yellow) and a potential ABCD bearish completion around 1317.4, the daily supply at 1332.6-1322.3 (houses the H4 resistance seen at 1325.4 within) is likely the initial target for buyers off weekly support.
Areas of consideration:
For folks long this market off the current weekly support, it was mentioned in previous reports to consider reducing risk to breakeven incase H4 sellers enter the fold from the noted yellow supply.
Whether or not traders have liquidated a portion of their position already, the research team expects at least the daily supply at 1332.6-1322.3 to enter the fold this week.
Traders who missed the initial long from weekly support may receive a second opportunity to trade long should H4 price engulf 1316.7 (top edge of H4 supply) and retest it as support (green arrows). Though do bear in mind, overhead resistance is reasonably close by at the lower edge of daily supply at 1322.3.
The use of the site is agreement that the site is for informational and educational purposes only and does not constitute advice in any form in the furtherance of any trade or trading decisions.
The accuracy, completeness and timeliness of the information contained on this site cannot be guaranteed. IC Markets does not warranty, guarantee or make any representations, or assume any liability with regard to financial results based on the use of the information in the site.
News, views, opinions, recommendations and other information obtained from sources outside of www.icmarkets.com.au, used in this site are believed to be reliable, but we cannot guarantee their accuracy or completeness. All such information is subject to change at any time without notice. IC Markets assumes no responsibility for the content of any linked site. The fact that such links may exist does not indicate approval or endorsement of any material contained on any linked site.
IC Markets is not liable for any harm caused by the transmission, through accessing the services or information on this site, of a computer virus, or other computer code or programming device that might be used to access, delete, damage, disable, disrupt or otherwise impede in any manner, the operation of the site or of any user’s software, hardware, data or property.


