
EUR/USD:
Weekly gain/loss: -0.98%
Weekly closing price: 1.1769
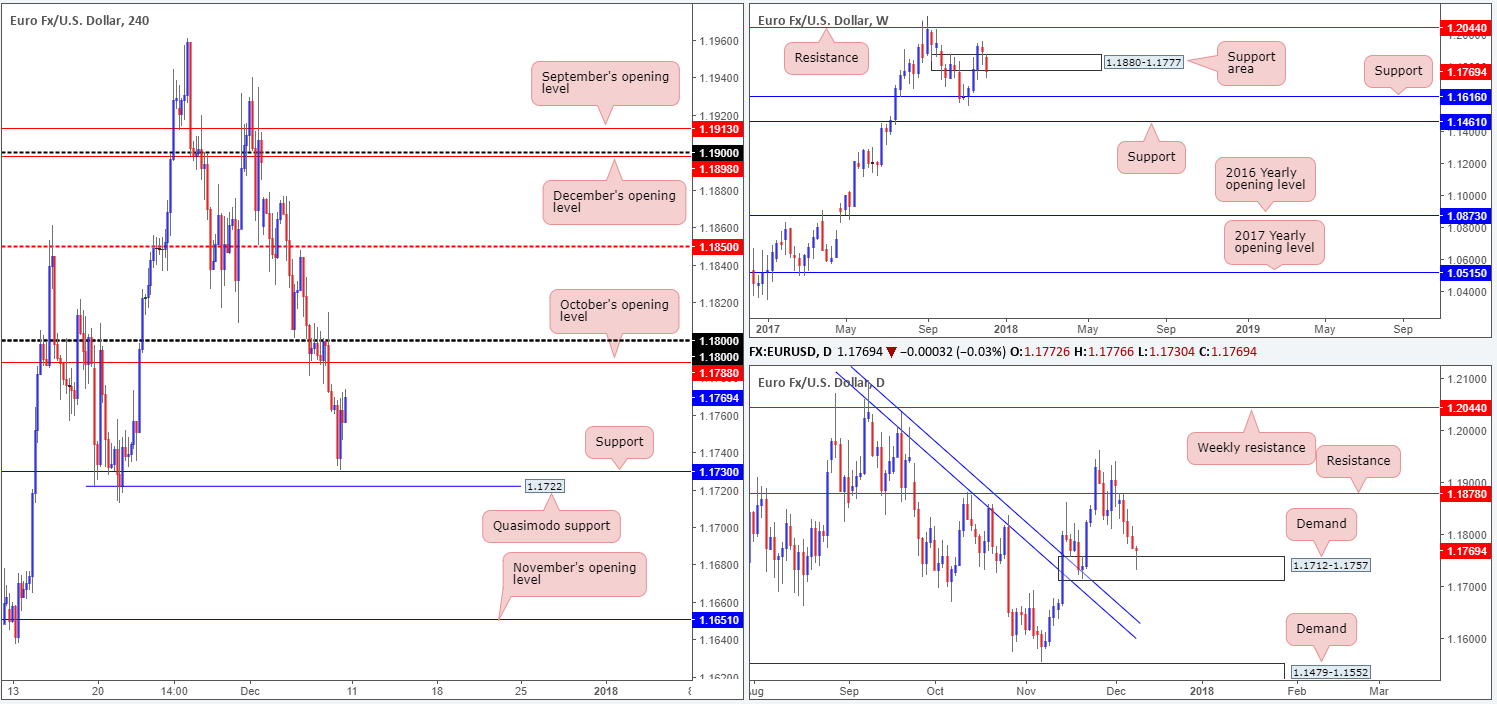
The single currency sustained additional losses last week, consequently closing the session a few pips beneath a weekly support area formed at 1.1880-1.1777. Potentially filling stop-loss orders here, we could either see a rotation back to the upside as bigger players look to buy into these orders or a continued move to the downside, targeting weekly support at 1.1616.
With the weekly picture in mind, we can see that the daily timeframe recently crossed swords with a daily demand area at 1.1712-1.1757 and chalked up a nice-looking daily buying tail (bullish pin bar). This will likely inspire candlestick enthusiasts this week since there is room seen for the market to gravitate back up to the daily resistance level plotted at 1.1878.
Moving across to the H4 timeframe, Friday’s movement shows that the euro switched to the upside a pip ahead of the H4 support level at 1.1730. The unit pushed higher from here despite hotter-than-expected US headline NFP numbers and a steady unemployment rate. The disappointment seems to have stemmed from weak US hourly earnings.
The aforesaid H4 support level, alongside the H4 Quasimodo support seen below it at 1.1722, were noted levels to keep an eye on for a bounce as both are positioned within the walls of the said daily demand area! It was a handsome place to buy, despite the possibility of having to contend with weekly selling beneath the current weekly support area at some point in the future.
Direction:
- Long: Further buying is possible according to daily structure. However, this would place H4 buyers in a difficult position due to October’s opening level seen nearby at 1.1788, followed closely by the 1.18 handle. In addition to this, it is difficult to judge what weekly price is thinking right now as a move in either direction is conceivable. For that reason, should you enter a buy on the basis of daily price, aggressive trade management is a MUST.
- Short: This is not really a sellers’ market right now, given the daily picture and uncertainty surrounding weekly price.
Data points to consider: No high-impacting events on the docket today.
Areas worthy of attention:
Supports: 1.1730; 1.1722; 1.1880-1.1777; 1.1712-1.1757.
Resistances: 1.1788; 1.18 handle; 1.1878.
GBP/USD:
Weekly gain/loss: -0.59%
Weekly closing price: 1.3381
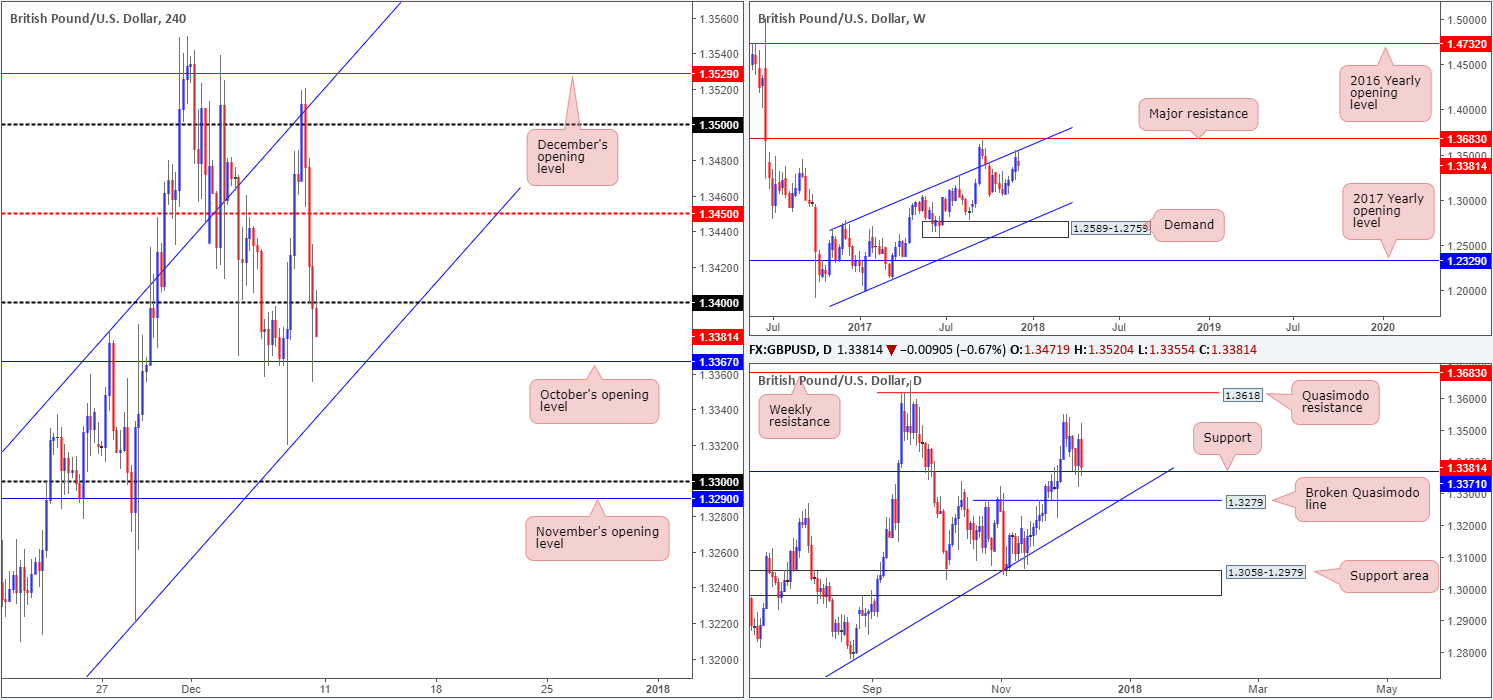
After shaking hands with a weekly channel resistance extended from the high 1.2673 a few weeks back, the British pound began showing signs of weakness last week. Further losses from this area could eventually see the pair ultimately cross paths with weekly demand at 1.2589-1.2759, which happens to intersect with a weekly channel support etched from the low 1.1986.
Before weekly price reaches this point, however, the technical picture on the daily timeframe shows immediate support in play at 1.3371. Not only that, there’s also a nearby broken daily Quasimodo support at 1.3279 to contend with that unites with a daily trendline support taken from the low 1.2108.
A quick recap of Friday’s trade on the H4 timeframe shows the unit failed to sustain gains beyond the 1.35 handle in early European hours. This brought about a rather dominant selloff that continued throughout the remainder of the day, consuming both the H4 mid-level support at 1.3450 and the 1.34 handle, consequently ending the session bouncing from October’s opening level pegged at 1.3367 and retesting 1.34 as resistance.
There was a brief moment of respite during yesterday’s selloff as price bounced from the 1.34 handle amid the US job’s report. Despite this, Friday’s movement seems to have been overshadowed by Britain and the EU reaching a deal. So why the selloff?
Reports followed that trade talks would not start immediately in 2018 and it would not be realistic to see a trade deal finalized before March 2019, therefore adding an air of uncertainty surrounding ‘Brexit’ negotiations and hurting demand for the GBP.
Direction:
- Long: Buying, we would agree, is appealing on the daily timeframe, but is somewhat precarious on both H4 and weekly timeframes. Not only is there the 1.34 handle to contend with on the H4 picture, one also has to keep in mind where price is coming from: a weekly channel resistance!
- Short: A sell, despite positioned in-line with weekly structure, is just as challenging unfortunately. Besides the noted near-term support on the H4 timeframe at 1.3367 (plotted close by a H4 channel support extended from the low 1.3061), one also has to accept the possibility of further buying from the current daily support.
Neither a long nor shorts seems attractive at this time, at least from a technical standpoint.
Data points to consider: No high-impacting events on the docket today.
Areas worthy of attention:
Supports: 1.3367; H4 channel support extended from the low 1.3061; 1.3371; 1.3279; daily trendline support taken from the low 1.2108.
Resistances: 1.34 handle; 1.3450; weekly channel resistance taken from the high 1.2673.
AUD/USD:
Weekly gain/loss: -1.33%
Weekly closing price: 0.7507
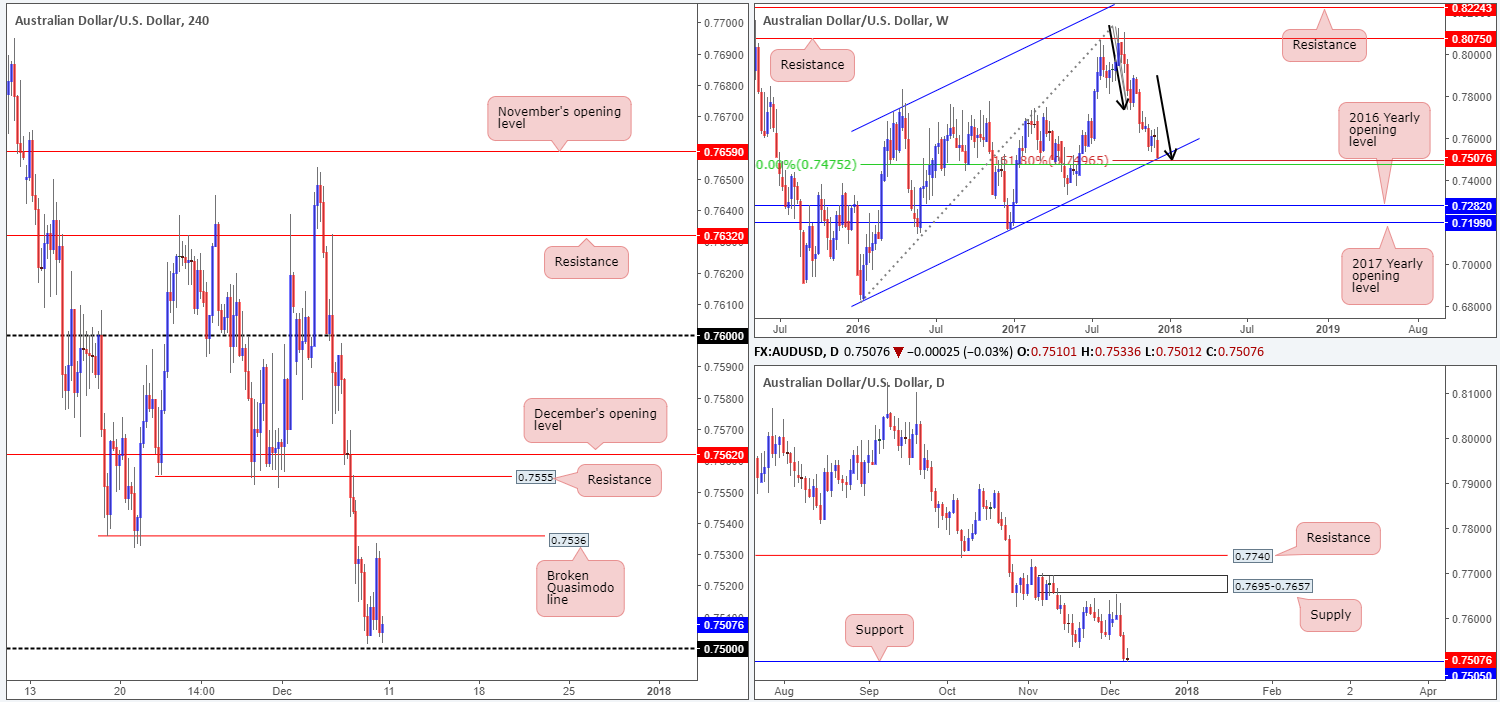
The AUD suffered a nasty decline amidst trading last week, chopping 107 pips off its value. This has, as you can see on the weekly timeframe, positioned weekly price around the weekly channel support extended from the low 0.6827. What’s interesting about this line is that it merges closely with a weekly 50.0% value at 0.7475 taken from the high 0.8125, and a nice-looking weekly AB=CD (see black arrows) 161.8% Fib ext. point situated at 0.7496.
A closer look at price action on the daily timeframe reveals that the unit is also seen trading around a daily support level at 0.7505. This is not a level to overlook as it boasts an incredibly strong history. The other key point to note here is the daily inverted pin bar formed during Friday’s trading. To most candlestick traders this is considered a bullish signal.
A brief look at recent dealings on the H4 timeframe shows that the H4 candles bottomed ahead of the 0.75 handle on Friday. A modest run to the upside was seen after the greenback came under pressure amid less-than-stellar US average hourly earnings, but failed to preserve gains past highs of 0.7533 and dipped to a low of 0.7501 into the close, ending the day unchanged.
Direction:
- Long: The 0.75 handle is considered a strong buy zone given the higher-timeframe confluence surrounding the line. In order to avoid any whipsaw that may be seen through 0.75, and considering that there is likely higher-timeframe players involved here, a larger-than-usual stop may be required. Beyond the 0.7457 low seen back on the 06/06/17 (H4 timeframe) could be an option for stop-loss placement.
- Short: It’d be very risky to short into current structure, despite the downtrend in play right now!
Data points to consider: No high-impacting events on the docket today.
Areas worthy of attention:
Supports: 0.75 handle; weekly channel support extended from the low 0.6827; 07505; 0.7475; weekly AB=CD 161.8% Fib ext. point situated at 0.7496.
Resistances: 0.7555; 0.7536.
USD/JPY:
Weekly gain/loss: +1.22%
Weekly closing price: 113.44
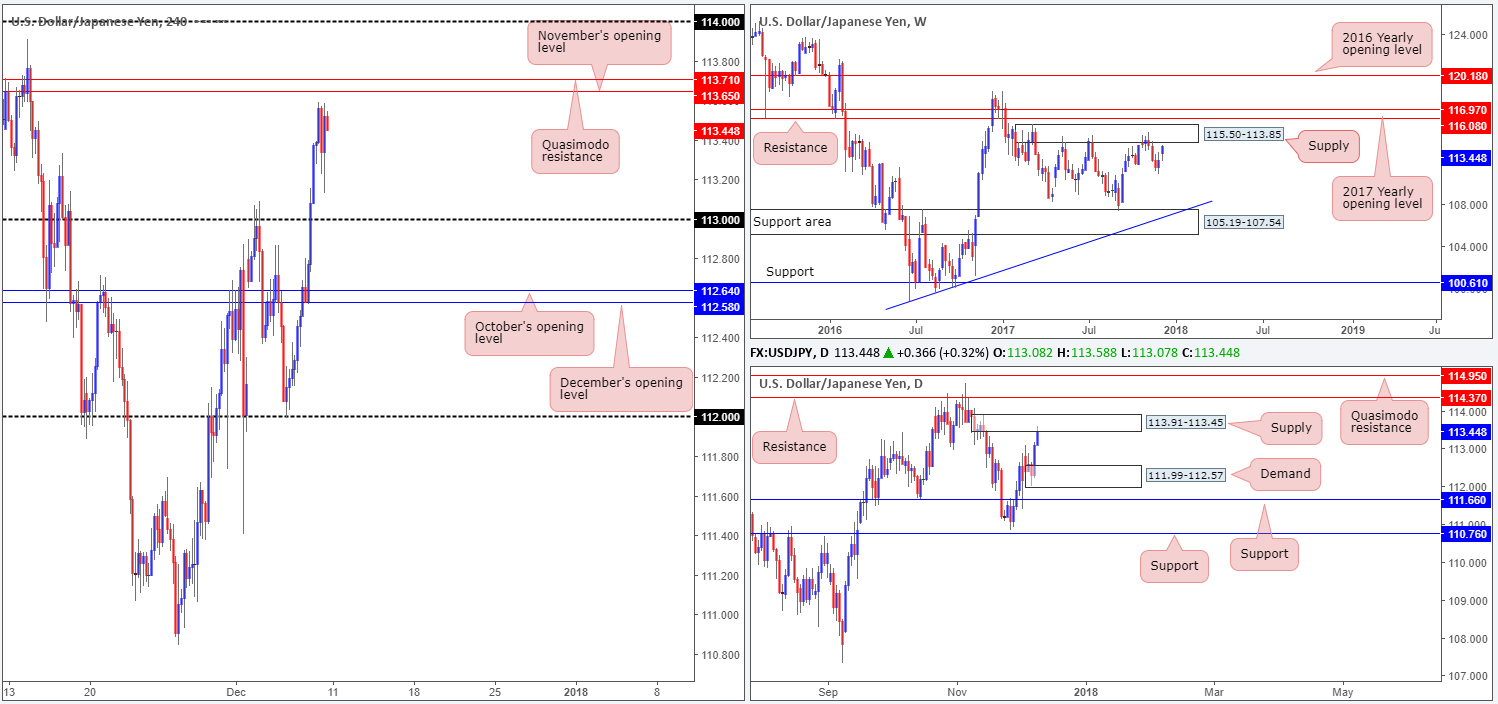
Following the previous week’s weekly bullish engulfing candle, the USD/JPY extended north last week and is now seen closing in on the weekly supply zone pegged at 115.50-113.85. This area has managed to cap upside on three occasions this year, so it is not a barrier one should overlook!
Elsewhere, we can see that daily price concluded the week crossing paths with a daily supply coming in at 113.91-113.45. What’s interesting about this area is that it is glued to the underside of the aforementioned weekly supply. A violation of this daily zone, nonetheless, would almost immediately expose the daily resistance plotted at 114.37, followed closely by a daily Quasimodo resistance level seen at 114.95 (both sited within the noted weekly supply).
The impact of Friday’s US NFP report sent the H4 candles to a session low of 113.13, despite a better-than-expected headline NFP print and a steady unemployment rate. The push lower appears to have come from weak US hourly earnings.
As for H4 price action, we have November’s opening level carved at 113.65, shadowed closely by the H4 Quasimodo resistance marked at 113.71 seen just ahead. As these two levels are drawn within the current daily supply zone, and knowing that the daily supply is bolstered by a weekly supply, a move to the downside could be on the cards this week.
Direction:
- Long: It’d be very risky to buy into current structure, despite the latest swing north!
- Short: A sell from 113.71/113.65 (H4 Quasimodo/Nov open line) on the H4 timeframe is, technically speaking, a high-probability reversal zone. Not only do you have a daily supply in motion, one also has a weekly supply bolstering the daily zone! The only problem is stop-loss placement. Setting stops above the current daily supply is appealing, but then you’re potentially opening yourself up to a fakeout up to the round number seen at 114! A healthy rotation from the H4 barriers, however, could target the 113 handle and quite possibly the daily demand base seen at 111.99-112.57 (positioned nearby December/October’s opening levels on the H4 timeframe at 112.58/112.64).
Data points to consider: No high-impacting events on the docket today.
Areas worthy of attention:
Supports: 113 handle.
Resistances: 113.65; 113.71; 114 handle; 113.91-113.45; 115.50-113.85.
GOLD:
Weekly gain/loss: -2.49%
Weekly closing price: 1248.0
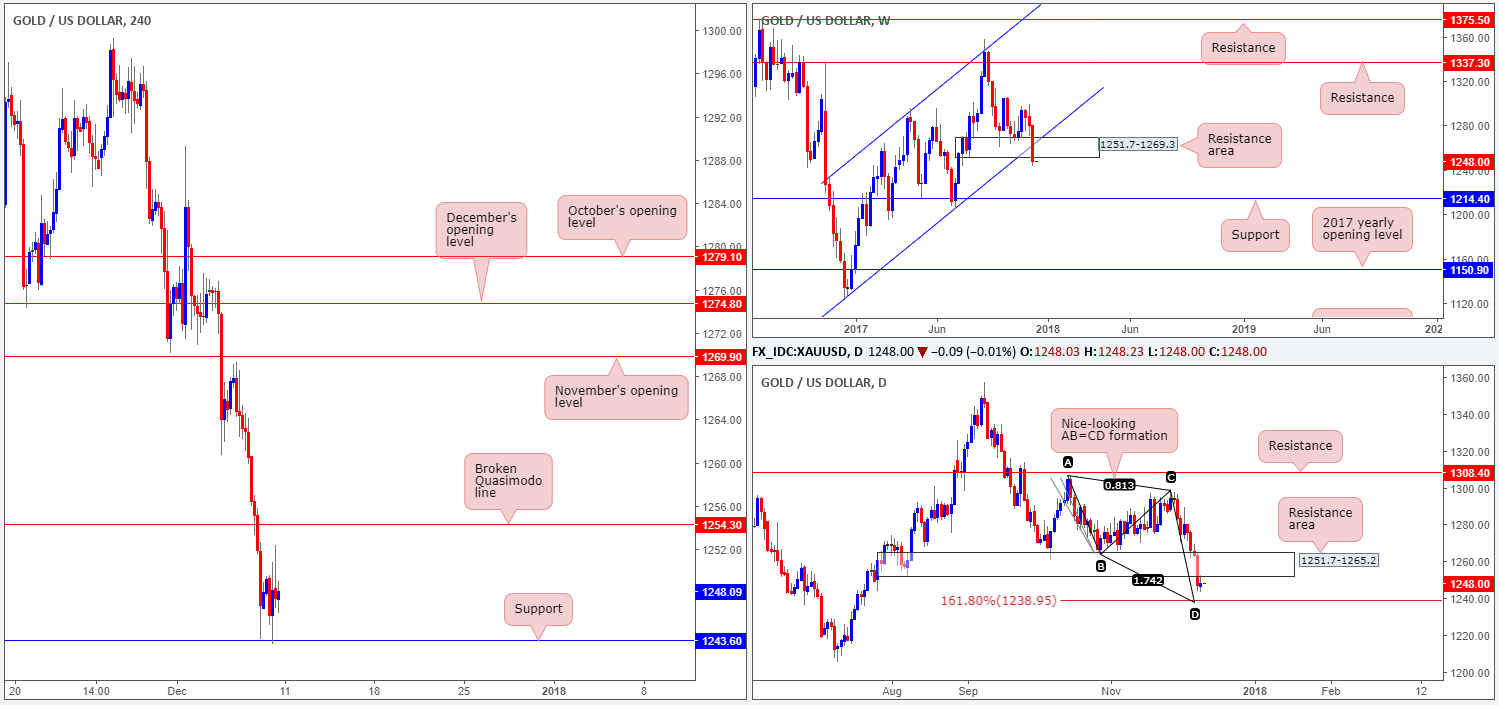
Over the course of last week’s sessions the yellow metal posted a pivotal near-full-bodied weekly bearish candle, registering its third consecutive weekly loss. With the weekly demand at 1251.7-1269.3 now out of the picture (acting resistance area), further downside could be on the cards this week as there’s little support seen in the firing range until we hit the 1214.4 barrier.
In conjunction with weekly price, the daily candles also drove beneath a daily demand base drawn from 1251.7-1265.2 (located within the lower edge of the said weekly demand). What’s visible from the daily timeframe, however, is Friday’s action retested the underside of the daily base (now a resistance area) and printed a mild selling wick. Also of particular interest on this timeframe is the daily AB=CD 161.8% Fib ext. point seen below at 1238.9.
Bouncing across to the H4 timeframe, it is clear to see that the H4 candles caught a fresh bid around the H4 support level seen at 1243.6 on Friday. This level, although technically sound, was likely provided an extra lever on the back of lower-than-expected US hourly earnings (remember a dollar selloff usually translates to gold buying). A violation of the current H4 support this week would likely place the H4 support at 1235.9 in view (not seen on the screen).
Direction:
- Long: Buying this market after such a dominant push below significant higher-timeframe structure is chancy. A lot of traders will likely be looking to sell this momentum on pullbacks.
- Short: A sell from the broken H4 Quasimodo line at 1254.3 is still an option we believe. As highlighted in Friday’s outlook, this barrier carries weight due to its position on the higher timeframes: the underside of the broken weekly/daily demands at 1251.7.
Areas worthy of attention:
Supports: 1243.6; 1235.9; 1238.9; 1214.4.
Resistances: 1254.3; 1251.7-1265.2.


