
EUR/USD:
Weekly Gain/Loss: -0.42%
Weekly Close: 1.1551
Weekly perspective:
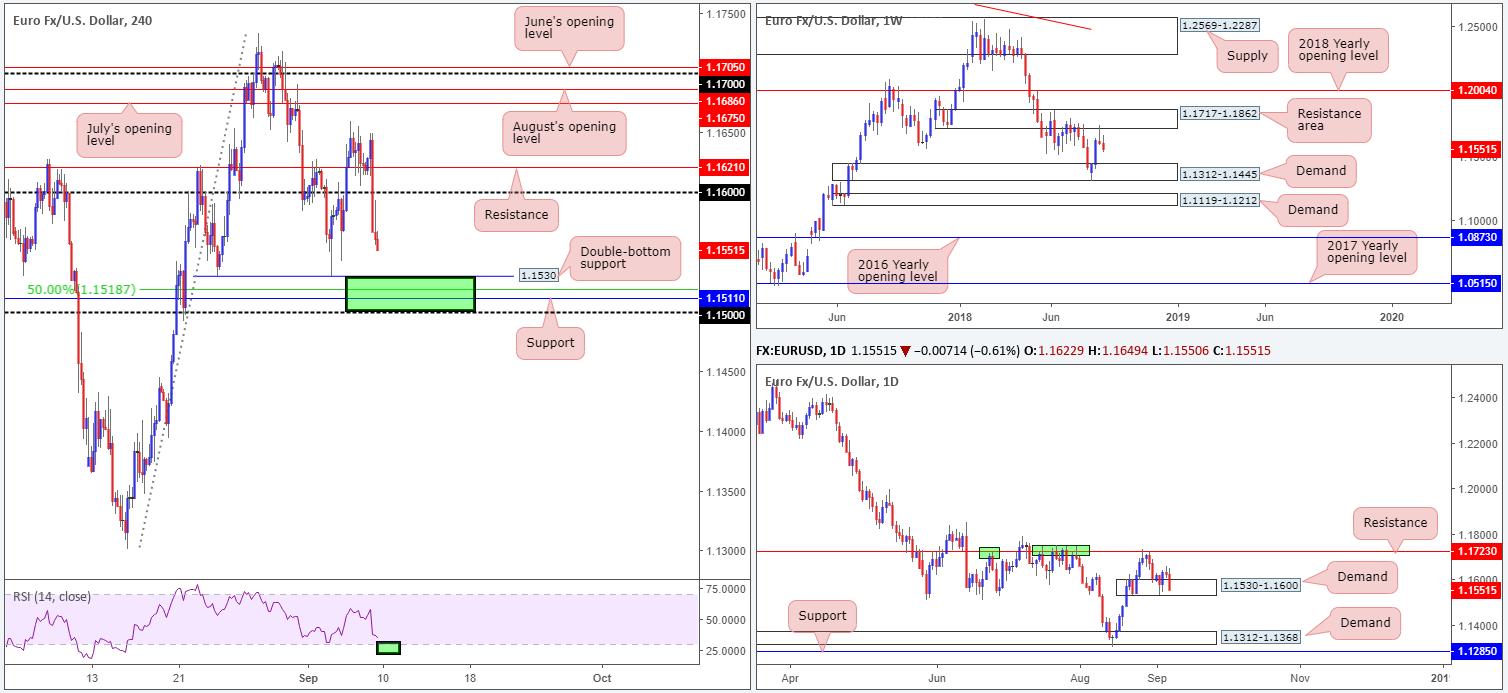
Recently retreating from the underside of a weekly resistance area at 1.1717-1.1862 by way of a bearish pin-bar formation set the stage for further losses last week. Technically speaking, another wave of selling may be in store this week, given the next downside target on this scale is fixed around a demand base coming in at 1.1312-1.1445.
Daily perspective:
Demand at 1.1530-1.1600 elbowed its way into the spotlight in recent trade, following a selloff from nearby resistance plotted at 1.1732 (positioned within the lower limits of the aforementioned weekly resistance area). As shown on the chart, the pair struggled to print anything meaningful to the upside from here, and concluded the week chalking up a near-full-bodied bearish candle that closed at its lows.
Outside of this demand, the next area of interest can be seen around demand penciled in at 1.1312-1.1368.
H4 perspective:
Following the release of Friday’s US non-farm payrolls report for August, the euro fell sharply against its US counterpart. The US economy added 201k jobs in the month, slightly above the forecasted 191k.
Friday’s move lower, as you can see, obliterated the 1.16 handle and possibly opened the gates for an approach towards an area of support marked in green at 1.15/1.1530 (comprised of a round number at 1.15, a support barrier with reasonably strong history at 1.1511, a 50.0% support value at 1.1518 and a double-bottom support at 1.1530). This, in terms of the overall technical picture, is likely the last line of defense for the current daily demand base, as a break of the H4 support zone suggests the market may head in the direction of weekly demand mentioned above at 1.1312-1.1445.
Areas of consideration:
The green H4 support area highlighted above at 1.15/1.1530 is likely on the radar for many intraday players today/early this week for possible longs. Although this area boasts relatively attractive confluence, traders are urged to consider the bigger picture here. With the threat of further selling being seen from the weekly timeframe, and a somewhat fragile daily demand zone, buyers may struggle to keep hold of the current H4 support area.
With this in mind, we see two possible options:
- Wait and see how H4 price action responds once the unit tests 1.15/1.1530. A tasty-looking bullish candlestick formation printed from within the area not only indicates the pair may want to retest the underside of 1.16, it’d also provides traders a location to position stops along with a level to enter.
- A H4 close beneath 1.15/1.1530 suggests the market probably wants to shake hands with the top edge of weekly demand at 1.1445. This – coupled with a retest to the underside of 1.15 – is likely enough to stir sellers into action and bring price lower. Whether or not one chooses to wait for candlestick confirmation here, is, of course, trader dependent.
Today’s data points: FOMC member Bostic speaks.
GBP/USD:
Weekly Gain/Loss: -0.29%
Weekly Close: 1.2913
Weekly perspective:
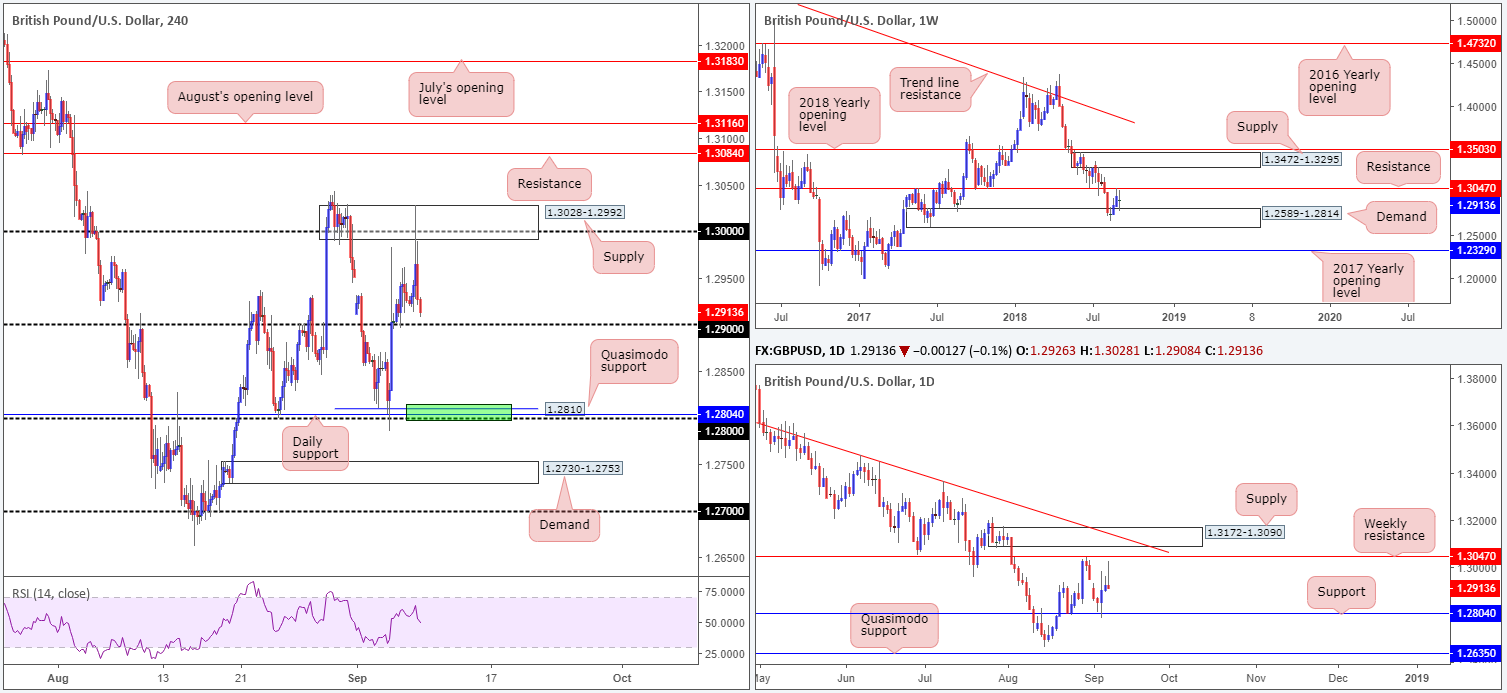
In the shape of a clear-cut indecision candle, the GBP/USD was seen confined to a resistance level drawn from 1.3047 and a demand base coming in at 1.2589-1.2814 over the course of last week. Outside of these zones, traders are urged to keep tabs on supply at 1.3472-1.3295 and the 2017 yearly opening level at 1.2329.
Daily perspective:
Similar to the weekly timeframe, daily action is currently trading between the aforementioned weekly resistance and a daily support level marked at 1.2804 (located within the upper limits of the said weekly demand base). Beyond the weekly resistance line, a nearby daily supply can be seen at 1.3172-1.3090, which happens to fuse with a daily trend line resistance (etched from the high 1.3472). The other key thing to note on this scale is Friday’s bearish pin-bar formation.
H4 perspective:
The release of Friday’s upbeat US non-farm payrolls report for August saw the pound selloff from the underside of the key figure 1.30 (check the M30 timeframe for a clearer view). A firmly bid USD (DXY > 95.00) pressured the unit lower into the closing bell, placing the H4 candles within striking distance of the 1.29 handle.
For those who read Friday’s briefing you may recall the team highlighting 1.30 for possible shorting opportunities, given it converged with a strong H4 supply at 1.3028-1.2992. Well done to any of our readers who managed to take advantage of this move.
Areas of consideration:
Having seen limited confluence around 1.29, it’s unlikely the H4 candles will produce much of a bounce from this number.
The more appealing zone, from a technical standpoint, likely falls in around the 1.28 neighborhood marked in green. Surrounded by a H4 Quasimodo support level at 1.2810 and a daily support level mentioned above at 1.2804, along with the top edge of weekly demand at 1.2814, this area could potentially provide a platform for buyers this week.
Today’s data points: UK GDP m/m; UK manufacturing production m/m; UK goods trade balance; FOMC member Bostic speaks.
AUD/USD:
Weekly Gain/Loss: -1.21%
Weekly Close: 0.7102
Weekly perspective:
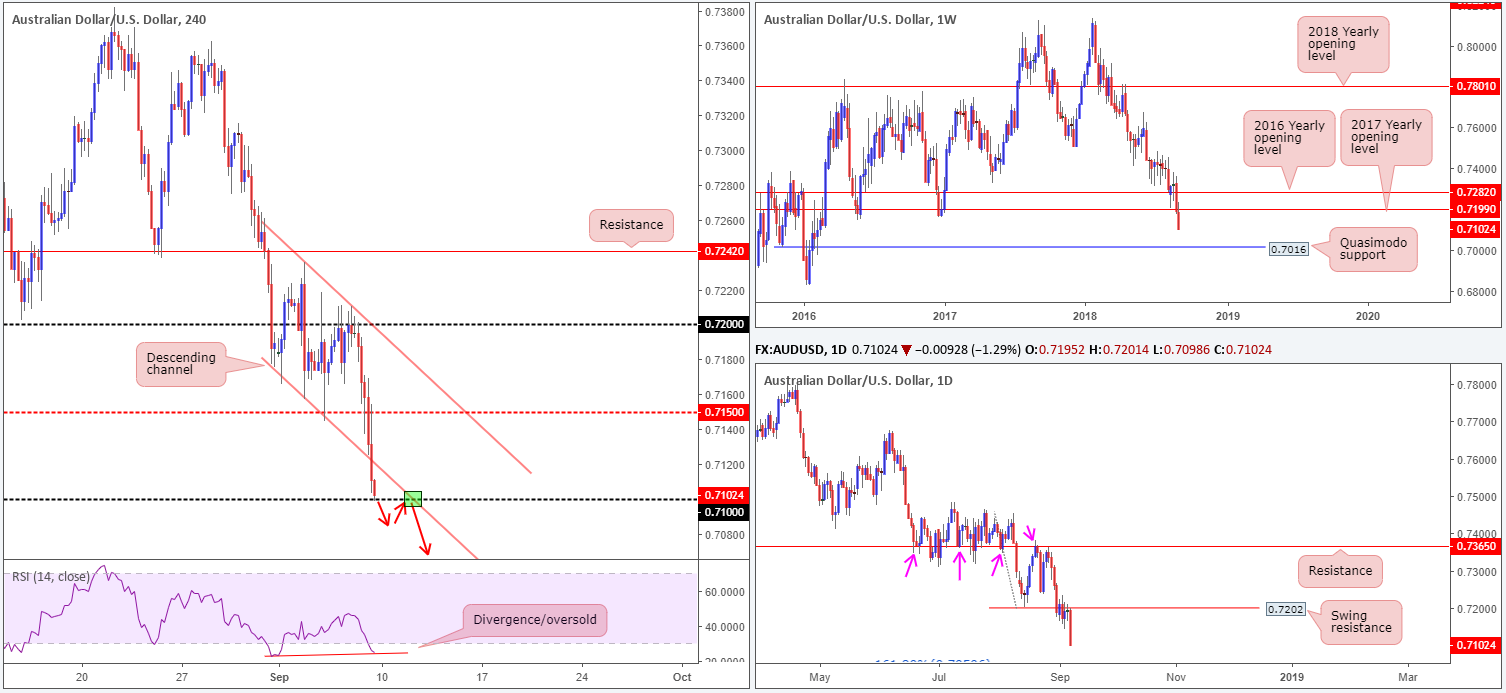
The Australian dollar sustained additional losses last week, ending the session producing a near-full-bodied bearish candle. The selloff seen from the underside of the 2017 yearly opening level at 0.7199 has yet to reach notable support, with the next obvious barrier not coming into view until around 0.7016: a Quasimodo support. This suggests further selling could be on the cards.
Daily perspective:
Swing resistance at 0.7202 did a superb job in capping upside last week. To the left of current price, active demand is also limited (it appears the areas were consumed as price rallied higher in February 2016) until we reach possible support at 0.7050: a 161.8% Fib ext. point (taken from the high 0.7453), followed closely by the weekly Quasimodo support mentioned above at 0.7016.
H4 perspective:
A combination of strong USD buying and US trade headlines weighed on the commodity currency on Friday. Shaped by a series of H4 bearish candles, the AUD/USD swept through orders around the mid-level support at 0.7150 and eventually took out a channel support (etched from the low 0.7177). The precipitous drop, as you can see, ended with the unit crossing swords with the 0.71 handle. It might also be worth noting the RSI indicator is currently displaying an oversold/divergence reading.
In terms of market data, the U.S. Bureau of Labor Statistics reported non-farm payrolls increased by 201K in August, surpassing the market consensus of 191K. US President Trump also recently told reporters the US were ready to impose new tariffs on $267 billion worth of Chinese goods in addition to the planned $200 billion.
Areas of consideration:
Having seen limited support visible on the higher timeframes until reaching the 0.7050 point, along with the possibility of resistance forming around the H4 channel support-turned resistance, entering long from 0.71 is not considered a high-probability play.
In light of this, traders are likely watching for a H4 close to form beneath 0.71. This, along with a retest to the underside of this number as resistance molded in the shape of a bearish candlestick formation (stop-loss placement governed by the pattern for those looking to sell) would, technically speaking, likely draw in additional sellers to push towards 0.7050: the daily 161.8% Fib ext. support. What’d be even more appealing for sellers is for price to retest 0.71 at the point where the H4 channel resistance merges with this number (red arrows – green point).
Today’s data points: RBA Assist Gov. Bullock speaks; China inflation numbers; FOMC member Bostic speaks.
USD/JPY:
Weekly Gain/Loss: 0.00%
Weekly Close: 111.04
Weekly perspective:
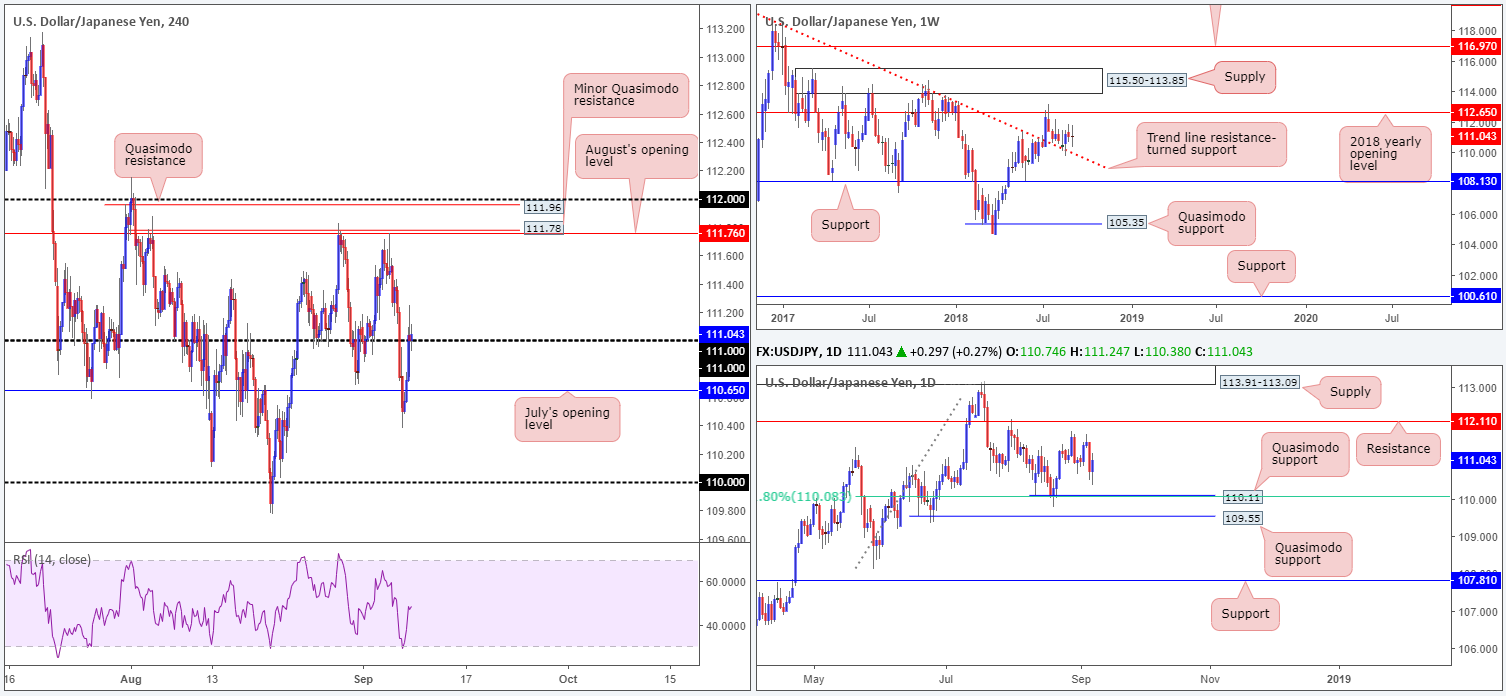
USD/JPY prices are effectively unchanged this week, despite ranging more than 130 pips. A few weeks back, the pair strongly retested a trend line resistance-turned support (taken from the high 123.57), though has so far failed to generate much upside presence. Having seen this line hold firm as resistance on a number of occasions in the past, however, it’s likely to remain a defensive barrier going forward. Further buying from current price has the 2018 yearly opening level at 112.65 to target.
Daily perspective:
Structure on the daily timeframe to be cognizant of this week falls in at a resistance level drawn from 112.11, and two layers of Quasimodo support: 109.55 and 110.11. Note 110.11 converges with a 61.8% Fib support value at 110.08.
H4 perspective:
The aftermath of Friday’s optimistic US job’s report sent the USD higher against its Japanese counterpart, consequently reclaiming the 111 handle. From this point, traders’ crosshairs are likely fixed on August’s opening level at 111.76, as it fuses with a minor Quasimodo resistance at 111.78. What’s also attractive is the Quasimodo resistance seen at 111.96. Aside from this level merging closely with the 112 handle, the apex (112.15) of the Quasimodo formation is strengthened by the daily resistance level highlighted above at 112.11.
Areas of consideration:
Assuming buyers remain defensive above 111, a stretch up to at least August’s opening level seen on the H4 timeframe at 111.76 could be on the cards. For those interested in buying this number, waiting and seeing if H4 price can form a bullish candlestick formation could be something to consider, since not only will this inform traders that buyer intent exists here, it also provides an entry and a location to position stop-loss orders.
The H4 Quasimodo resistance level mentioned above at 111.96 is also worthy of consideration for possible shorts. Having seen daily resistance at 112.11 reinforcing the top edge of this Quasimodo formation, placing stop-loss orders above the Quasimodo apex at around 112.17ish is an option.
Today’s data points: FOMC member Bostic speaks.
USD/CAD:
Weekly Gain/Loss: +0.96%
Weekly Close: 1.3166
Weekly perspective:
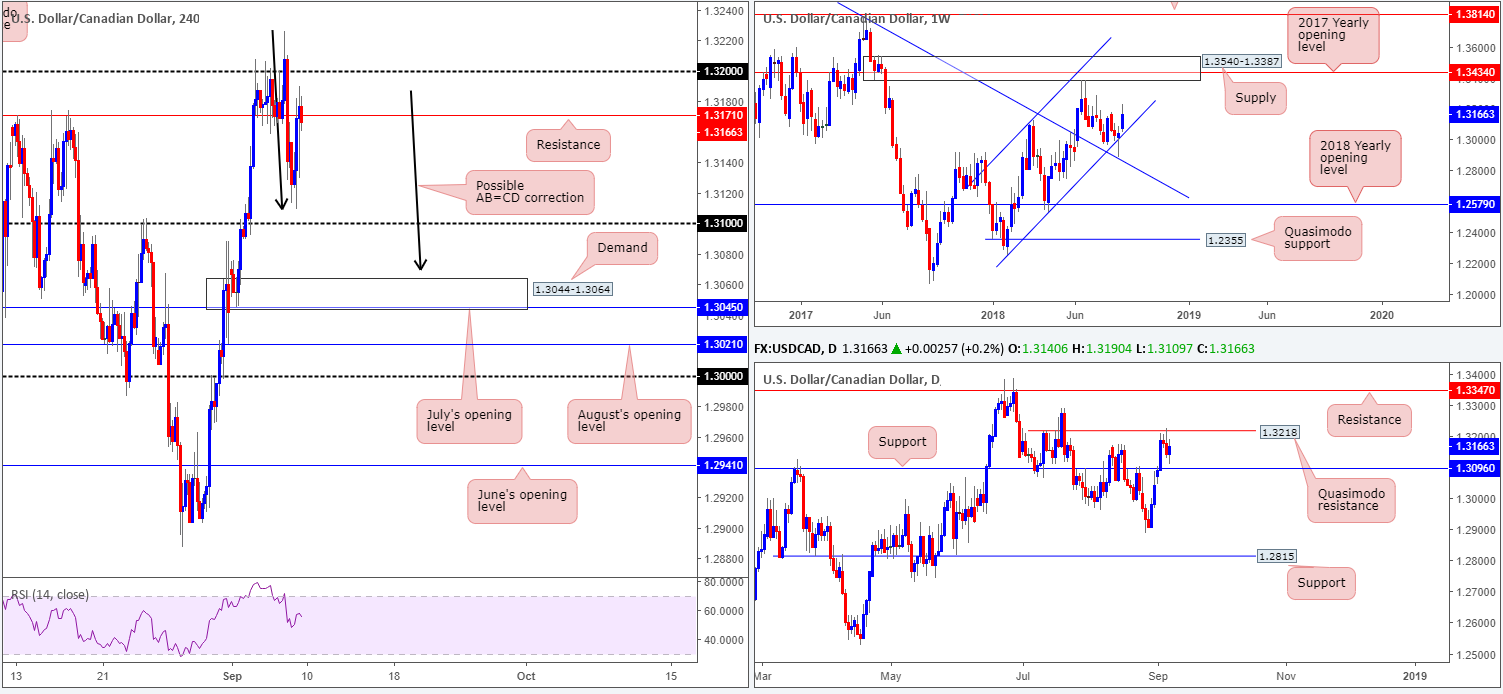
Since the beginning of the year, the USD/CAD has been compressing within an ascending channel formation (1.2247/1.3098). Of late, the market responded to the lower edge of this channel (almost crossing paths with a nearby trend line resistance-turned support [etched from the high 1.4689]), and thus far has maintained a strong bullish tone. Continued buying on this scale has the supply zone at 1.3540-1.3387 in view.
Daily perspective:
A closer look at price action on the daily timeframe shows us the pair recently elbowed into a Quasimodo resistance level drawn from 1.3218, forcing candle action to lows of 1.3109 (just north of a support level marked at 1.3096). Beyond the current Quasimodo resistance, apart from the July 20 high at 1.3289, traders may want to pencil in resistance at 1.3347 should the market decide to punch higher this week.
H4 perspective:
A quick recap of Friday’s movement on the H4 timeframe shows the USD/CAD advanced in response to dismal employment numbers out of Canada and an upbeat non-farm payrolls report from the US. The move, however, was a relatively short-lived one as the market pared its gains in the next hour, though did manage to conclude the day in positive territory.
In terms of the technical picture, the loonie failed to reach the 1.32 handle before closing the day marginally beneath 1.3171 (an acting resistance). Beneath this level, the 1.31 handle is in view, as is the demand area coming in at 1.3044-1.3064.
Areas of consideration:
In a nutshell, the structure of this market can be boiled down to the following:
- Weekly price suggests additional upside could be seen as we’re coming from the lower edge of its long-term channel.
- Daily price is encased between a Quasimodo resistance level and a nearby support band, and is, therefore, labelled ‘directionless’ at the moment.
- H4 price closed beneath resistance, indicating further selling is possibly in the offing today/early this week.
With this in mind, we feel the best course of action is to pencil in a few notable areas on the H4 scale and watch how H4 price action responds before making a trading decision, as attempting to judge which level will work over another is particularly difficult when the higher-timeframes show division.
- The 1.31 handle is worthy of note for possible longs, seeing as daily support at 1.3096 is positioned just beneath it.
- Demand at 1.3044-1.3064 is also likely of interest to buyers. Note this area houses July’s opening level at 1.3045 and is located just beneath a possible AB=CD correction point (black arrows) at 1.3069.
- The 1.32 handle is attractive for shorts, though traders need to prepare for the possibility of a fakeout above this level to the daily Quasimodo resistance mentioned above at 1.3218.
Today’s data points: FOMC member Bostic speaks.
USD/CHF:
Weekly Gain/Loss: +0.03%
Weekly Close: 0.9688
Weekly perspective:
Over the course of last week’s sessions, the market observed a firm retest to the underside of the 2018 yearly opening level at 0.9744. With limited support on this scale until reaching the 0.9443-0.9515 area, further downside could be in store!
Daily perspective:
Focusing the spotlight on the daily timeframe, the pair took out the August 31 low at 0.9652 in the later stages of last week, though failed to test nearby demand at 0.9577-0.9637 (fuses with a 50.0% support value at 0.9627 [green line]). The next upside targets from current price fall in around the September 4 high at 0.9767, shadowed closely by a swing resistance at 0.9788.
H4 perspective:
For those who read Friday’s briefing you may recall we underlined 0.9637/0.9642 as a possible buy zone (0.9637 represents the top edge of daily demand and 0.9642 denotes a H4 support level). Well done to any of our readers who managed to pin down a position off of this area, as the unit ended the session connecting with the underside of 0.97 on the back of strong US job’s numbers.
Areas of consideration:
Seeing as weekly price is coming from the underside of a resistance level at the moment with plenty of room to press lower, the chances of this market advancing much higher are slim, in our humble view. We’d be surprised to see the daily resistance mentioned above at 0.9788 taken out.
Is 0.97 a suitable platform for shorts then? It could work out, though for the higher-probability setup we feel the H4 supply at 0.9776-0.9762 is the place to be. Not only is it a proven area, it also converges with the September 4 high at 0.9767 highlighted on the daily timeframe and is positioned just above the weekly resistance level at 0.9744. A nice-looking H4 bearish candlestick formation printed from the current H4 supply is, according to the overall technical picture, considered a high-probability sell this week.
Today’s data points: FOMC member Bostic speaks.

Dow Jones Industrial Average:
Weekly Gain/Loss: -0.35%
Weekly Close: 25944
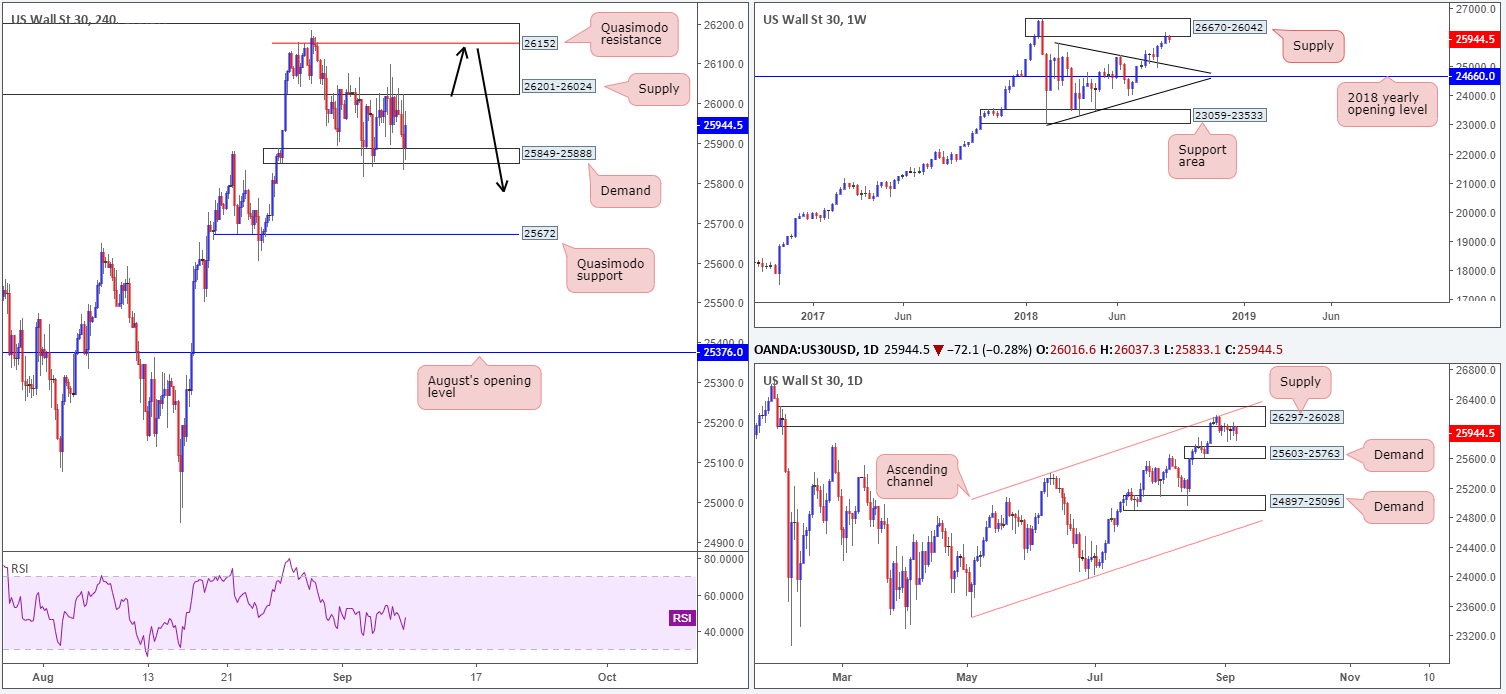
Weekly perspective:
US equities ended last week breaking a three-week bullish phase after price engaged with the lower edge of a supply at 26670-26042, following a strong retest off a trend line resistance-turned support (etched from the high 25807) a few weeks back.
Daily perspective:
In terms of the daily timeframe, strong supply at 26297-26028 remains in the fold. What gives this area credibility comes down to the following:
- Downside momentum drawn from the base is incredibly strong.
- The zone intersects with a nearby daily channel resistance (taken from the high 25399).
- Glued to the underside of the aforesaid weekly supply area.
H4 perspective:
H4 price continues to loiter between a rather large supply area at 26201-26024 and a demand base coming in at 25849-25888. Also worth noting is the current demand was taken out again on Friday, potentially clearing the path south towards the Quasimodo support level at 25672.
Areas of consideration:
As the current H4 supply at 26201-26024 is enormous, entering short from the H4 Quasimodo resistance level seen within the upper limits of the area at 26152 could be something to consider this week (see black arrows). This gives traders the option of positioning stops above the overall H4 supply (while keeping risk/reward in check), targeting the H4 demand area mentioned above at 25849-25888 as the initial take-profit zone, followed then by the top edge of daily demand at 25603-25763 (next downside target on the daily scale) and then the aforementioned H4 Quasimodo support level.
Today’s data points: FOMC member Bostic speaks.
XAU/USD (Gold)
Weekly Gain/Loss: -0.42%
Weekly Close: 1196.4
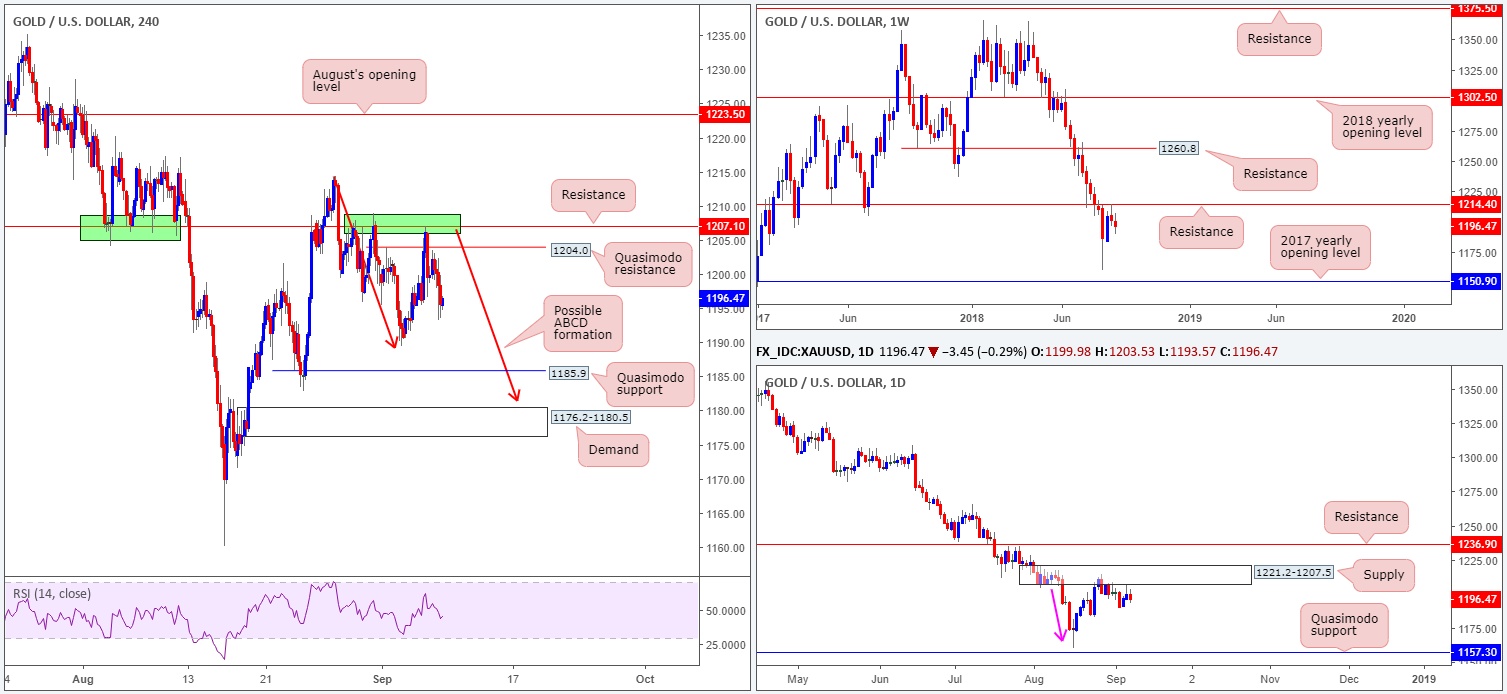
Weekly perspective:
Registering its second consecutive weekly loss, the yellow metal remains in negative territory beneath resistance marked at 1214.4. Further downside from this point could eventually stretch as far south as the 2017 yearly opening level at 1150.9.
Daily perspective:
In conjunction with weekly flow, daily movement is seen checking in with a nice-looking supply zone at 1221.2-1207.5. Aside from this zone displaying attractive downside momentum from its base (see pink arrow), it could be considered the ‘decision point’ to print 2018 yearly lows of 1160.3. Couple this with the fact we are also coming off weekly resistance, we potentially have ourselves some strong sellers in the mix.
H4 perspective:
The after-effects of Friday’s better-than-expected US non-farm payrolls report for August drove bullion to lows of 1193.2 as the USD received a strong bid which helped the DXY conquer 95.00. In the event the H4 candles search for lower levels today, the September 4 low at 1189.4 is the next base of support to keep an eye on, followed closely by a Quasimodo support at 1185.9. Another notable point on this scale is the possible completion of an ABCD formation (see red arrows) at 1181.3, sited just north of a demand area penciled in at 1176.2-1180.5.
Areas of consideration:
According to the higher-timeframe picture, we feel this market is eyeing lower prices. Longer term, the daily Quasimodo support at 1157.3 is a logical target, followed closely by the 2017 yearly opening level at 1150.9 on the weekly timeframe.
Intraday, a retest to the underside of the H4 Quasimodo resistance level at 1204.0 is interesting, as is a retest of the resistance level seen directly above this base at 1207.2 (in line with the underside of daily supply mentioned above at 1221.2-1207.5). A H4 bearish candlestick formation printed off of either one of these levels is a high-probability shorting opportunity (stop-loss orders should be positioned in line with the candle pattern seen), when taking into account the overall technical picture. As for take-profit targets, the H4 supports mentioned above in bold are an option.
The use of the site is agreement that the site is for informational and educational purposes only and does not constitute advice in any form in the furtherance of any trade or trading decisions.
The accuracy, completeness and timeliness of the information contained on this site cannot be guaranteed. IC Markets does not warranty, guarantee or make any representations, or assume any liability with regard to financial results based on the use of the information in the site.
News, views, opinions, recommendations and other information obtained from sources outside of www.icmarkets.com.au, used in this site are believed to be reliable, but we cannot guarantee their accuracy or completeness. All such information is subject to change at any time without notice. IC Markets assumes no responsibility for the content of any linked site. The fact that such links may exist does not indicate approval or endorsement of any material contained on any linked site.
IC Markets is not liable for any harm caused by the transmission, through accessing the services or information on this site, of a computer virus, or other computer code or programming device that might be used to access, delete, damage, disable, disrupt or otherwise impede in any manner, the operation of the site or of any user’s software, hardware, data or property.


