
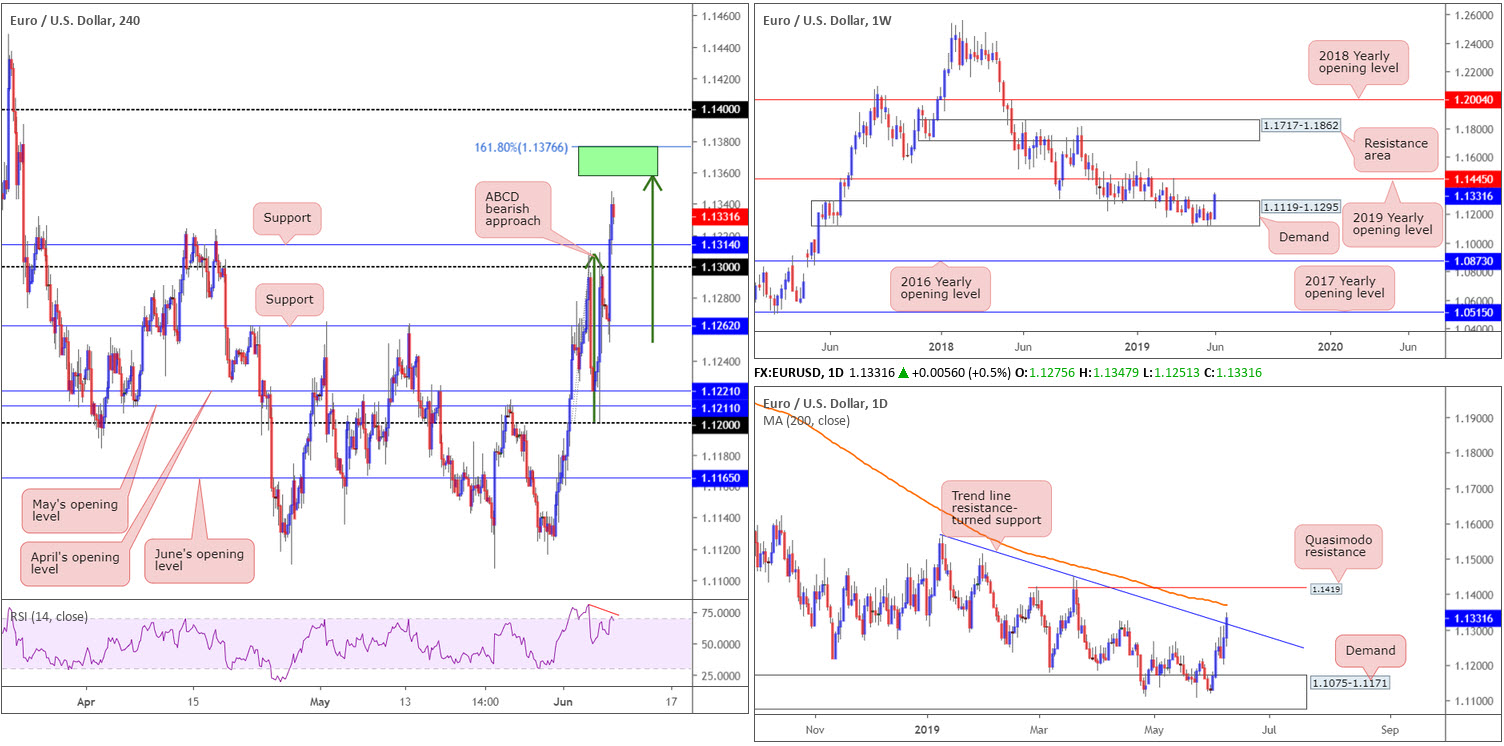
EUR/USD:
Weekly gain/loss: +1.46%
Weekly close: 1.1331
Weekly perspective:
EUR/USD entered into an offensive phase over the past week, tallying more than 160 points out of a long-standing demand area coming in at 1.1119-1.1295.
Despite the overall trend still facing a southerly bearing since topping in early 2018, the recently formed near-full-bodied bull candle displays scope for extension to as far north as the 2019 yearly opening level at 1.1445.
Daily perspective:
After establishing solid ground from demand at 1.1075-1.1171 (glued to the underside of the current weekly demand), price action eventually peaked above a trend line resistance extended from the high 1.1569 at the closing stages of the week. Having seen weekly movement eyeing higher ground, it is likely price may head for its 200-day SMA (trading around 1.1370), closely shadowed by Quasimodo resistance pencilled in at 1.1419.
H4 perspective:
Total nonfarm payroll employment edged up in May (+75,000); the unemployment rate remained at 3.6% and average hourly earnings also ticked lower by 0.2% vs. expected 0.3%, the US Bureau of Labour Statistics reported Friday. In addition, both the labour force participation rate, at 62.8%, and the employment-population ratio, at 60.6%, were unchanged in May.
The dollar hit fresh weekly and multi-month lows in wake of the substandard US jobs data, concluding Friday a few points north of 96.50 (dollar index). In response, the EUR/USD pairing rose higher, breaching a number of tops and clocking a fresh monthly high of 1.1348.
Areas of consideration:
Having seen the unit advance in the shape of a near-complete H4 161.8% ABCD bearish formation (green arrows), terminating around the 1.1376/1.1360 region (green zone), which also happens to align with the 200-day SMA on the daily timeframe, a bounce lower from here, if tested, towards H4 support at 1.1314 is likely to be seen this week.
Cautionary points to consider, however, are a possible fakeout to the 1.14 handle plotted on the H4 scale, and also weekly activity threatening a move to 1.1445. In light of this, traders are urged to consider waiting for additional confirmation before pulling the trigger. This could be as simple as a H4 bearish candlestick configuration or a lower-timeframe MA crossover.
In the event we turn lower prior to testing 1.1376/1.1360, a long from the H4 support highlighted above at 1.1314, along with its closely aligned round number 1.13, may be an idea, as this area combines with the recently broken daily trend line resistance, thus now potential support. Again, though, waiting for additional confirmation is recommended, as psychological levels tend to entice fakeouts, also known as ‘stop runs’.
Today’s data points: Major European banks are closed in observance of Whit Monday.
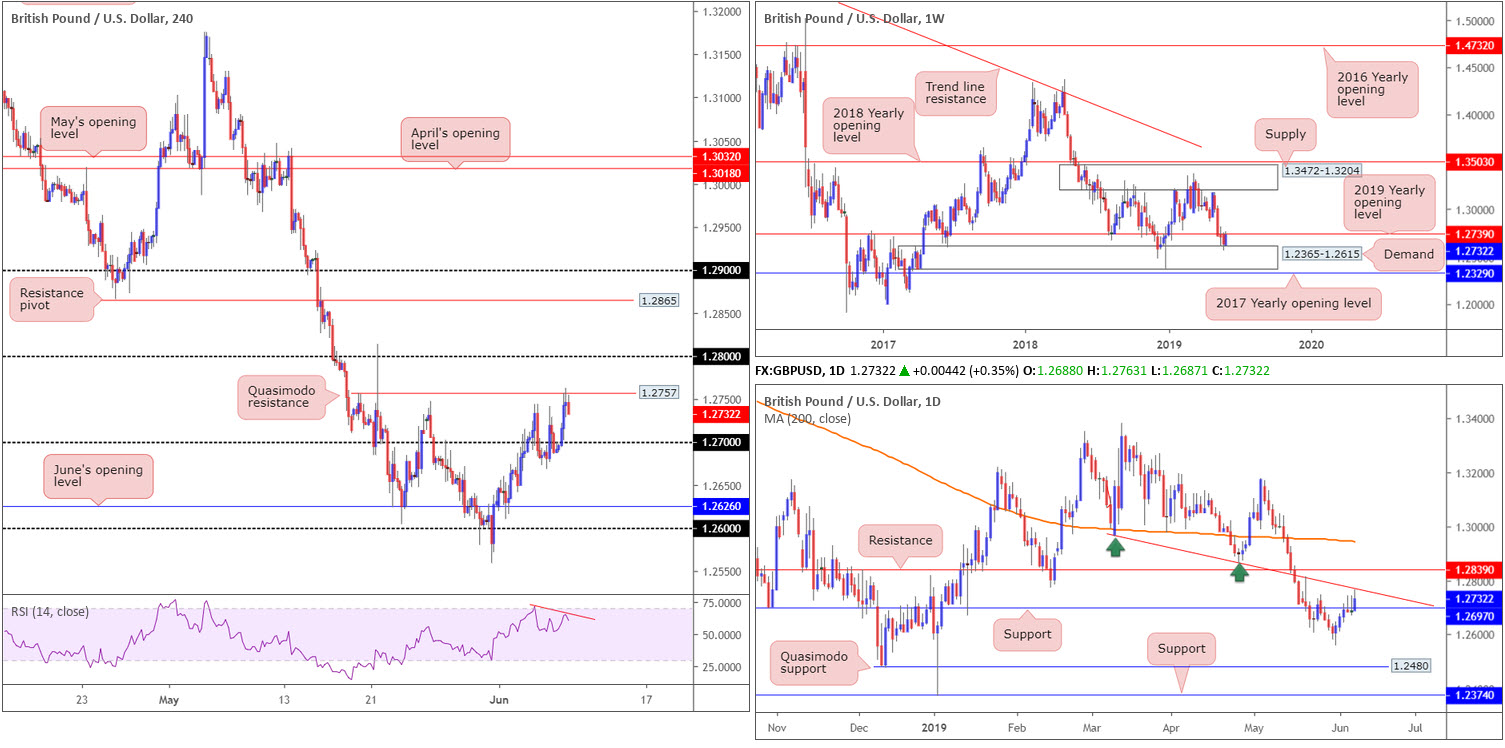
GBP/USD:
Weekly gain/loss: +0.80%
Weekly close: 1.2732
Weekly perspective:
Breaking a four-week bearish phase, sterling added more than 100 points last week. Strengthened by a long-term demand area at 1.2365-1.2615, the recent candle erased the prior week’s losses and crossed swords with resistance by way of the 2019 yearly opening level at 1.2739.
As long as the buyers remain in the driving seat this week and dethrone 1.2739, the next obvious upside hurdle doesn’t enter the fold until supply at 1.3472-1.3204.
Daily perspective:
The key observation on the daily timeframe is the break of resistance at 1.2697, now acting support. Although this aligns favourably with the move out of weekly demand highlighted above at 1.2365-1.2615, daily players have to contend with potential resistance emerging from a trend line support-turned resistance taken from the low 1.2960, followed by a resistance level drawn from 1.2839.
H4 perspective:
In response to Friday’s disappointing US job’s figures, the H4 candles approached Quasimodo resistance at 1.2757 and produced a reasonably eye-catching bearish close. Technically speaking, this, along with both weekly and daily structure testing resistances and the H4 RSI indicator currently chalking up negative divergence (red line), could be sufficient to entice sellers into the market today and challenge the 1.27 handle. It might also be worth noting that 1.27 converges closely with daily support underlined above at 1.2697.
Areas of consideration:
Short-term sellers, assuming we open near last week’s close, have the option of selling towards the 1.27 neighbourhood in the early hours today. Although this is considered a high-probability move, given the higher-timeframe picture, traders are urged to ensure risk/reward offers a favourable setting to 1.27 before pulling the trigger. Also, do keep in mind that 1.27 represents daily support at 1.2697, so expecting much beyond here is difficult at this stage.
In terms of a medium-term projection, it is a difficult read as both weekly and daily timeframes exhibit somewhat restricted trading conditions at the moment.
Today’s data points: UK GDP m/m; UK Manufacturing Production m/m.
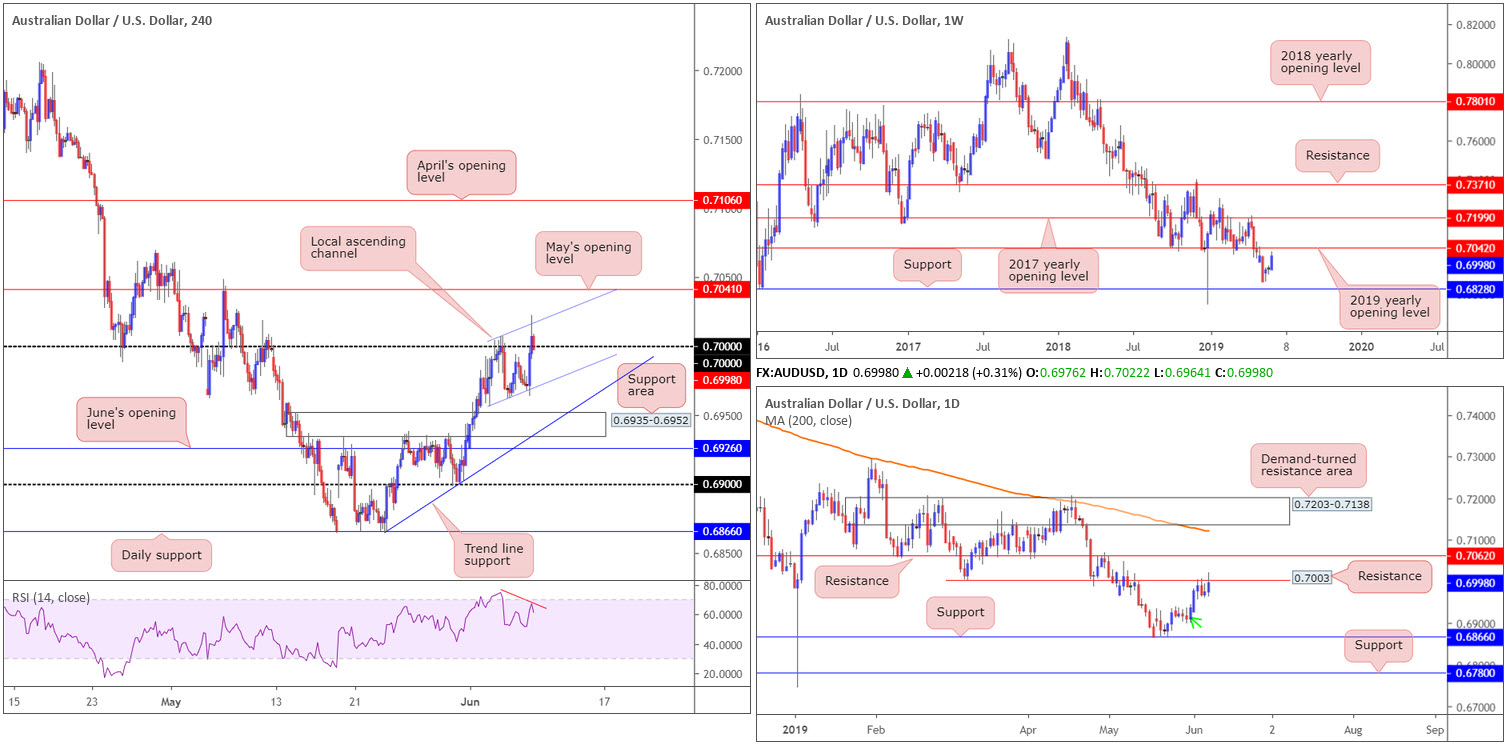
AUD/USD:
Weekly gain/loss: +0.90%
Weekly close: 0.6998
Weekly perspective:
According to the market’s technical position on the weekly timeframe, recent bidding has positioned the unit within striking distance of resistance by way of the 2019 yearly opening level at 0.7042. Aside from the runaway move to a low of 0.6744 in early January, this level remains a superior barrier to have on the watch list this week.
Daily perspective:
Apart from Monday’s upsurge, largely derived on the back of better-than-expected Caixin PMI data out of China, and speculations of a Fed rate cut, the daily candles spent the remainder of the week hugging the underside of resistance pencilled in at 0.7003.
Continued rejection from 0.7003 may eventually target demand marked with a green arrow around the 0.6935ish region. However, seeing as this area failed to produce much upside momentum from its base, this limits its position somewhat and may give way to support at 0.6866. In the event we push higher, nevertheless, resistance enters the fight around 0.7062.
H4 perspective:
Friday witnessed the AUD/USD’s H4 candles surge higher in response to the dismal US monthly jobs report, though struggled to extend beyond the key 0.70 psychological mark. Although the unit pressed to a high of 0.7022, likely tripping a large portion of buy stops, price action finished the week just south of 0.70.
Surrounding 0.70, the research team notes a local ascending channel formation (0.6956/0.7007). Outside of these borders, we also have May’s opening level offering potential resistance at 0.7041 and a support area coming in at 0.6935-0.6952, closely shadowed by June’s opening level at 0.6926.
Areas of consideration:
In terms of H4 structure, sellers are struggling to prove their worth from 0.70. Unable to engulf the local channel support and also probing to highs of 0.7022, emphasises a mild bullish tone, according to our technical studies.
Longer-term flow, nevertheless, has weekly price suggesting a move towards 0.7042, though only if price overthrows daily resistance at 0.7003.
On account of the above, high-probability selling opportunities this week likely reside around May’s opening level at 0.7041, which happens to merge closely with the 2019 yearly opening level on the weekly timeframe at 0.7042.
Selling from 0.70 is, of course, still an option given daily resistance at 0.7003, though in light of H4 structure hitting fresh highs along with limited space to manoeuvre lower (channel formation), it is not considered a high-probability move.
Today’s data points: China Trade Balance.
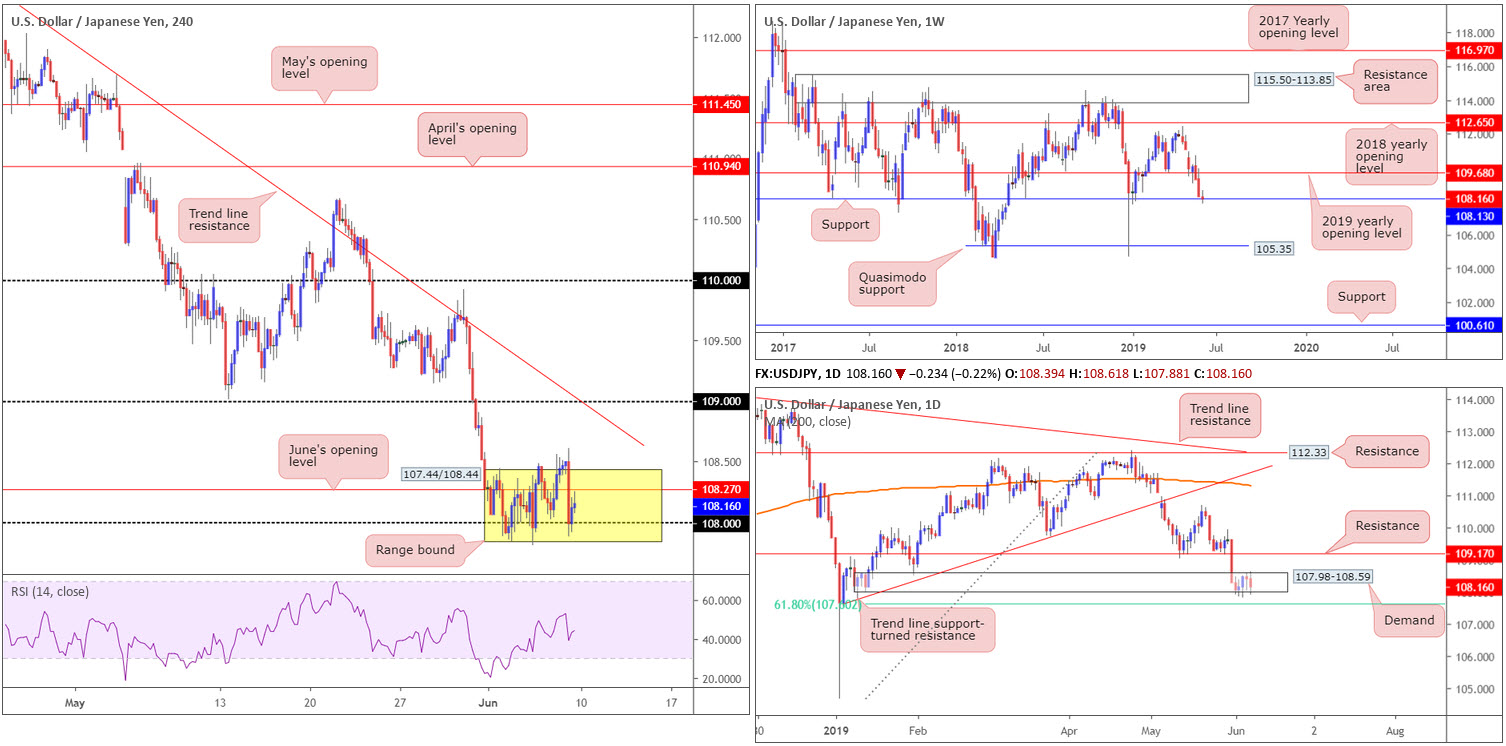
USD/JPY:
Weekly gain/loss: -0.11%
Weekly close: 108.16
Weekly perspective:
Following a recent retest to the underside of the 2019 yearly opening level at 109.68, the USD/JPY shook hands with nearby support at 108.13 last week and produced an indecision candle, albeit with a slight inflection to the downside.
Having seen a lack of enthusiasm from 108.13, traders may want to acknowledge Quasimodo support at 105.35 in the event we press for lower ground in the weeks to come.
Daily perspective:
Demand at 107.98-108.59, as is evident from the daily timeframe, is struggling to maintain a presence, particularly following Friday’s bearish engulfing pattern. Despite boasting a connection to weekly support mentioned above at 108.13, the odds of daily price rushing the lower edge of the said demand this week is high, targeting a 61.8% Fibonacci support value at 107.60.
In addition to the above, resistance at 109.17 may also be of interest to some traders should buyers enter the fold this week. Having seen this level serve well as support, the likelihood of a reaction as resistance is high.
H4 perspective:
The USD/JPY severed more than 50 points in a matter of minutes and chopped through the 108 handle as the buck came under heavy selling pressure following disappointing labour data out of the US. Despite a brief spell sub 108, however, price action swiftly reclaimed the number and advanced to a high of 108.25, just south of June’s opening level priced in at 108.27.
Areas of consideration:
Even though H4 action is defending 108 as support, the lack of enthusiasm from the buyers here is troubling, consequently forming a consolidation at 107.44/108.44 (yellow). Couple this with weekly price displaying signs of indecision around weekly support at 108.13 and daily demand hanging on by a thread at 107.98-108.59, the pendulum appears to be swinging in favour of sellers at this time.
In view of the above, selling beneath 108 is in focus this week. Assuming a H4 close forms sub 108 that’s followed up with a retest (preferably in the shape of a bearish candlestick formation – entry and risk can be determined according to this structure), the H4 timeframe shows room to press as far south as 107. While this may be the case, however, support on the daily timeframe could still emerge from 107.60, therefore do ensure to factor this in from a risk/reward standpoint before initiating a position.
Today’s data points: Limited.
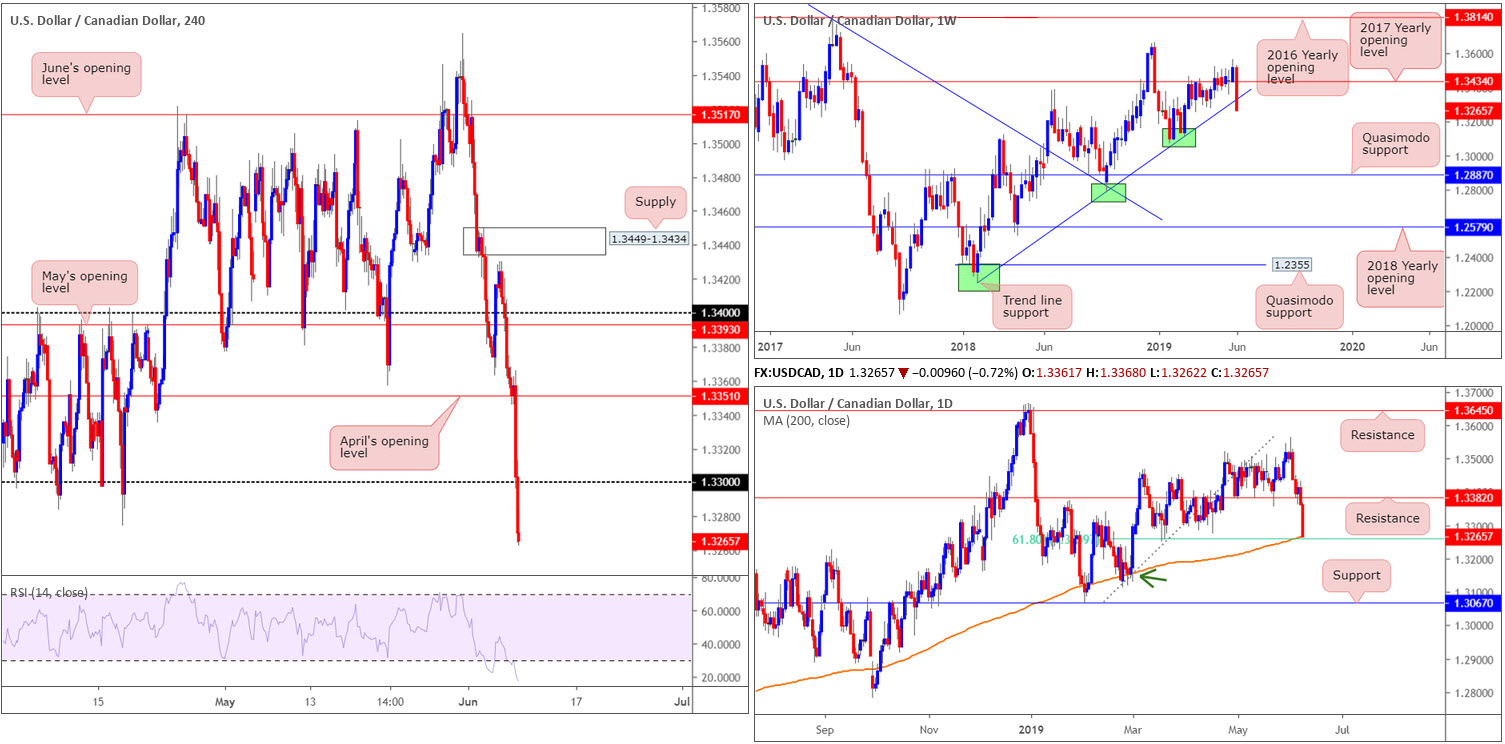
USD/CAD:
Weekly gain/loss: -1.85%
Weekly close: 1.3265
Weekly perspective:
In the mould of a near-full-bodied bearish candle, USD/CAD action severed more than 240 points last week and engulfed a long-standing trend line support extended from the low 1.2247. The break of this trend line formation is significant, given the length of time this barrier has been in motion. Therefore, a move to the 1.3068 Jan 28 2019 low could be in store. By the same token, though, traders should also prepare for the possibility of a retest of the recently broken trend line support, prior to a move lower.
Daily perspective:
Thanks to recent selling, the daily candles dethroned support at 1.3382 (now acting resistance) and crossed paths with its 200-day SMA. What’s also notable from a technical perspective is the merging 61.8% Fibonacci support value at 1.3260, and thus could offer a platform for buyers to enter the fray this week.
Failure of 1.3260 has potential demand arising from 1.3166ish (green arrow), closely shadowed by a reasonably attractive support emerging from 1.3067.
H4 perspective:
Canada’s considerably better-than-forecast payrolls print and unemployment rate, along with disappointing labour data out of the US, sent the H4 candles lower Friday, down 0.72%.
With 1.33 now a distant memory, the next port of call to the downside on the H4 scale falls in around the 1.32 handle, followed by a Quasimodo support level coming in at 1.3150 (not visible on the screen).
Areas of consideration:
In H4 terms, a retest to the underside of 1.33 appears a reasonable possibility this week, with the expectation of a move lower. This is further bolstered by the weekly timeframe’s position below trend line support. However, seeing daily price testing reasonably strong support around 1.3260ish, we could potentially overthrow 1.33 and head for April’s opening level on the H4 timeframe at 1.3315.
On the other hand, traders who feel the daily 200-day SMA combination with 61.8% Fib support at 1.3260 is enough to draw in buyers, the next upside target on this scale is resistance at 1.3382. Folks concerned by the recent break of weekly trend line support, however, might opt to wait and see if daily action prints a bullish candlestick pattern before pulling the trigger. This not only helps identify buyer intent, it also provides traders entry and risk levels to work with.
Today’s data points: Limited.
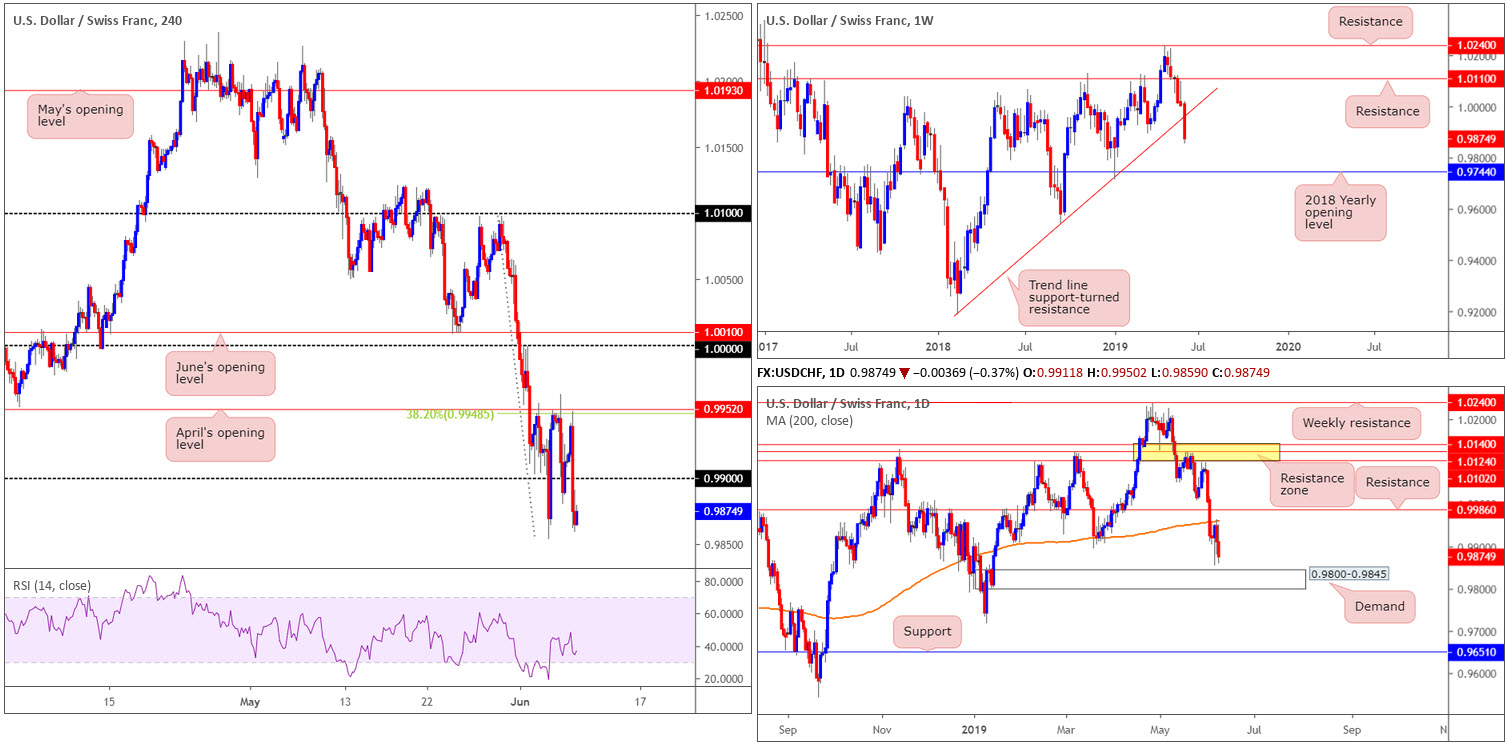
USD/CHF:
Weekly gain/loss: -1.31%
Weekly close: 0.9874
Weekly perspective:
The greenback’s retreat against the Swiss franc from the 2019 high 1.0236 set towards the end of May continued last week, strengthening its position beneath resistance at 1.0110, and now beyond trend line support (etched from the low 0.9187). The break of this long-standing trend line has traders’ crosshairs likely fixed on possible support derived from the 2018 yearly opening level at 0.9744 this week.
Daily perspective:
Over the course of last week, daily players found a ceiling off its 200-day SMA around 0.9960, and appears poised to approach nearby demand posted at 0.9800-0.9845.
H4 perspective:
The aftermath of Friday’s second-rate US job’s numbers sent the US dollar southbound across the board, consequently hauling the USD/CHF sub 0.99 from April’s opening level at 0.9952 and a 38.2% Fibonacci resistance value at 0.9948. If the H4 candles remain positioned beneath 0.99 this week, Quasimodo support at 0.9814 is in sight as the next viable floor this week (not seen on the screen), which is located within the lower boundary of daily demand coming in at 0.9800-0.9845.
Areas of consideration:
Having witnessed weekly price engulf trend line support and potentially unlock the path lower for further downside, a retest of 0.99 as resistance could be something to keep an eye open for this week, targeting the top edge of daily demand at 0.9845. Remember within this area we also hold the H4 Quasimodo support at 0.9814.
In order to avoid being taken out on a whipsaw above 0.99 (fakeouts are common viewing around psychological numbers), traders are urged to allow price action to prove itself before committing. This could be anything from a H4 bearish candlestick configuration, a lower-timeframe MA crossover or even drilling down to the lower timeframes and attempting to trade local (price action) structure from 0.99.
Today’s data points: Swiss banks are closed in observance of Whit Monday.
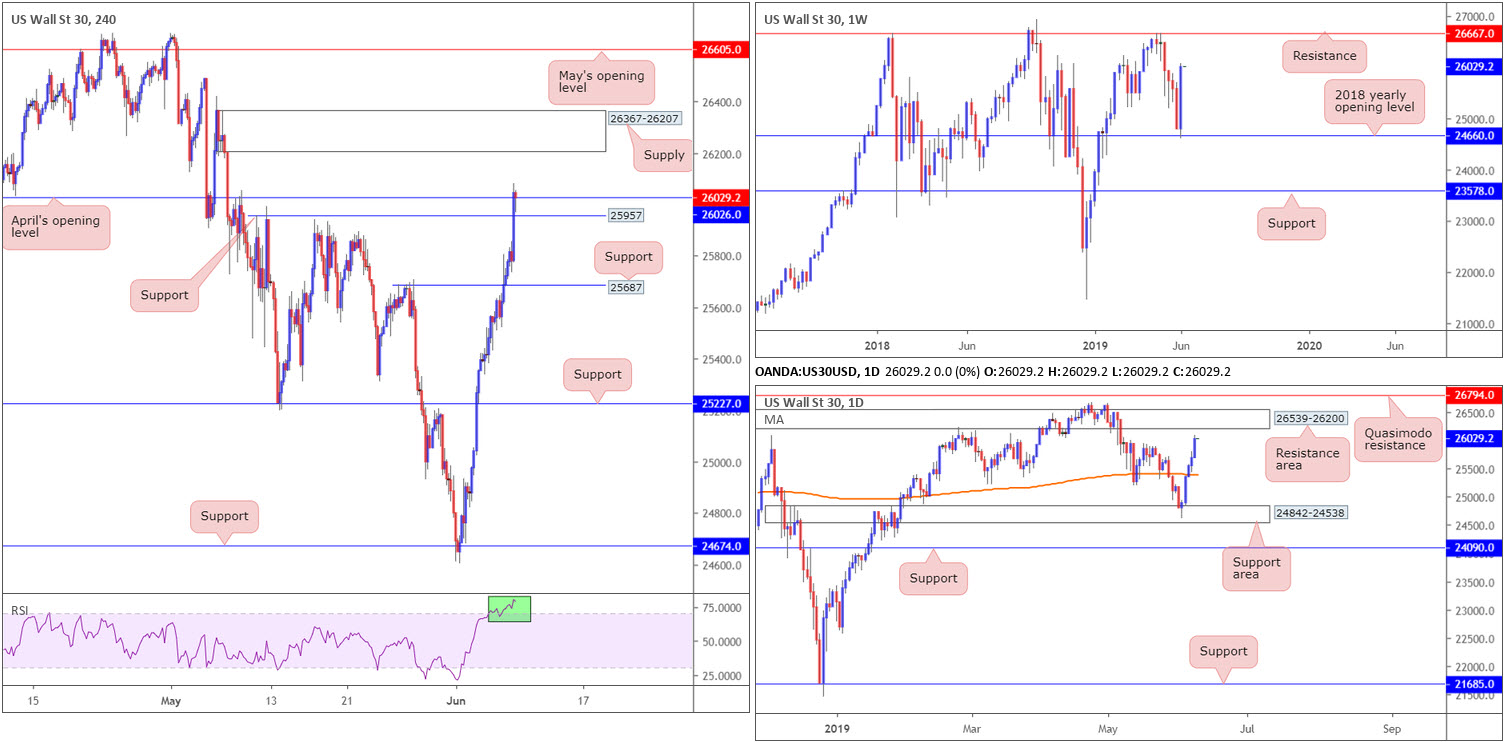
Dow Jones Industrial Average:
Weekly gain/loss: +4.95%
Weekly close: 26029
Weekly perspective:
In robust fashion, US equities snapped back more than three weeks’ worth of losses last week off its 2018 yearly opening level at 24660, consequently producing a bullish engulfing pattern. Additional upside from this point has resistance in view at 26667 this week.
Daily perspective:
The run higher last week managed to overwhelm sellers around the 200-day SMA and conclude within touching distance of an attractive resistance area coming in at 26539-26200. Although weekly structure suggests price action may be headed for resistance at 26667, the odds of a reaction emerging from here beforehand are extremely high, according to our technical studies.
H4 perspective:
US equities advanced across the board Friday amid weak economic data, boosting the odds the Fed will cut rates. Total nonfarm payroll employment edged up in May (+75,000); the unemployment rate remained at 3.6% and average hourly earnings ticked lower by 0.2% vs. expected 0.3%, according to the US Bureau of Labour Statistics.
The Dow Jones Industrial Average closed 339 points higher, or 1.32%; the S&P 500 also gained 1.05%, along with the tech-heavy Nasdaq 100 advancing 1.94%.
Speaking from a technical standpoint, the research team notes H4 action closed around April’s opening level at 26026, after marginally punching to a session high of 26081. Overhead, traders may wish to acknowledge fresh supply drawn from 26367-26207, which converges with the lower edge of the daily resistance area mentioned above at 26539-26200, and also comes with RSI overbought confirmation (green).
Areas of consideration:
Focus, at least in the earlier stages of the week, will likely be around the aforementioned daily resistance area, more specifically the H4 supply zone at 26367-26207 for potential shorting opportunities. Ultimately it would be ideal to identify some form of bearish confirmation before pulling the trigger, such as a bearish candlestick configuration. In terms of take-profit targets, April’s opening level at 26026 as well as H4 support at 25957 are the next logical floors in view. Beyond here, H4 support at 25687 is next in the firing range.
Today’s data points: Limited.
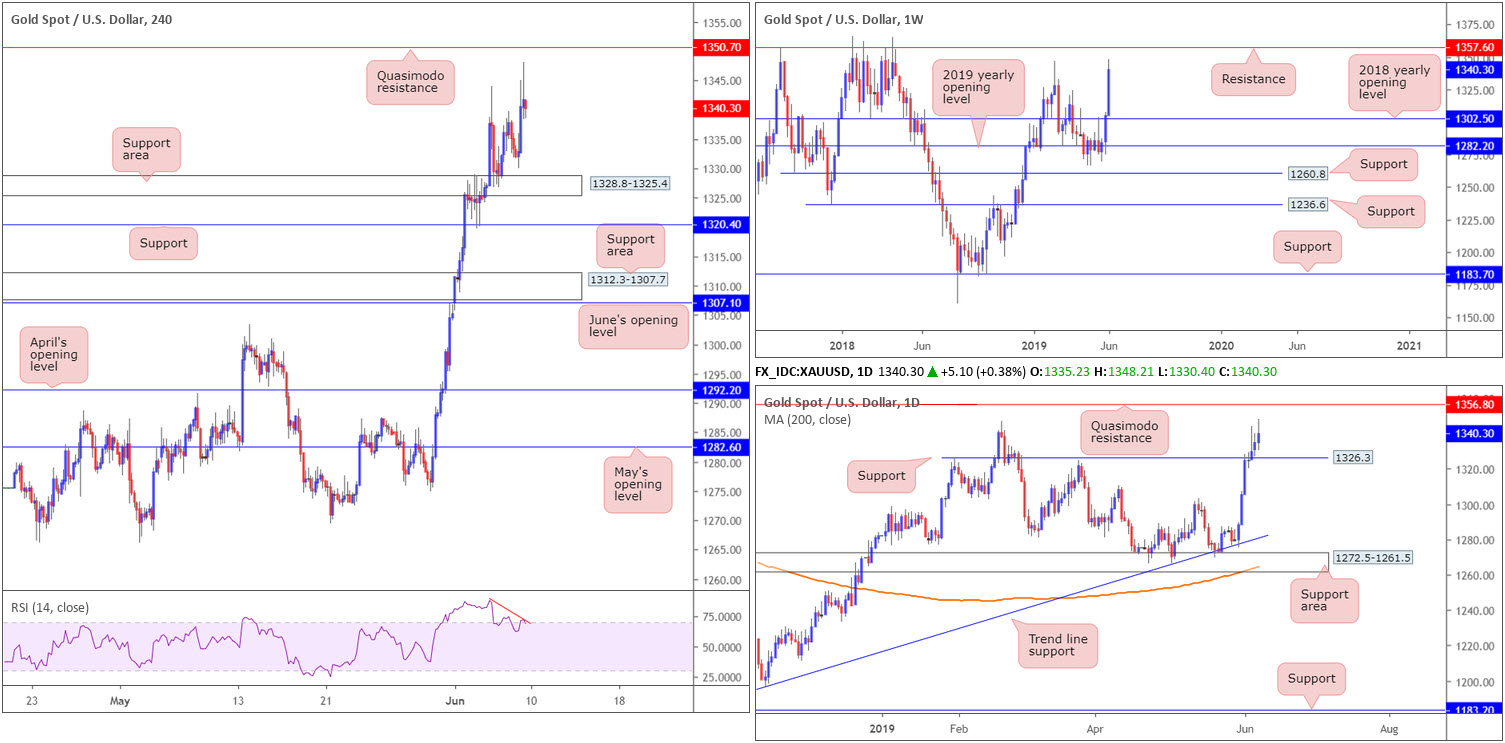
XAU/USD (GOLD):
Weekly gain/loss: +2.69%
Weekly close: 1340.3
Weekly perspective:
XAU/USD enjoyed another successful week, recording its third consecutive weekly gain and adding more than $35 as price concludes shaking hands with the 1346.7 Feb 18 high.
Overhead, technicians likely have their eyes on resistance coming in at 1357.6, whereas to the downside the next logical support resides around the 2018 yearly opening level at 1302.5.
Daily perspective:
After taking out Quasimodo resistance at 1326.3 in the early stages of last week, the yellow metal appears poised to approach Quasimodo resistance at 1356.8 – that is assuming the unit overthrows the 1346.7 Feb 18 high mentioned above on the weekly timeframe.
Areas to keep an eye on this week on this scale then fall in around support at 1326.3 and Quasimodo resistance at 1356.8.
H4 perspective:
Demand for the metal increased Friday amid lower-than-expected US job’s numbers, forcing the H4 candles towards a high of 1348.2. The next upside target on this timeframe can be seen around Quasimodo resistance at 1350.7. However, it is worth noting the recent advance came about on low momentum according to the RSI indicator: negative divergence (red line).
Areas of consideration:
With upside momentum seemingly slowing, the research team favours the area between 1357.6 and 1350.7 for potential selling opportunities this week (comprised of the weekly resistance level, the daily Quasimodo resistance level and also the H4 Quasimodo resistance level).
As 1357.6/1350.7 is somewhat small in range, traders are recommended to wait for additional confirmation before committing funds. As highlighted in other markets, this could be anything from a H4 bearish candlestick configuration, a lower-timeframe MA crossover or even drilling down to the lower timeframes and attempting to trade local (price action) structure within the zone.
The accuracy, completeness and timeliness of the information contained on this site cannot be guaranteed. IC Markets does not warranty, guarantee or make any representations, or assume any liability with regard to financial results based on the use of the information in the site.
News, views, opinions, recommendations and other information obtained from sources outside of www.icmarkets.com.au, used in this site are believed to be reliable, but we cannot guarantee their accuracy or completeness. All such information is subject to change at any time without notice. IC Markets assumes no responsibility for the content of any linked site. The fact that such links may exist does not indicate approval or endorsement of any material contained on any linked site.
IC Markets is not liable for any harm caused by the transmission, through accessing the services or information on this site, of a computer virus, or other computer code or programming device that might be used to access, delete, damage, disable, disrupt or otherwise impede in any manner, the operation of the site or of any user’s software, hardware, data or property.


