
DXY:
The DXY (US Dollar Index) chart currently demonstrates a bearish momentum, indicating a downward bias in the market. This is supported by the price being below a major descending trend line, which suggests the potential continuation of the bearish trend.
There is a possibility for a bearish reaction off the first resistance level, indicating a potential area where selling pressure could increase. This resistance level, located at 103.44, is considered significant as it represents an overlap resistance. If the price fails to break above this level, it could signal the continuation of the bearish trend.
In the event of a bearish continuation, the price may drop towards an intermediate support level at 102.11. This level is important to monitor as it could potentially act as a temporary support zone, slowing down the downward momentum.
On the downside, there is a first support zone between 100.80 and 101.30. This support zone is of particular interest as it aligns with the 61.80% and 78.60% Fibonacci Projection levels, adding to its significance. A break below the intermediate support level at 102.11 could trigger a move towards this support zone.
Furthermore, the second support level at 99.51 serves as an additional area of support. This level acts as an overlap support and also coincides with the 100.00% Fibonacci Projection level, enhancing its importance.

EUR/USD:
The EUR/USD chart currently exhibits a weak bullish momentum with low confidence, suggesting a potential upward movement in the market. However, caution is advised due to the lack of strong conviction in the bullish trend.
There is a possibility for a bullish continuation towards the first resistance level at 1.1072. This level represents a multi-swing high resistance and coincides with a 78.60% Fibonacci Projection, making it a significant barrier for further price advancement. Furthermore, the second resistance level at 1.1158 is an overlap resistance, suggesting a significant barrier.
On the downside, the first support level at 1.0683 is considered a good level of support. It represents a multi-swing low support and aligns with a 78.60% Fibonacci Projection. This level may act as a potential area of price support.
Additionally, the second support level at 1.0525 is an overlap support that also aligns with a 100% Fibonacci Projection, further reinforcing its significance as a level of potential downside support.

EUR/JPY:
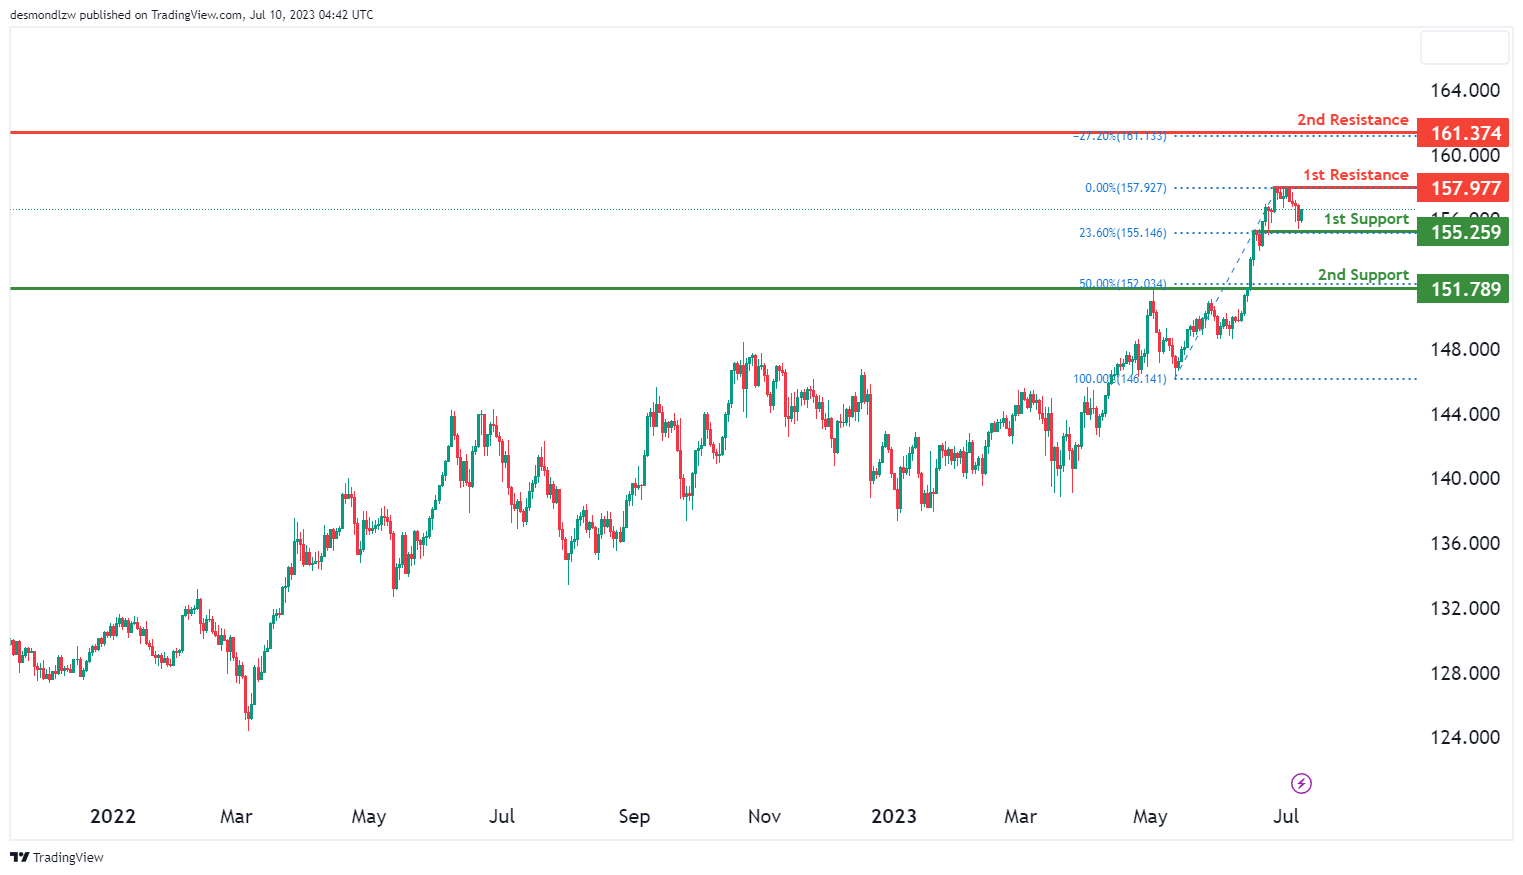
The EUR/JPY instrument is currently demonstrating a strong bullish overall momentum, indicating a potential continuation of the upward movement in the market.
There is a possibility for the price to continue its bullish trajectory towards the first resistance level located at 157.98. This resistance level holds significant importance as it has previously acted as a barrier to price advancement during multiple swings, suggesting that it may offer resistance once again.
On the support side, the first support level at 155.26 is considered strong and robust. It also serves as a pullback support. Additionally, this support level aligns with a 23.60% Fibonacci Retracement, further enhancing its significance as a potential area of price support.
Furthermore, the second support level at 151.79 is viewed as robust due to its characteristics as an overlap support and a 50% Fibonacci Retracement. Together, these factors reinforce the strength of the support level.
On the resistance side, the second resistance level at 161.37 stands out as noteworthy as it is an overlap resistance that aligns with a -27% Fibonacci Expansion level, which can pose a considerable challenge to the upward movement.
EUR/GBP:
The EUR/GBP chart currently exhibits a strong bullish overall momentum, indicating a potential continuation of the upward movement in the market.
There is a plausible scenario where the price might follow a bullish continuation towards the first resistance level at 0.8662. This resistance level holds noteworthy significance as it has previously acted as a barrier to price advancement, displaying characteristics of an overlap resistance.
Turning our attention to the support levels, the first support level at 0.8523 is positioned as a strong level of potential price support and is characterised as a multi-swing low support. Furthermore, the second support level at 0.8393 is considered robust due to its overlap support characteristic. This level enhances the overall strength of the support area.
Additionally, the second resistance level at 0.8744 holds significant importance for the upward movement. It is an overlap resistance and aligns with a 50% Fibonacci Retracement level, which adds further weight to its significance. The confluence of these factors forms a considerable hurdle for further advancement.
It is also worth noting the presence of an intermediate resistance level at 0.8580 that holds significance as an overlap resistance.

GBP/USD:
The GBP/USD chart currently exhibits a weak bullish overall momentum with low confidence. However, there is a potential for a bullish continuation in the market.
The first support level at 1.2669 is considered a good level of potential price support. It is characterised as an overlap support that aligns with a 23.60% Fibonacci Retracement, which adds further significance to its potential as a support level. Furthermore, the second support level at 1.2382 is identified as a multi-swing low support, suggesting that it has served as a significant level in the past.
On the upside, the first resistance level at 1.3001 is viewed as a significant level of potential price resistance. It is characterised as an overlap resistance that aligns with a 78.60% Fibonacci Projection level, which adds further weight to its significance. Additionally, the second resistance level at 1.3186 is identified as an overlap resistance and coincides with a 100% Fibonacci Projection, further enhancing its significance as a potential barrier to the upward movement.

GBP/JPY:
The GBP/JPY chart currently indicates a bullish overall momentum, suggesting a favourable environment for potential upward movement in the market.
The first support level at 182.06 is viewed as a strong level of potential price support and is considered a pullback support. Additionally, the second support level at 179.96 is recognized as a good level due to its swing low support characteristics.
On the resistance side, the first resistance level at 183.83 is considered a significant barrier to the upward movement. It is identified as a multi-swing high resistance. Furthermore, the second resistance level at 186.29 is seen as a notable level due to its swing-high resistance characteristics, potentially posing a challenge for further upward movement.

USD/CHF:
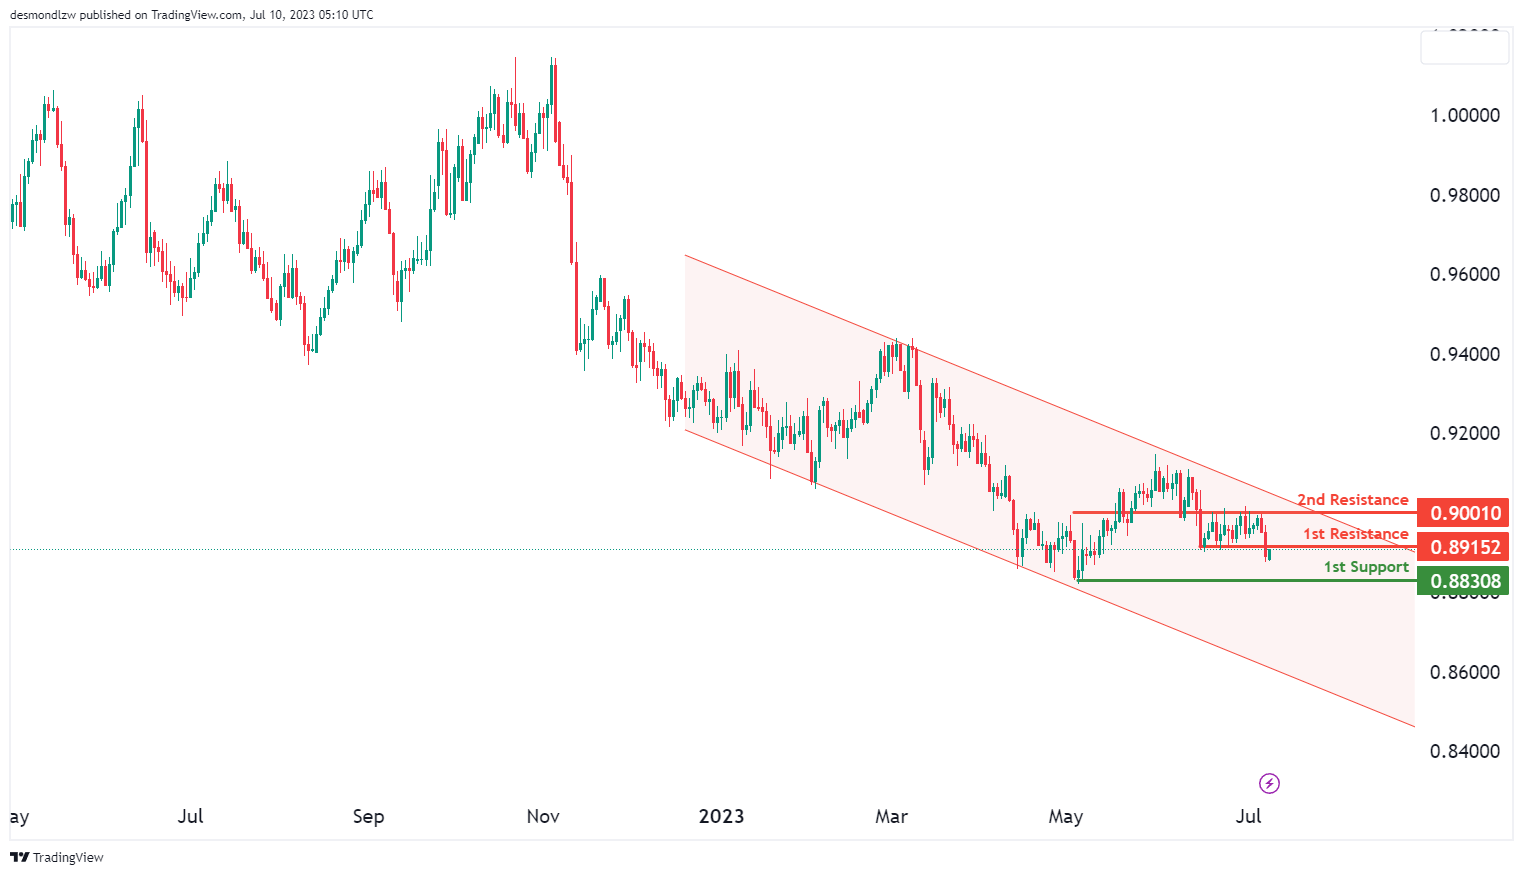
The USD/CHF chart currently indicates a bullish momentum with a potential for a bearish reaction off the first resistance level, followed by a potential drop towards the first support level. The first support level at 0.8831 is identified as a swing low support, indicating that it has previously acted as a significant level.
On the resistance side, the first resistance level at 0.8915 is considered significant as it represents an overlap resistance. This suggests a level that has the potential to act as a barrier to further upward movement. Furthermore, the second resistance level at 0.9001 is identified as an additional overlap resistance, reinforcing its significance as a potential level where upward movement is restricted..
USD/JPY:
The USD/JPY chart currently demonstrates a strong bullish momentum with high confidence, indicating a favourable outlook for potential upward movement in the market.
The first support level at 141.42 is considered significant as it represents a pullback support and aligns with a 23.60% Fibonacci Retracement. Additionally, the second support level at 138.29 is viewed as a pullback support and coincides with a 38.20% Fibonacci Retracement level.
On the upside, the first resistance level at 145.57 is deemed significant as it represents an overlap resistance that aligns close to the 78.6% Fibonacci Retracement level. Furthermore, the second resistance level at 150.26 is identified as a swing-high resistance, indicating its historical significance as a strong barrier.

USD/CAD:
The USD/CAD chart currently displays a bearish momentum, indicating a potential downward movement in the market.
The first support level at 1.3224 is considered significant as it represents an overlap support and aligns with a 61.80% Fibonacci Retracement level. This confluence of support factors enhances its potential as a significant support level. Additionally, the second support level at 1.3117 acts as a swing-low support, indicating its historical significance as a support level.
On the upside, the first resistance level at 1.3400 is identified as an overlap resistance. This potentially acts as a barrier to further upward movement. Furthermore, the second resistance level at 1.3648 represents another overlap resistance, indicating its potential significance as a barrier level.

AUD/USD:
The AUD/USD chart currently demonstrates a bullish momentum, indicating a potential upward movement in the market. There is a possibility for a bullish continuation towards the first resistance level.
This resistance level, located at 0.6778, is considered significant as it represents an overlap resistance. Additionally, it aligns with a 61.80% Fibonacci Retracement level, further reinforcing its importance. If the price manages to break above this resistance level, it could signal the continuation of the bullish trend.
In the event of a bullish continuation, the price may aim for the second resistance level at 0.6888. This level represents a swing high resistance and could act as a barrier for further upward movement.
On the downside, the first support level at 0.6548 plays a crucial role in providing a floor for the price. This support level is considered significant as it represents an overlap support. Moreover, it coincides with a 78.60% Fibonacci Retracement level, adding to its importance as a potential support zone.
Furthermore, the second support level at 0.6461 serves as a swing-low support and represents a previous area where the price found support and reversed its downtrend.

NZD/USD
The NZD/USD chart currently shows a bearish momentum, indicating a potential downward movement in the market. There is a possibility for a bearish continuation towards the first support level.
This support level, located at 0.6114, is considered significant as it represents an overlap support. It is an area where previous buying interest was observed, and it could act as a potential floor for the price. Additionally, the second support level at 0.6044 also acts as an overlap support, further reinforcing its significance. This support level aligns with a 78.60% Fibonacci Retracement level, indicating a potential area of strong support based on the Fibonacci analysis.
On the upside, the first resistance level at 0.6235 plays a crucial role in providing a barrier for further upward movement. This resistance level is considered significant as it represents an overlap resistance. It is an area where previous selling pressure was observed, and it could act as a potential ceiling for the price.
Furthermore, the second resistance level at 0.6305 acts as a pullback resistance. It represents a level where the price may encounter selling pressure after a retracement. This resistance level coincides with a 100% Fibonacci Projection level, further adding to its importance as a potential barrier for upward movement.

DJ30:
The DJ30 (Dow Jones Industrial Average) chart currently displays a bearish momentum, indicating a potential downward movement in the market.
The chart analysis reveals an intermediate support level at 33638.32, which is a crucial area to watch for a potential bullish rebound. This support level represents a significant level where previous price declines have been halted.
The first support level at 32595.85 further strengthens the potential downside support. It is considered a significant overlap support level.
Additionally, the second support level at 31744.50 acts as a multi-swing-low support, further reinforcing its importance. This level represents a zone where the price has experienced multiple bounces in the past..
On the upside, the first resistance level at 34601.29 is a significant overlap resistance. It represents a level potentially acting as a barrier for further price advancement.
Furthermore, the second resistance level at 35361.03 is a multi-swing-high resistance. It represents a level where the price has encountered selling pressure and experienced multiple rejections.

GER30:
The GER30 (DAX) chart currently indicates a bearish overall momentum, suggesting a potential downward movement in the market.
The chart analysis reveals a potential bearish reaction off the first resistance level. This level represents a significant barrier for further price advancement, where previous selling pressure has been observed.
In the event of a bearish reaction, the price could potentially drop towards the first support level located at 15266.30. This support level is considered significant due to its characteristics of overlap support and a 23.60% Fibonacci retracement.
Furthermore, the second support level at 14899.28 is also viewed as a good level of support. It exhibits overlap support characteristics, reinforcing the potential downside support in the event of a price decline.
On the resistance side, the first resistance level at 15707.42 is considered significant as it represents an overlap resistance. It is a price level that potentially acts as a barrier for further price advancement.
Furthermore, the second resistance level at 16290.73 is seen as a notable level due to its characteristics as a multi-swing high resistance. This level represents a zone where the price has experienced multiple rejections. It suggests that there is a significant area of resistance, potentially limiting further upward movement.

US500
The US500 (S&P 500) chart currently demonstrates a bearish overall momentum, indicating a downward bias in the market. There is a potential for a bearish continuation as the price could move towards the first support level at 4,310.30. This support level is considered significant as it is an overlap support, meaning that it has acted as a support level in the past, and it also coincides with a 23.60% Fibonacci Retracement, adding further strength to its significance.
Furthermore, the second support level at 4,190.90 also plays a crucial role in supporting the price. It is an overlap support, indicating that it has shown historical significance as a support level. Additionally, it aligns with a 38.20% Fibonacci Retracement, which adds to its credibility as a potential area of support.
On the upside, the first resistance level at 4,451.80 serves as a multi-swing high resistance. This means that it has previously acted as a barrier for the price, preventing it from moving higher. As a result, it is expected to offer significant resistance if the price attempts to move upward.
Moreover, the second resistance level at 4,586.80 is an additional overlap resistance. This suggests that it has played a role as a resistance level in the past and is likely to pose a challenge to any further upward movement.

BTC/USD:
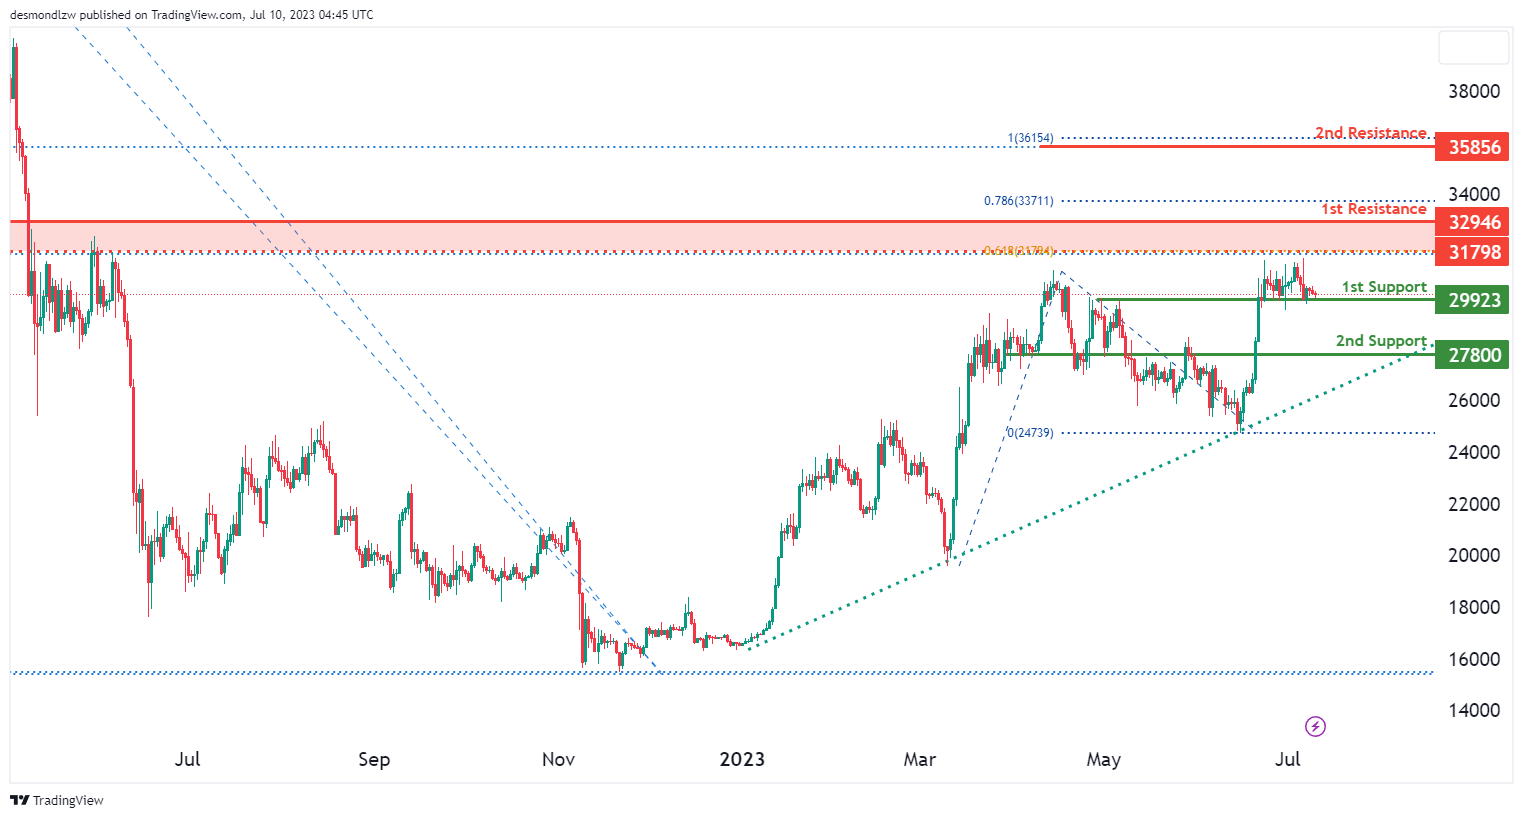
The BTC/USD (Bitcoin) chart currently exhibits a bullish momentum, indicating a potential for upward movement in the market.
The first support level at 29,923 is considered as a pullback support. Additionally, the second support level at 27,800 acts as an overlap support, further reinforcing its potential to provide support to the price.
On the upside, the first resistance level at 32,946 is identified as an overlap resistance. This potentially acts as a barrier to further upward movement. Furthermore, the second resistance level at 35,856 coincides with a 100.00% Fibonacci Projection level.
ETH/USD:
The ETH/USD (Ethereum) chart is currently displaying a weak bullish overall momentum with low confidence. In the short term, the price might potentially drop further to the 1st support at 1812.01 before bouncing from there and rising towards the 1st resistance. This support level is considered strong due to an overlap support and a 50% Fibonacci Retracement.
Furthermore, the 2nd support level, found at 1712.99, is viewed as robust due to an overlap support and a 78.60% Fibonacci Retracement.
On the other hand, the 1st resistance level is situated at 1927.68 and is deemed significant because of an overlap resistance. Lastly, the 2nd resistance stands at 2000.62, recognized as a swing high resistance and a 127.20% Fibonacci Extension, potentially posing a significant barrier to the price’s upward movement.

WTI/USD:
The WTI/USD (West Texas Intermediate crude oil) chart currently displays a weak bearish momentum with low confidence, suggesting a potential for a bearish reaction off the first resistance level.
A possible bearish reaction is possible as the price approaches the first resistance level at 73.60. This level is identified as an overlap resistance level that aligns with a 50% Fibonacci Retracement level, further reinforcing its significance as a potential turning point for the price. Furthermore, the second resistance level at 82.87 is considered a notable overlap resistance.
On the downside, in the event of a bearish reaction, there is an intermediate support level at 64.60. This level is identified as an overlap support and is expected to provide some temporary stabilisation to the price if it drops from the first resistance level. Furthermore, the first support level at 62.05 is considered significant as it represents an overlap support.

XAU/USD (GOLD):
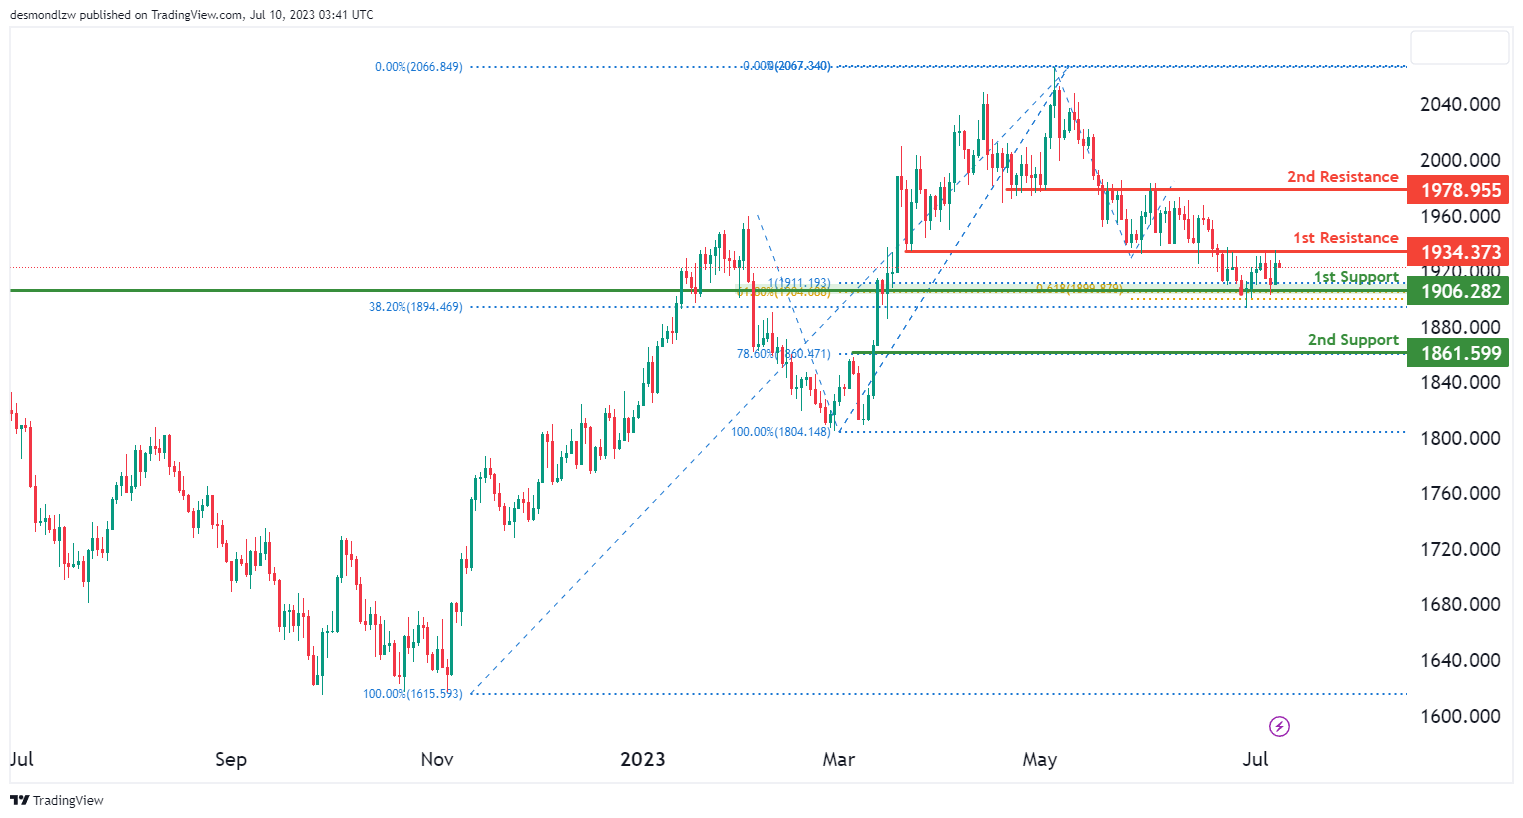
The XAU/USD (Gold) chart currently exhibits a neutral momentum, indicating a lack of clear direction in the market. During this phase, there is a potential for price to fluctuate within a certain range, bounded by the first support and first resistance levels.
The first support level at 1906.28 is considered significant as it represents an overlap support that aligns with a confluence of Fibonacci retracement and projection levels, specifically the 61.80% and 38.20% Fibonacci retracement levels, as well as the 61.8% Fibonacci projection level. This confluence adds to the significance of the support level, increasing the likelihood of it providing a solid base for the price. The second support level at 1861.60 is a support level that aligns with the 78.6% Fibonacci Retracement level.
On the upside, the first resistance level at 1934.37 is identified as an overlap resistance. Additionally, the second resistance level at 1978.96 is considered an additional overlap resistance, adding to the significance of potential resistance in the market.
The accuracy, completeness and timeliness of the information contained on this site cannot be guaranteed. IC Markets does not warranty, guarantee or make any representations, or assume any liability regarding financial results based on the use of the information in the site.
News, views, opinions, recommendations and other information obtained from sources outside of www.icmarkets.com, used in this site are believed to be reliable, but we cannot guarantee their accuracy or completeness. All such information is subject to change at any time without notice. IC Markets assumes no responsibility for the content of any linked site.
The fact that such links may exist does not indicate approval or endorsement of any material contained on any linked site. IC Markets is not liable for any harm caused by the transmission, through accessing the services or information on this site, of a computer virus, or other computer code or programming device that might be used to access, delete, damage, disable, disrupt or otherwise impede in any manner, the operation of the site or of any user’s software, hardware, data or property.


