
Key risk events today:
Limited.
(Previous analysis as well as outside sources – italics).
EUR/USD:
Weekly gain/loss: +0.07%
Weekly close: 1.1783
Weekly perspective:
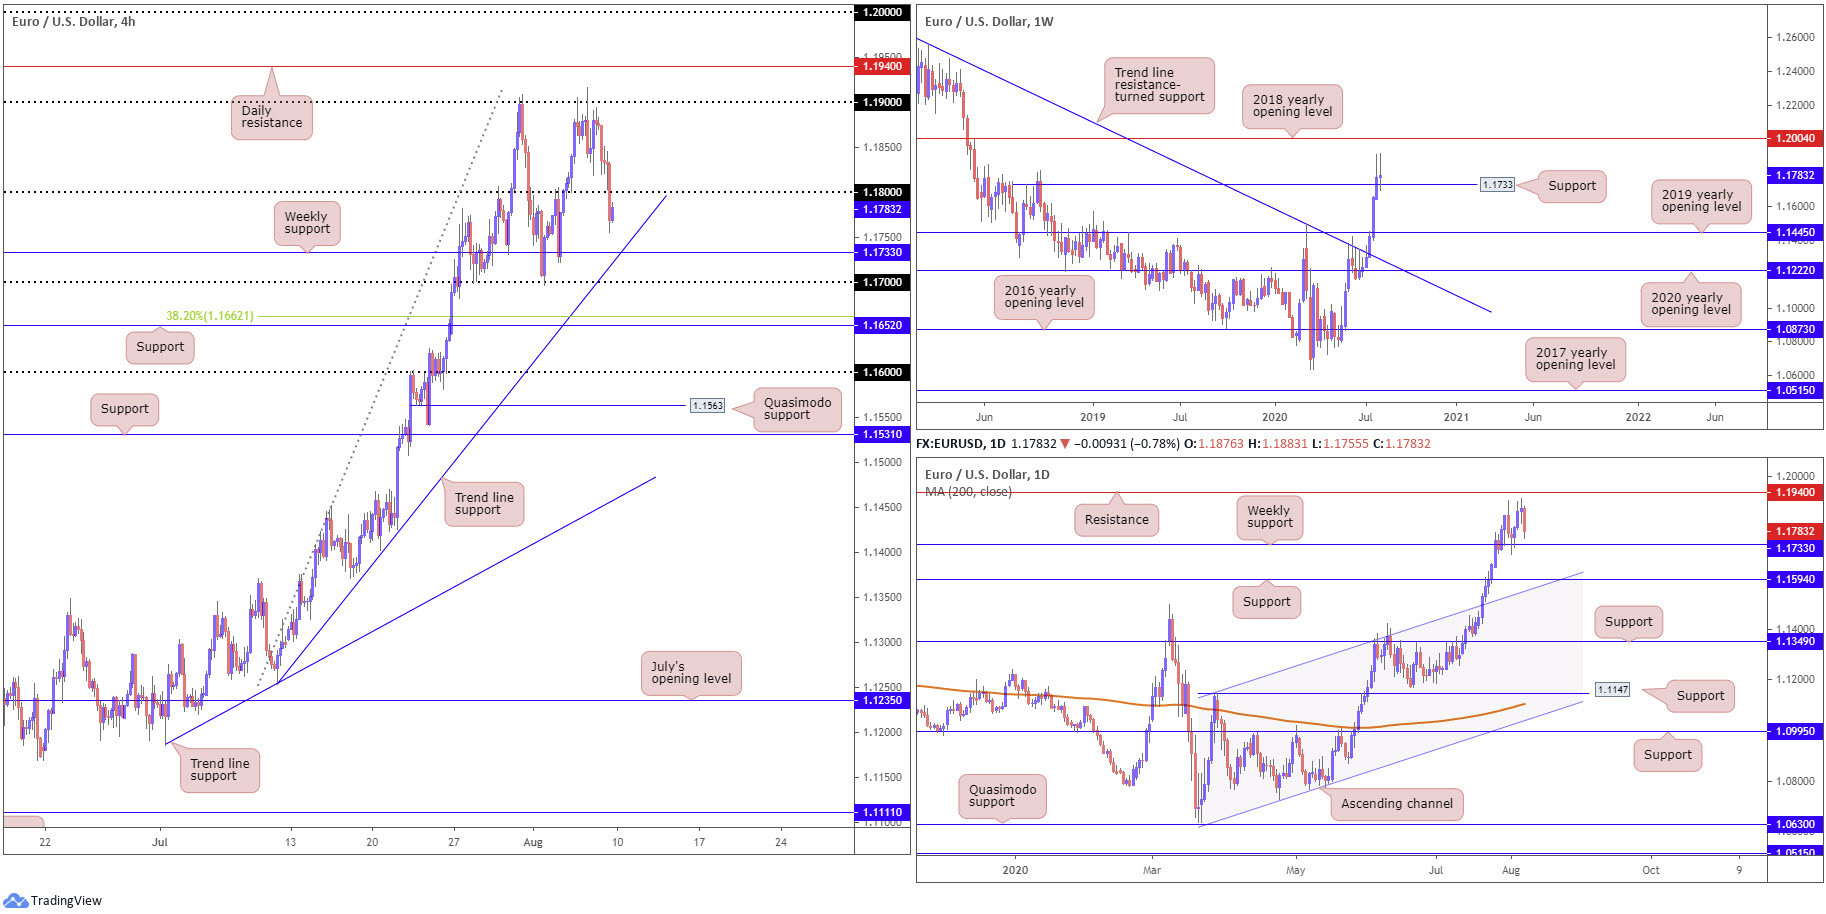
Despite having clocked a fresh 27-month peak at 1.1916 last week, recent trade finished pretty much neutral after the unit found thin air beyond the prior week’s high at 1.1909.
The past six weeks has seen EUR/USD climb from 1.1183 to mentioned highs of 1.1916. In this time, we’ve conquered trend line resistance, taken from the high 1.2555, the 2019 yearly opening level at 1.1445 and Quasimodo resistance at 1.1733. The latter, as you can see, was recently retested as a support.
Despite reluctance to hold things higher, longer-term traders are still urged to pencil in the possibility of a run to the 2018 yearly opening level at 1.2004 in the coming weeks. Failure to hold 1.1733 throws the 2019 yearly opening level at 1.1445 back into the pot as possible support.
Daily perspective:
A closer reading of price action on the daily timeframe displays the recent retest at weekly support from 1.1733 in clearer light.
Resistance on the daily chart can be seen parked at 1.1940 this week, with a break largely exposing weekly resistance at 1.2004 (2018 yearly opening level).
Beyond 1.1733 this week could draw attention to daily support at 1.1594, a level closely connected with channel resistance-turned support, taken from the high 1.1147.
H4 perspective:
Total US non-farm payroll employment rose by 1.8 million in July, the Bureau of Labour Statistics reported Friday. Although beating expectations, we’re still a long way off the 4.791 million rise in June, which is unsurprising due to increasing COVID-19 cases across the US. In terms of the unemployment rate, we fell to 10.2 percent, again beating expectations.
The US dollar index staged a notable recovery and reclaimed 93.00 status in the process, a day after recording fresh 27-month lows at 92.52. EUR/USD, after fading 1.19 on Thursday, pulled through 1.18 in dominant fashion on Friday and shined the spotlight on trend line support, extended from the low 1.1254 (aligns closely with weekly support mentioned above at 1.1733). Brushing aside the aforementioned level this week places 1.17 in view, followed by support at 1.1652 (merging closely with a 38.2% Fibonacci retracement ratio at 1.1662).
Areas of consideration:
The break of weekly trend line resistance (July 13), taken from the high 1.2555, and violation of the 1.1495 March 9 high, reflects a long-term (potential) technical trend change.
1.1733 weekly support is likely a watched level this week, particularly for buyers at the point it converges with H4 trend line support, drawn from the low 1.1254. A reaction from this point, one that moves price above 1.18, could strive to reach at least 1.19, with the possibility of stirring daily resistance at 1.1940 and even weekly resistance at 1.2004.
GBP/USD:
Weekly gain/loss: -0.22%
Weekly close: 1.3048
Weekly perspective:
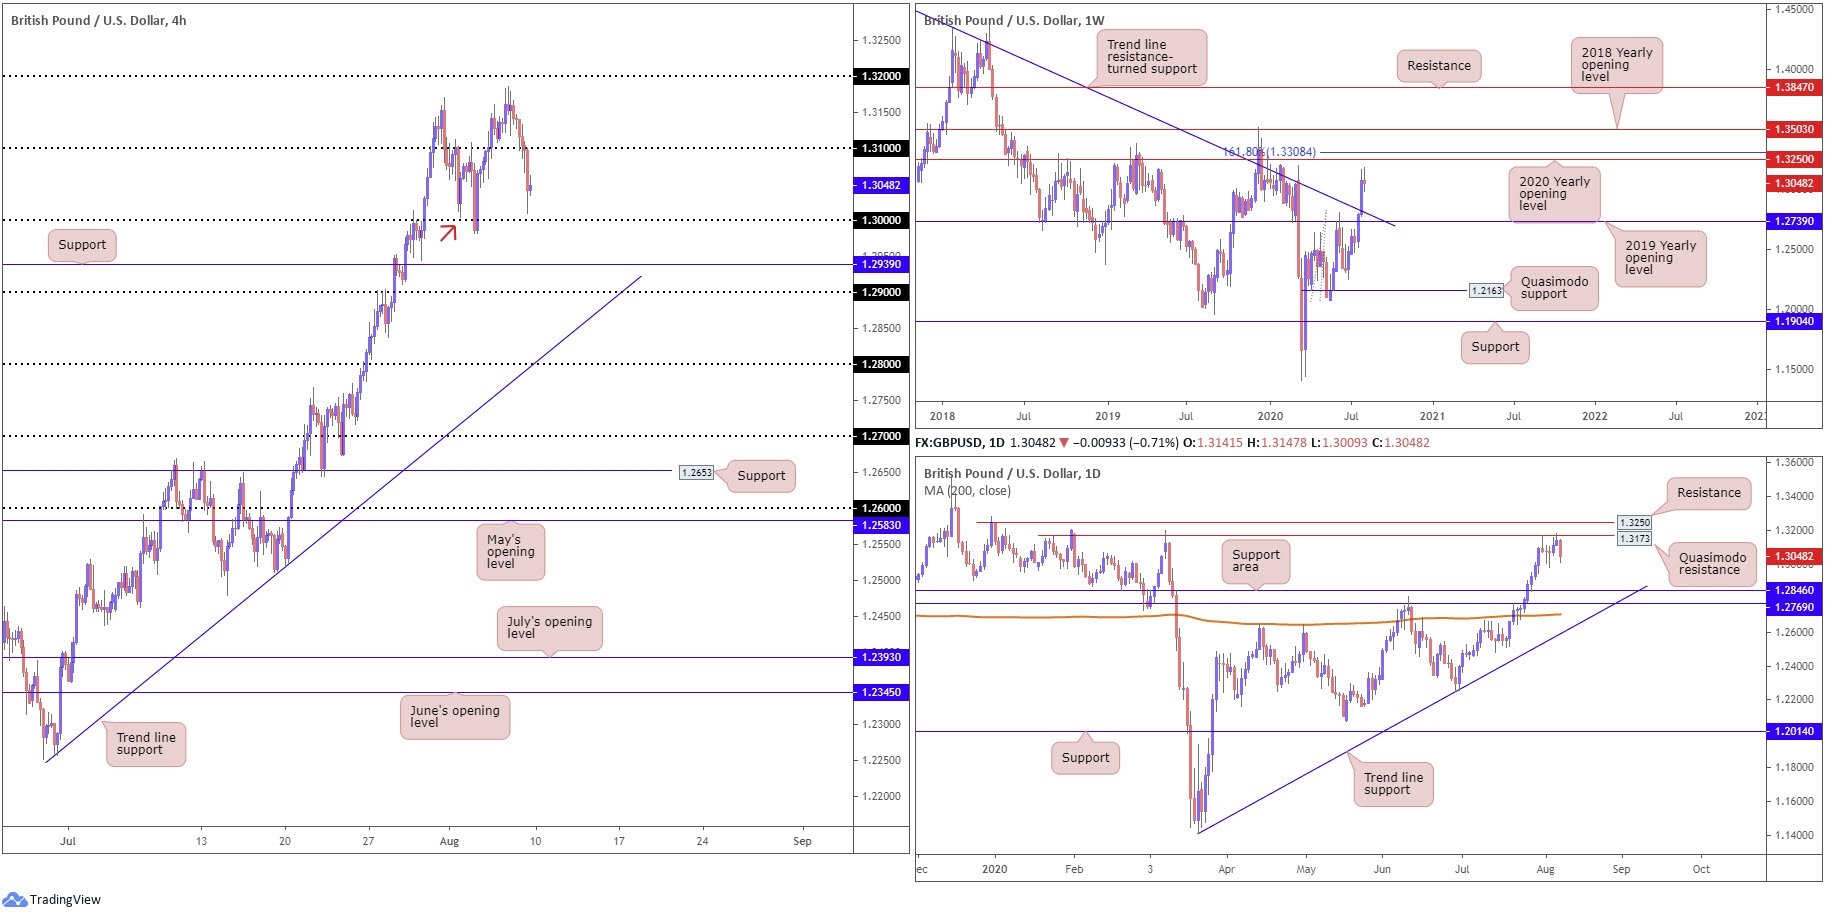
The recent trend line resistance break on the weekly timeframe (1.5930), despite the 1.3514 December 9 high (2019) still intact (a break of here also signals trend change to the upside), may have long-term traders consider bullish positions.
After powering through trend line resistance, scope to reach higher terrain is visible on the weekly timeframe, despite last week trading somewhat subdued. Resistance can be seen by way of the 2020 yearly opening level at 1.3250, closely tailed by a 161.8% Fibonacci extension point at 1.3308.
Leaving said resistances unchallenged this week and retreating south could call for a retest at the 2019 yearly opening level drawn from 1.2739 (dovetails closely with the recently broken trend line).
Daily perspective:
Quasimodo resistance at 1.3173 entered the fold last week, a level situated south of 1.3250 resistance. Interestingly, the latter shares the same space with resistance on the weekly timeframe, the 2020 yearly opening level.
An extension to the downside this week may have a support area between 1.2769/1.2846 elbow its way into the spotlight, positioned ahead of the 200-day SMA (orange – 1.2705) and trend line support, taken from the low 1.1409.
H4 perspective:
Friday witnessed GBP/USD extend its retracement slide from Thursday’s five-month peak at 1.3185 and overthrow the 1.31 handle, as the US dollar held onto the bulk of its gains following the latest US non-farm payrolls release.
Selling pressure accelerated after tunnelling through 1.31, with candles bottoming ahead of the key figure 1.30. The other key thing to note here is 1.30 boasts a connection with a Quasimodo support left shoulder (red arrow – 1.3004). Beyond here, traders’ crosshairs may be fixed on support listed at 1.2939 and then the 1.29 handle.
Areas of consideration:
Although weekly price indicates a shift to 1.3250ish, daily action is capped by Quasimodo resistance at 1.3173, threatening moves as far south as 1.2769/1.2846.
Against the backdrop of higher timeframe activity, the 1.30 figure on the H4 timeframe presents robust support to keep a tab on in early trade this week, knowing it joins with Quasimodo support at 1.3004. Consequently, buyers could make a stand from this region and attempt a recovery. Breaking 1.30, however, shifts focus towards intraday bearish scenarios to H4 support at 1.2939.
AUD/USD:
Weekly gain/loss: +0.25%
Weekly close: 0.7157
Weekly perspective:
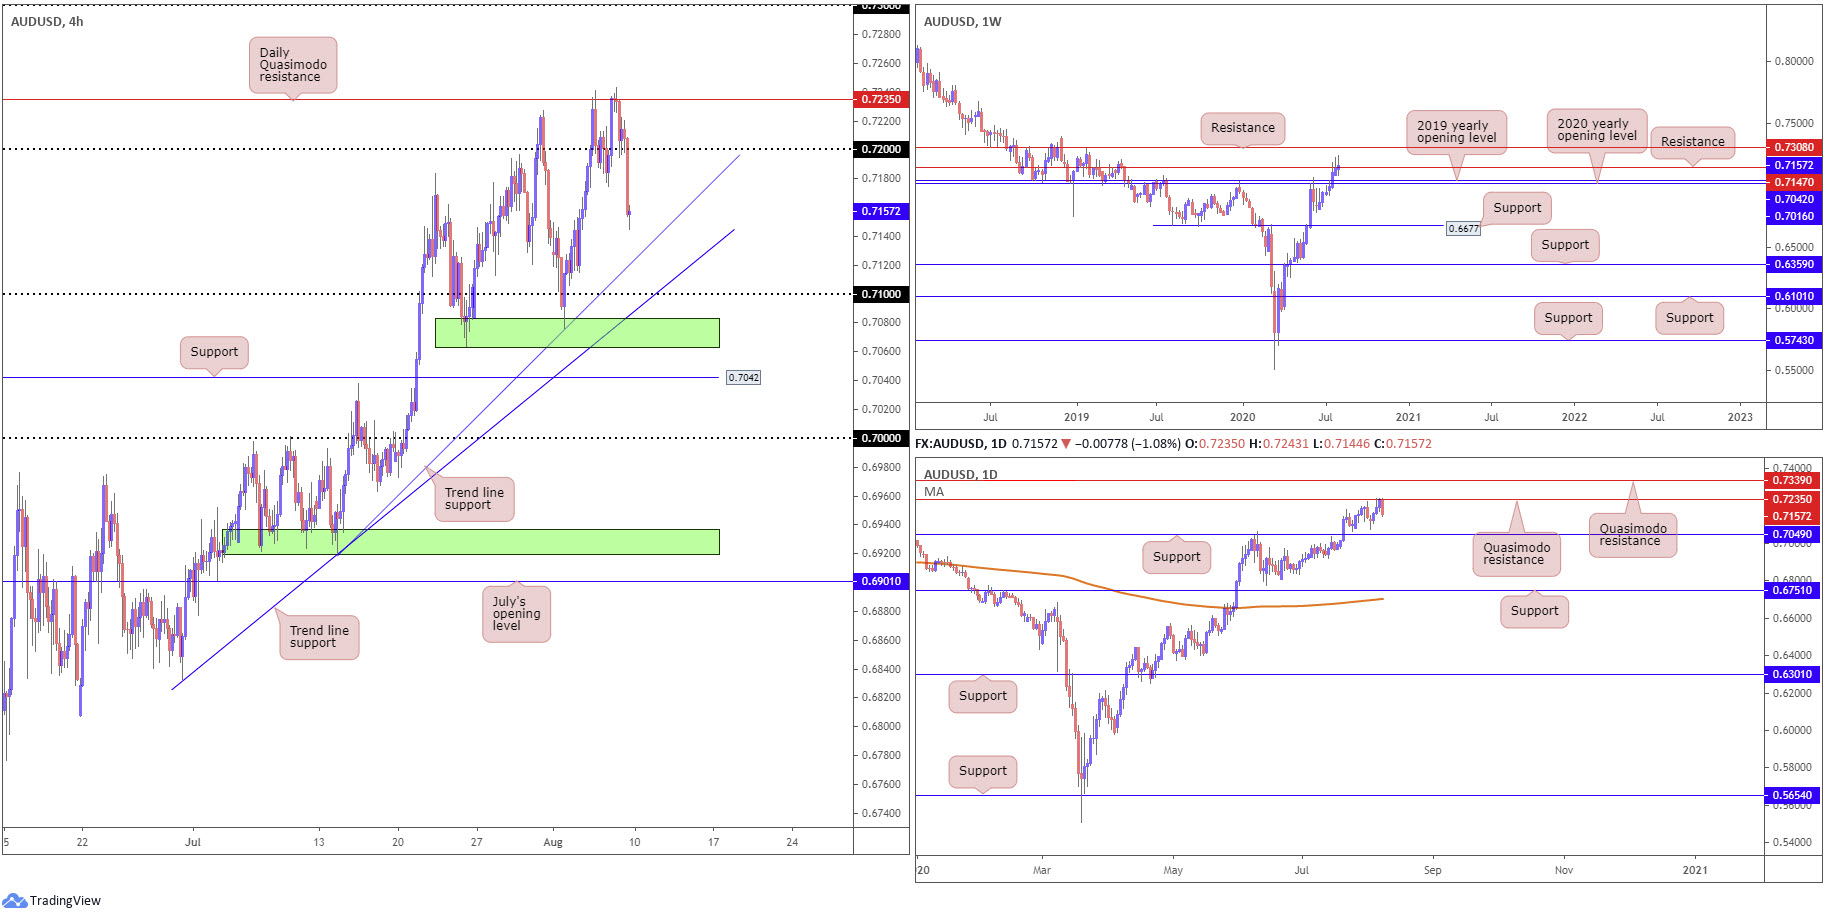
Buyers and sellers continue to battle for position around resistance at 0.7147, consequently ending recent trade considerably off best levels. As a result, upside momentum appears to be diminishing in recent weeks, underscoring the possibility of a retreat to the 2020 and 2019 yearly opening levels at 0.7016 and 0.7042, respectively. Conversely, assuming 0.7147 cracks, resistance at 0.7308 is likely to make an appearance this week.
Daily perspective:
Quasimodo resistance at 0.7235, as you can see, impacted price movement Friday, snapping a three-day bullish phase. This swings support back into the frame at 0.7049 this week, though given the current uptrend (present since March), prudent traders will also acknowledge the likelihood of reaching higher and perhaps testing Quasimodo resistance at 0.7339.
H4 perspective:
Despite a brief flicker of activity at 0.72, the round number relinquished its position heading into US trading as the buck responded to Friday’s non-farm payrolls data. Bypassing Thursday’s low at 0.7174, candle action concluded the week poised to reconnect with trend line support, pencilled in from the low 0.6921. Additional support can be found at another trend line support (0.6832) this week, coordinating with the 0.71 handle and a neighbouring support area (upper green) between 0.7063-0.7083.
Areas of consideration:
Waning momentum seen on the weekly timeframe, together with Friday sinking from Quasimodo resistance at 0.7235 on the daily timeframe, suggests a test of the two H4 trend line supports highlighted above in bold and round number 0.71. It is also possible we draw in the H4 support area noted at 0.7063-0.7083.
It will be at the aforementioned H4 supports traders expect dip-buyers to make a show. Failure to do so, we are then possibly headed for daily support at 0.7049, followed by H4 support at 0.7042 and the merging 2019 yearly opening level on the weekly timeframe.
USD/JPY:
Weekly gain/loss: +0.05%
Weekly close: 105.90
Weekly perspective:
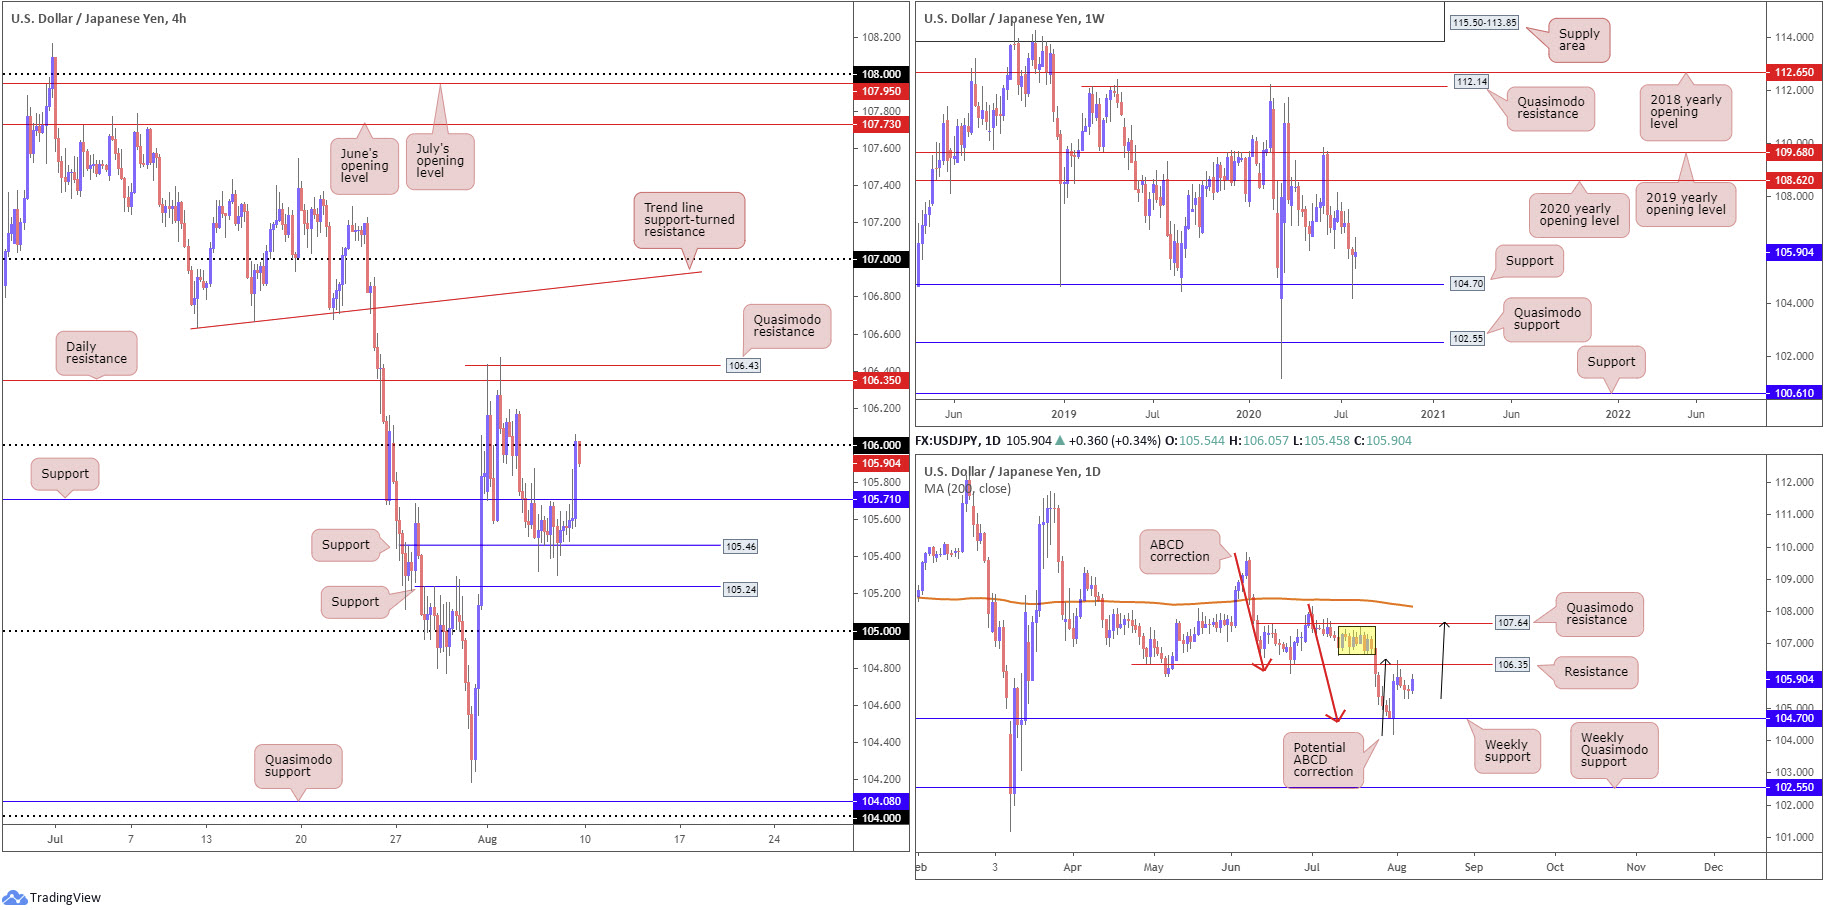
Longer-term traders appear to have spent the week digesting the prior week’s hammer pattern, established off support at 104.70. By and of itself, this is a relatively strong bullish signal, with obvious upside targets resting as far north as the 2020 yearly opening level from 108.62 and the 2019 yearly opening level at 109.68.
In the event buyers offer a docile stance going forward, Quasimodo support at 102.55 could become a talking point over the coming weeks.
Daily perspective:
Early trading, after an eager bounce from weekly support mentioned above at 104.70, caught up with a resistance level at 106.35 (a prior Quasimodo support).
Ousting 106.35 is certainly an option this week. Not only because of where the unit is coming from on the weekly timeframe, but also due to the lacklustre response seen from 106.35 so far. Above the latter, we have supply to contend with at 107.54-106.67 (yellow), as well as Quasimodo resistance coming in at 107.64. Also worth acknowledging is the prospect of establishing an ABCD bearish correction (black arrows) that conveniently terminates around 107.64.
H4 perspective:
For those who read Friday’s technical briefing you may recall the following (italics):
Going on the above, H4 traders might witness price climb through resistance at 105.71 to ignite intraday bullish themes to at least 106 and, dependent on the outcome of today’s US job’s data, possibly daily resistance at 106.35. Conservative buyers may seek additional confirmation before pulling the trigger (a retest forming at 105.71, for example).
As evident from the chart, H4 price concluded Friday shaking hands with 106, boosted by better-than-expected US non-farm payrolls data. Above 106, Traders can look forward to daily resistance at 106.35 entering the light and neighbouring H4 Quasimodo resistance at 106.43.
Areas of consideration:
Governed by the weekly timeframe rebounding from support at 104.70 and forming a bullish candlestick signal, longer-term analysis suggests the possibility of a run higher this week. Daily resistance at 106.35, although an additional reaction could form, also shows signs of softening.
Going on the above, the bearish reaction from 106 on the H4 timeframe may be short-lived, yet perhaps enough to force price to challenge H4 support at 105.71. This slides across two potential bullish scenarios to keep an eye on early week:
- A retest at 105.71, a move which may interest dip-buyers.
- A breakout above 106, consequently attracting breakout strategies.
Irrespective of the entry, daily resistance at 106.35 rests as the initial target, closely shadowed by H4 Quasimodo resistance at 106.43.
USD/CAD:
Weekly gain/loss: -0.22%
Weekly close: 1.3377
Weekly perspective:
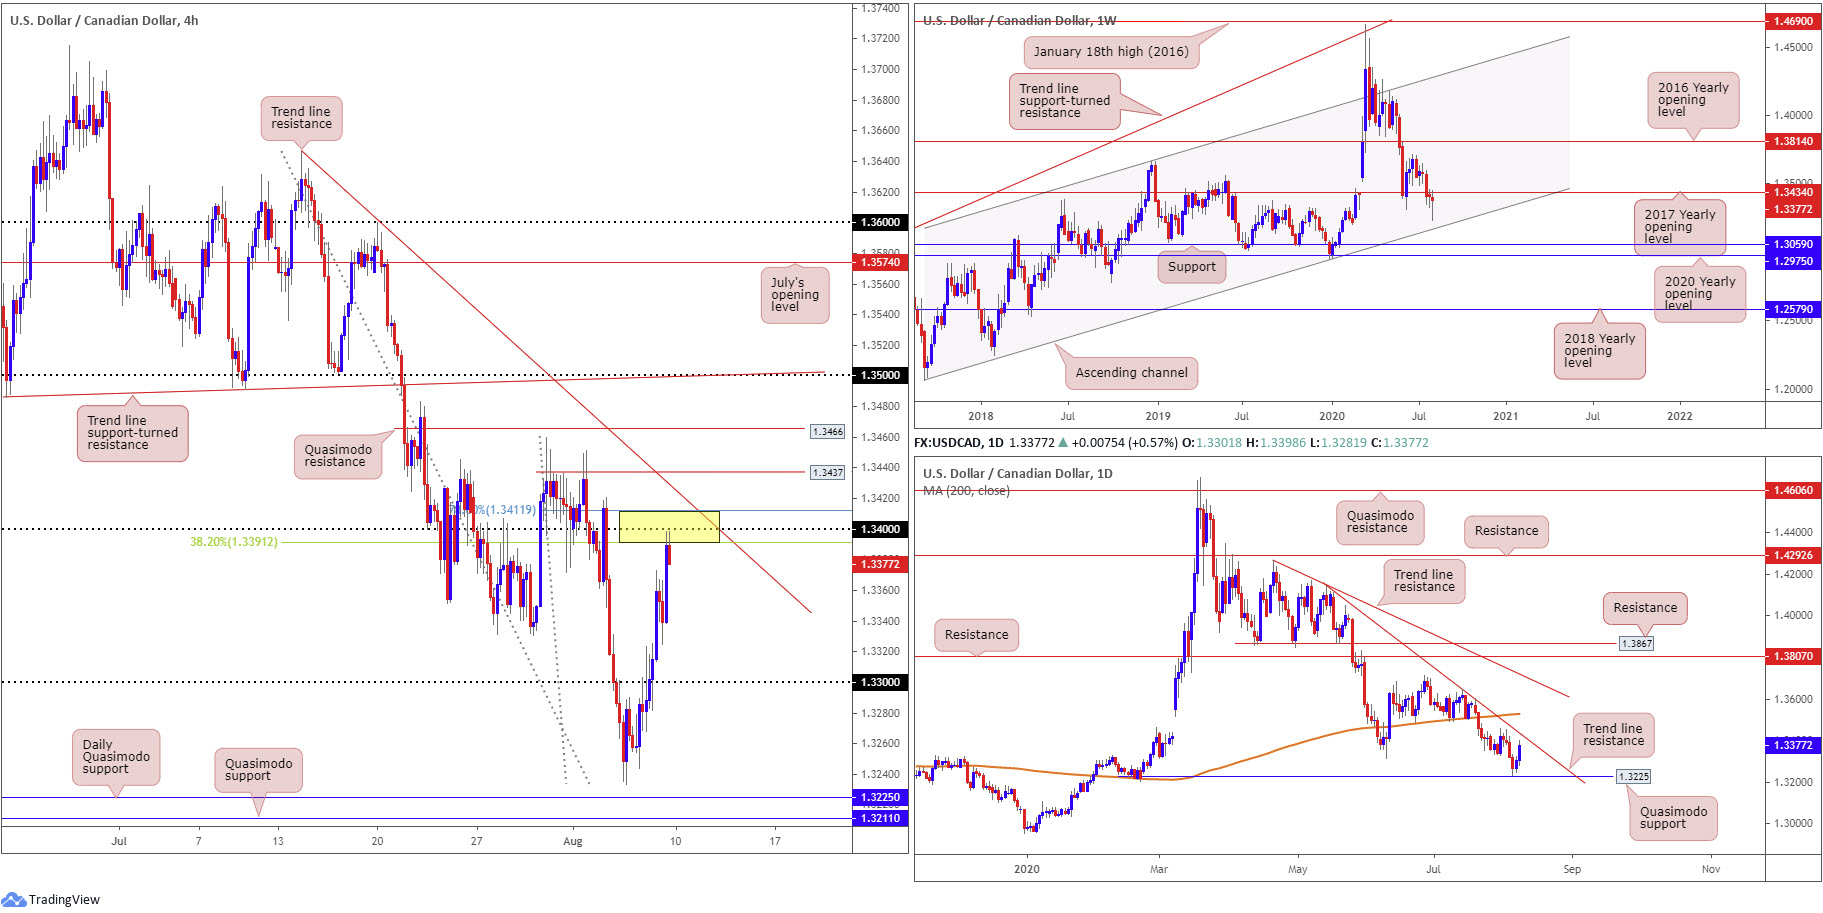
July 22 witnessed a break of the 2017 yearly opening level at 1.3434, signalling channel support, taken from the low 1.2061, could enter the fight. Yet, since the break we have seen sellers reluctant to commit, with last week finishing considerably off worst levels.
Daily perspective:
Heading into the second half of the week, price turned ahead of Quasimodo support at 1.3225 and extended recovery gains into the close.
Should we take the pair above the 2017 yearly opening level at 1.3434 this week, and cross above daily trend line resistance, taken from the high 1.4140, the 200-day SMA (orange – 1.3528) could surface as potential resistance.
H4 perspective:
Going into US hours Friday, USD/CAD pencilled in a low at 1.3324 in response to US and Canada’s employment data. The move lower was brief, as the US dollar index secured ground above 93.00 and WTI prices pulled to lows ahead of $41.00 a barrel.
This had USD/CAD extend north of the 1.33 handle and bump heads with an interesting area of resistance (yellow) between 1.3412/1.3391, made up of a 78.6% Fibonacci retracement ratio at 1.3412, the 1.34 handle and the 38.2% Fibonacci retracement ratio at 1.3391. Also worth pointing out is trend line resistance, taken from the high 1.3646, and Quasimodo resistance plotted at 1.3437.
Areas of consideration:
A bearish response from the H4 resistance area at 1.3412/1.3391 is a possibility early week, owing to the confluence the zone brings to the table.
Another scenario this week, however, is a pop to H4 Quasimodo resistance at 1.3437, a move likely welcomed by sellers. Building a technical case for bearish themes, traders have H4 trend line resistance plotted nearby, etched from the high 1.3646, a daily trend line resistance, taken from the high 1.4140, and the 2017 yearly opening level at 1.3434.
USD/CHF:
Weekly gain/loss: -0.10%
Weekly close: 0.9122
Weekly perspective:
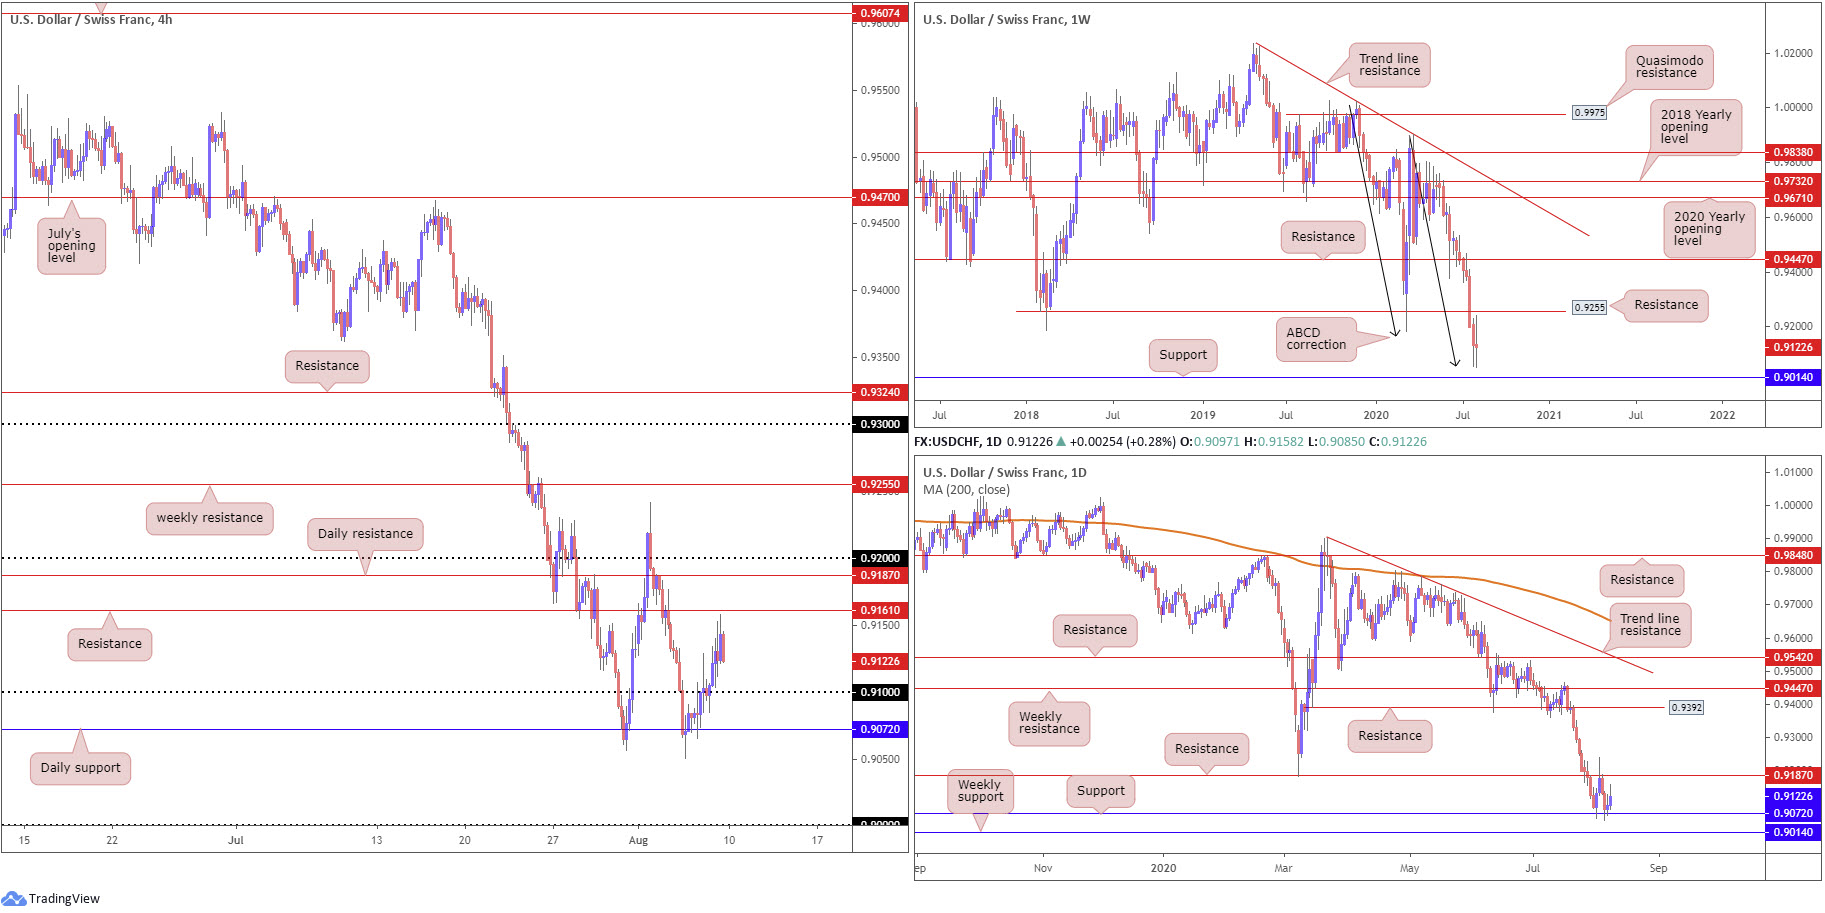
Coming off a decisive six-week decline, buyers and sellers wrapped up last week’s action hesitantly, forming a long-legged doji candlestick pattern at an ABCD completion point (black arrows) around 0.9051.
The doji suggests forces of supply and demand are possibly nearing equilibrium. Therefore, given we’re testing ABCD support, along with additional support present nearby at 0.9014, traders may interpret the recent indecision as a potential change of direction this week.
Daily perspective:
Resistance at 0.9187 came into force early trade last week, guiding price to support at 0.9072 mid-week. Buyers, as you can see, staged a modest comeback, albeit closing moderately off best levels into the close.
Note this action takes place around the weekly ABCD correction point at 0.9051.
H4 perspective:
Despite an early dip to lows at 0.9112, shortly after the release of US non-farm payrolls data Friday, US traders entered the fold reasonably bid to form tops just south of resistance at 0.9161.
Areas of consideration:
While the underlying trend points southbound, weekly structure recently crossing swords with an ABCD correction at 0.9051, in the shape of a long-legged doji candlestick pattern, and daily price rebounding from support at 0.9072, implies recovery gains may surface this week.
Before buyers step in, however, traders may observe a 0.91 (H4) retest materialise, with the possibility of a fakeout to daily support at 0.9072. Conservative traders may seek additional candlestick confirmation off 0.91 before committing, targeting H4 resistance at 0.9161 as an initial point.
Failure to bring in 0.91, buyers are left with limited support to work with. This may mean buyers will want to see H4 resistance at 0.9161, daily resistance at 0.9187 and the 0.92 handle (H4) taken out before considering bullish strategies, targeting weekly resistance at 0.9255 as the initial call.
Dow Jones Industrial Average:
Weekly gain/loss: +3.61%
Weekly close: 27449
Weekly perspective:
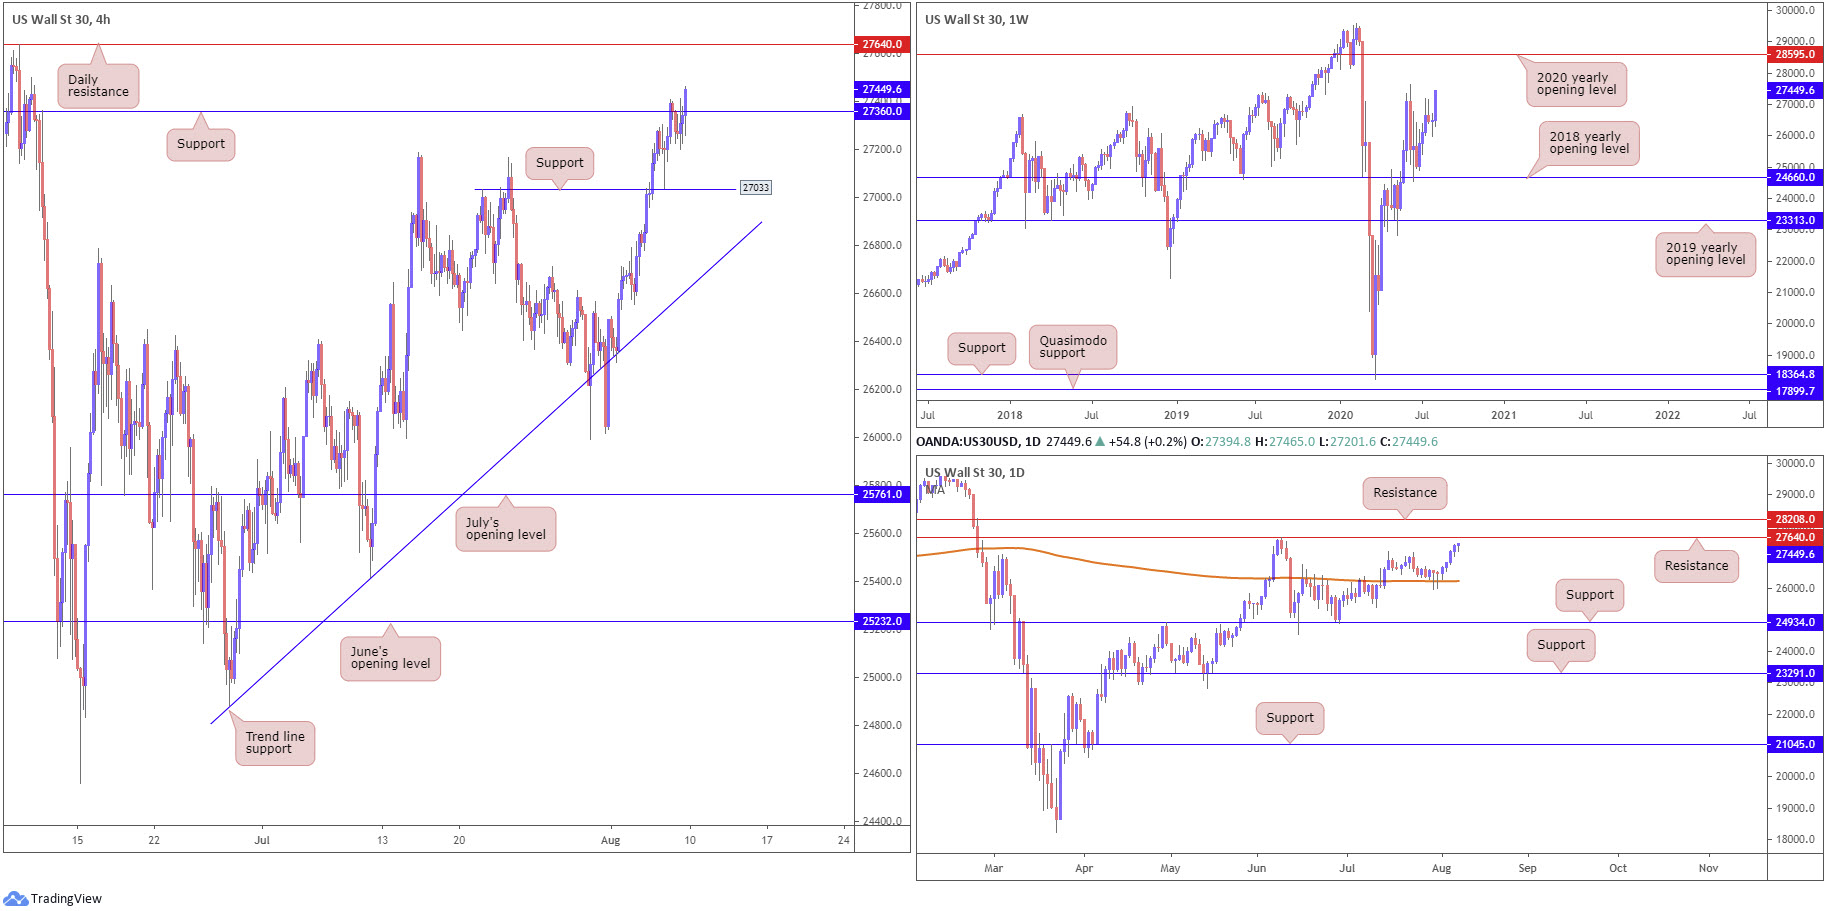
After rebounding from the 2018 yearly opening level at 24660 mid-June, technical action, despite a phase of hesitation in recent weeks, witnessed price close last week out strongly, represented by way of a near-full-bodied bullish candle.
As we head into a fresh week, the unit is poised to pull in the 27638 high, followed by a plausible run to the 2020 yearly opening level at 28595.
Daily perspective:
After retesting the 200-day SMA (orange – 26249), in the form of back-to-back hammer candle patterns, recent trading put up five consecutive bullish candles. This placed things within touching distance of resistance at 27640, with a break here pulling forward another layer of resistance at 28208.
H4 perspective:
Major US stock indexes finished mostly higher Friday, with the latest round of US employment figures doing little to deter the advance. The Dow Jones Industrial Average climbed 46.50 points, or 0.17%; the S&P 500 rallied 2.12 points, or 0.06%, while the tech-heavy Nasdaq 100 concluded lower by 127.70 points, or 1.13%.
After missing support at 27033 on Thursday by a hair, buyers mustered sufficient strength to surpass resistance at 27360 Friday (now a serving support), a move that throws across the prospect of further buying to daily resistance at 27640 this week.
Areas of consideration:
For traders who read Friday’s technical outlook you may recall the following (italics):
It is unlikely H4 resistance at 27360 will produce much for sellers, as according to both weekly and daily charts the next point of interest falls in at 27640 (daily resistance). Fresh buyers, therefore, could make a show in the event of a decisive H4 close above 27360, targeting the aforementioned daily resistance. Conservative traders may choose to drill down to the lower timeframes to secure an entry; others may require a H4 retest to form at 27360 before engaging.
With H4 price establishing a position above 27360 into the closing stages of the week, further buying could be in store early trade this week.
XAU/USD (GOLD):
Weekly gain/loss: +3.00%
Weekly close: $2,035.23
Weekly perspective:
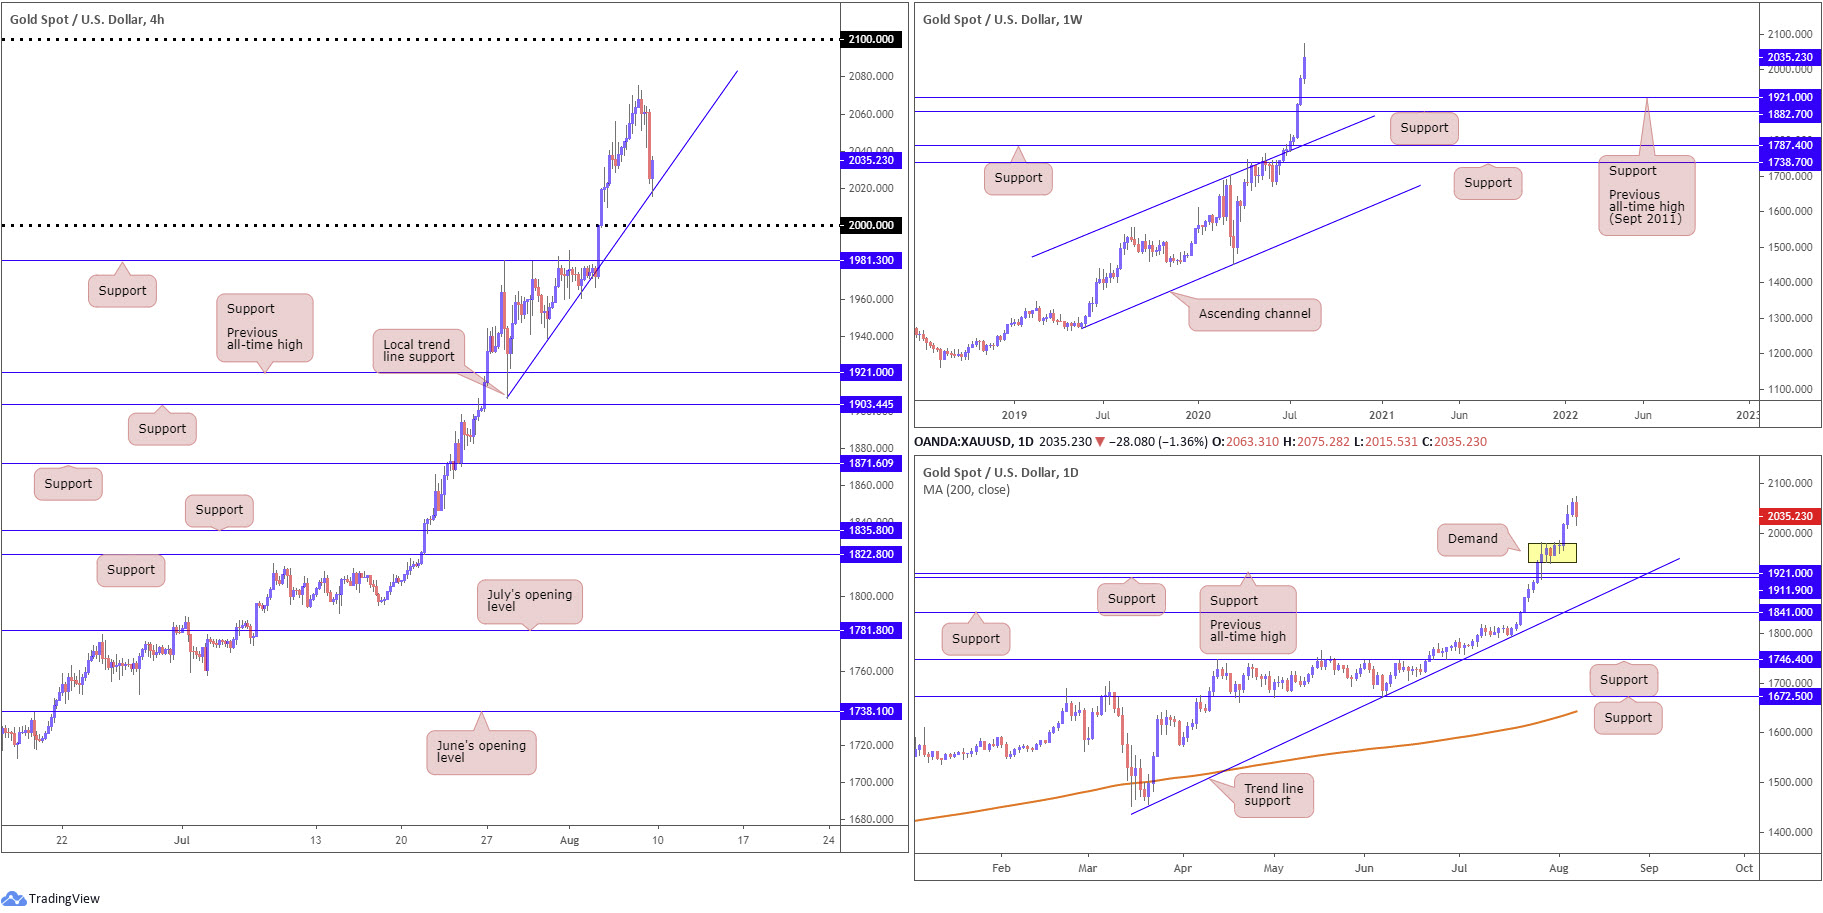
Bullion retained a strong underlying bid last week, extending its record-breaking run. Recording a ninth consecutive weekly advance, spot gold was driven to an all-time peak at $2,075.28 per ounce.
The yellow metal appears to be incredibly overbought at the moment and due a pullback. Traders, therefore, are urged to pencil in the possibility of a retreat forming as far south as $1,921.00, the previous all-time high (September 2011).
Daily perspective:
A closer examination of price movement on the daily timeframe reveals Friday snapped a five-day bullish phase, shaped by way of a reasonably dominant bearish outside candle.
We can see daily flow projects price will likely cross swords with demand (yellow) at $1,941.10/$1,981.20, if follow-through selling comes to pass.
H4 perspective:
Despite a brief knee-jerk pop to highs at $2,064.29 following the latest round of US employment figures Friday, the price of gold sunk to a local trend line support, taken from the low $1,907.06. Note a mild reaction off the aforementioned level emerged into the close.
Technicians will also acknowledge that a break of the current trend line pulls across the possibility of a $2,000.00 retest.
Areas of consideration:
Further buying remains likely in this market.
The pullback to current H4 trend line support, coupled with the moderate response, is likely enough to see some buyers pull the trigger in hope of potentially chalking up fresh all-time peaks this week, in the direction of $2,100.00.
Breaking the said H4 trend line and reaching for $2,000.00 is equally likely to encourage dip-buying themes, though traders may adopt a cautious tone, threatened by a potential fakeout to H4 support at $1,981.30.
The accuracy, completeness and timeliness of the information contained on this site cannot be guaranteed. IC Markets does not warranty, guarantee or make any representations, or assume any liability regarding financial results based on the use of the information in the site.
News, views, opinions, recommendations and other information obtained from sources outside of www.icmarkets.com.au, used in this site are believed to be reliable, but we cannot guarantee their accuracy or completeness. All such information is subject to change at any time without notice. IC Markets assumes no responsibility for the content of any linked site.
The fact that such links may exist does not indicate approval or endorsement of any material contained on any linked site. IC Markets is not liable for any harm caused by the transmission, through accessing the services or information on this site, of a computer virus, or other computer code or programming device that might be used to access, delete, damage, disable, disrupt or otherwise impede in any manner, the operation of the site or of any user’s software, hardware, data or property.


