Whether you trade one market or a number of markets, correlation analysis is indispensable.
Correlation defines how much (or how little) two or more instruments move together over a period of time. Knowing how currency pairs communicate with one another and their relationship with surrounding markets, such as commodities, bonds and equities, can help traders position themselves accordingly.
Breaking down currency correlations
Understanding currency correlations helps with risk management; helps avoid overtrading and can, if used correctly, improve your overall trading strategy.
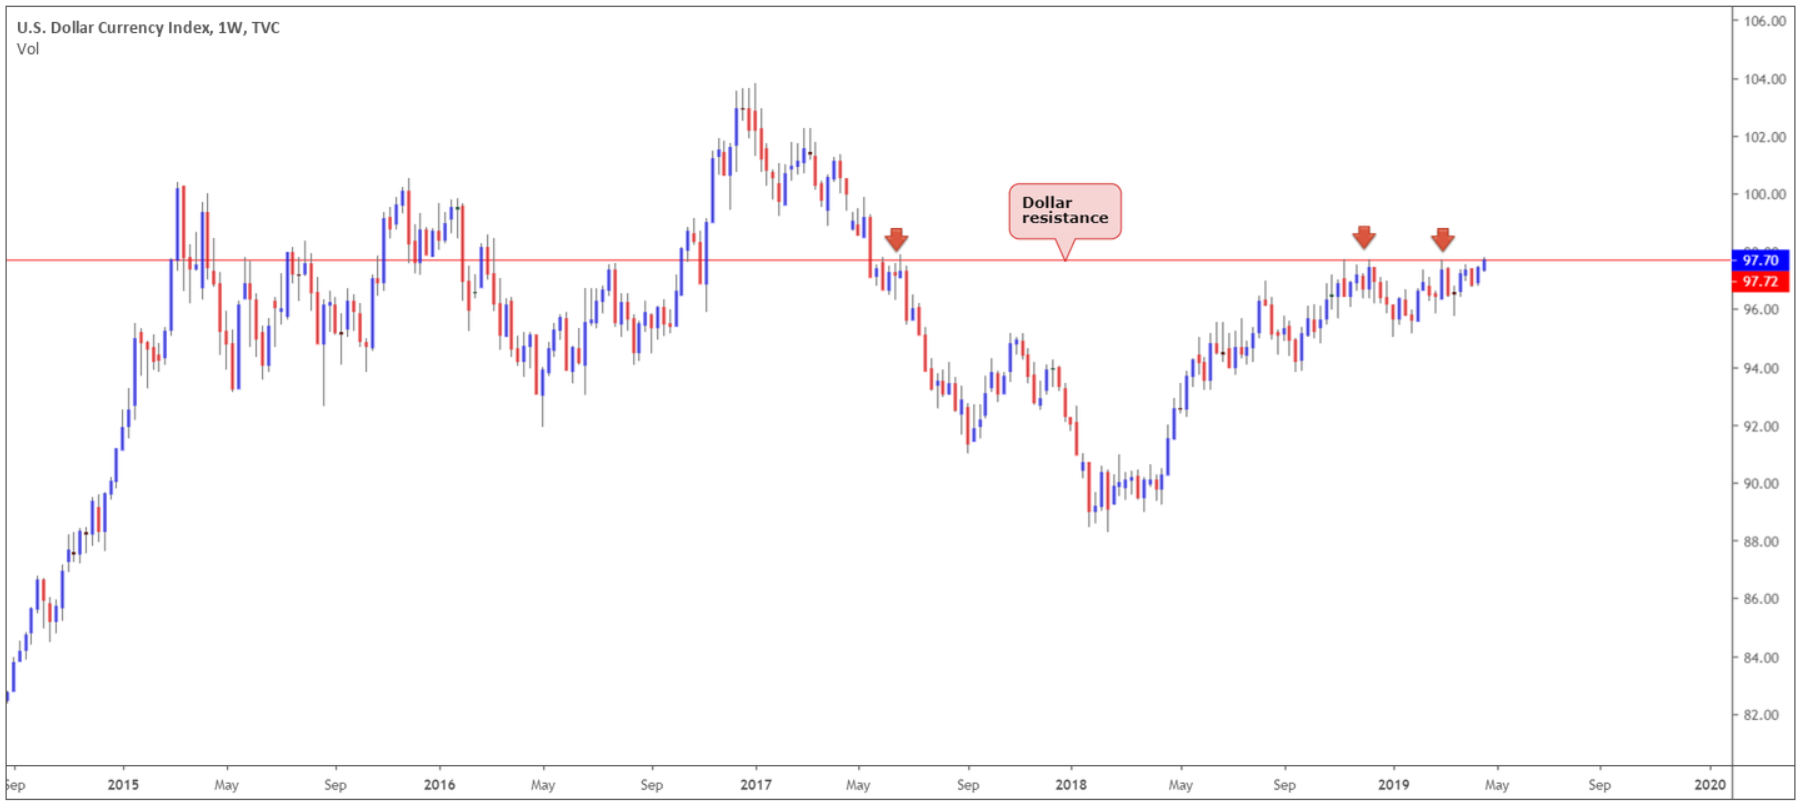
The US dollar index:
The US dollar is a powerful currency. It is in fact the world’s reserve currency.
The US dollar index seeks to track the value of the US dollar vs. a trade-weighted basket of currencies. The euro accounts for more than half of the index as the European Union is a major trading partner with the US. Other currencies include the Japanese yen, British pound, Canadian dollar, Swedish krona and Swiss franc.
As of current price, the index is crossing swords with notable resistance at 97.72. This level, as you can see from the chart below, held price action lower on a number of occasions in the past. With this information, traders know the US dollar might turn lower across the board, and, therefore, potentially send major currency pairs higher, such as the EUR/USD, GBP/USD and AUD/USD.
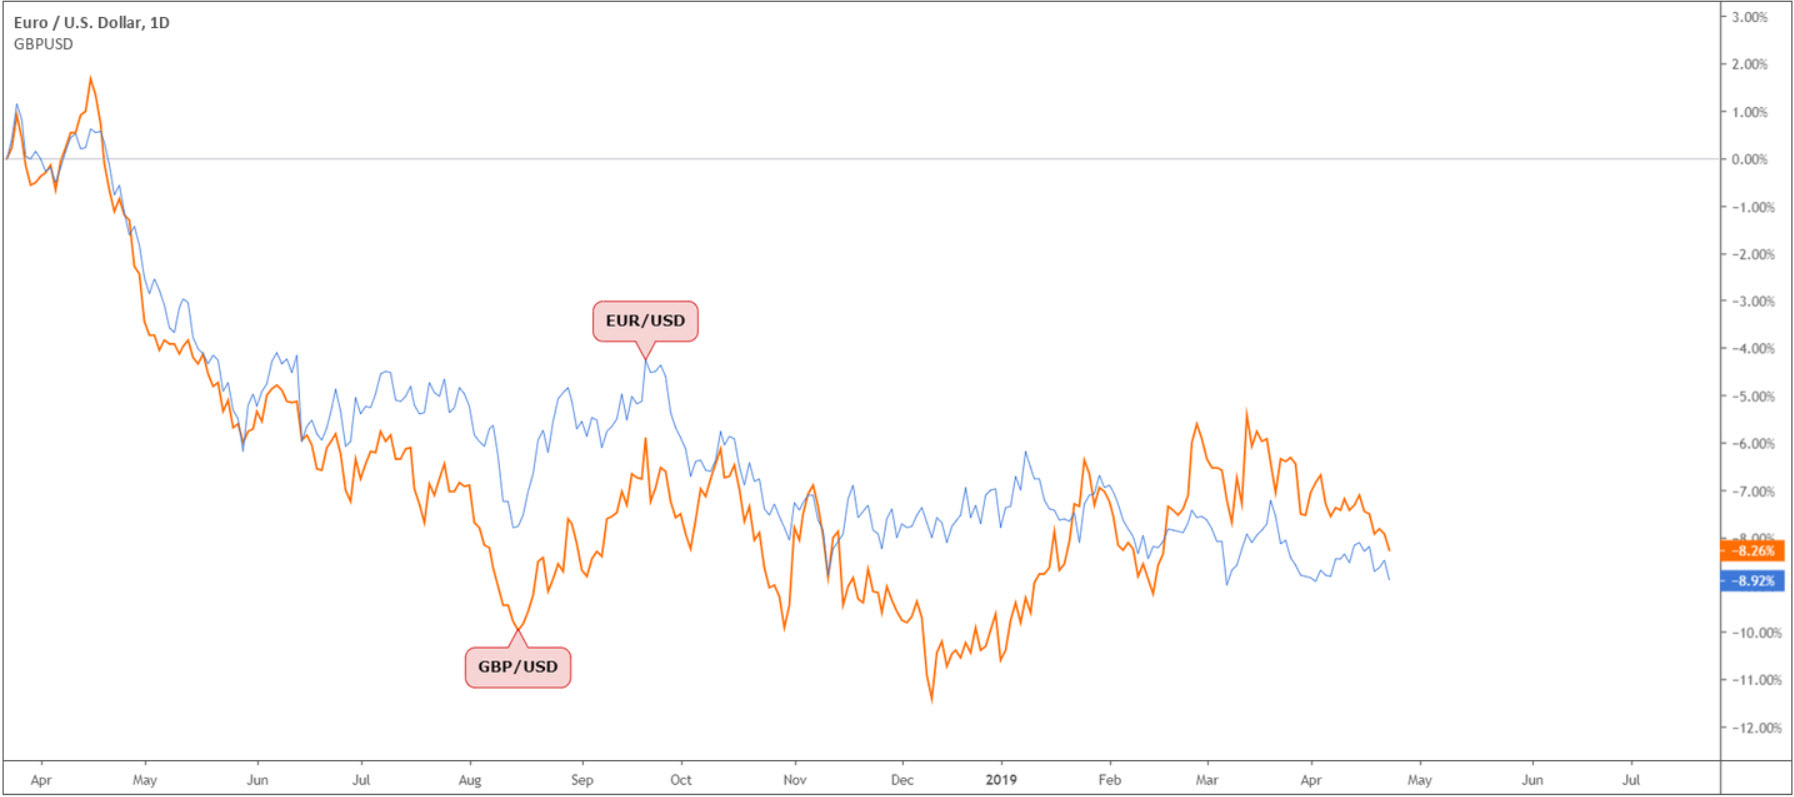
The EUR/USD and GBP/USD:
An example of strong positive correlation between two currency pairs is: EUR/USD and GBP/USD. This means when the EUR/USD chalks up a high, you’ll typically see a similar scenario on the GBP/USD.
A trader who enters long on the EUR/USD and also the GBP/USD, therefore, is exposed to greater directional risk – essentially doubling your position size.
If you have a directional bias for a given currency, you can spread your risk using two strongly positive correlated pairs.
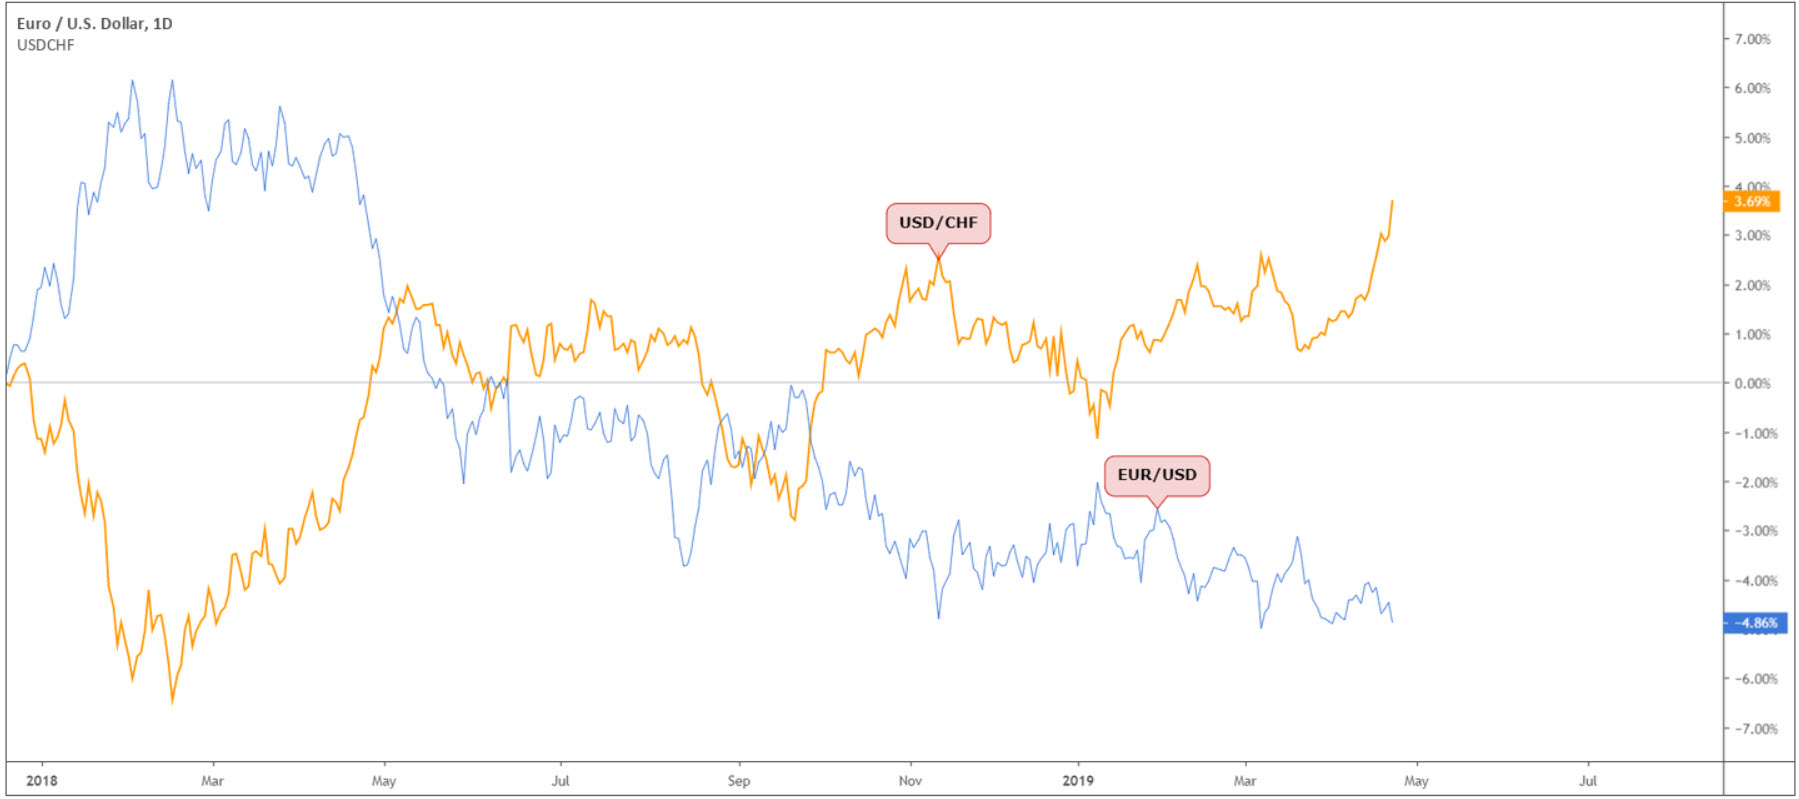
The EUR/USD and USD/CHF:
Two well-known inversely correlated markets are the EUR/USD and USD/CHF. This means when the EUR/USD chalks up a high, you’ll typically see the opposite form on the USD/CHF, and vice versa.
By acknowledging this correlation, traders can avoid positions that effectively cancel each other out. If you have a directional bias, buying both EUR/USD and USD/CHF will offset the moves in each pair.
Should you look to hedge – defined as a risk management strategy used in limiting or offsetting the probability of loss from fluctuations in prices – you can enter long (buy) EUR/USD and if it starts moving against you, you can hedge the position by selling a negatively correlated pair, such as USD/CHF.
Although two individual currencies can indeed exhibit a certain correlation due to their specific fundamental characteristics, there will be times when the correlation deviates. This is usually due to political or economic reasons.
Making life easier
The Correlation Matrix displays the correlation between markets over a configurable timeframe. This makes life easier for traders as you can drag the matrix on to your trading platform and view correlations with ease.
Simply select the Navigator tab (Ctrl + N) and choose Expert Advisors. Find the tab labelled Correlation Matrix and drag the advisor on to the chart.
Using the Correlation Matrix:
The Correlation Matrix shows the correlation between a grid of selected symbols:
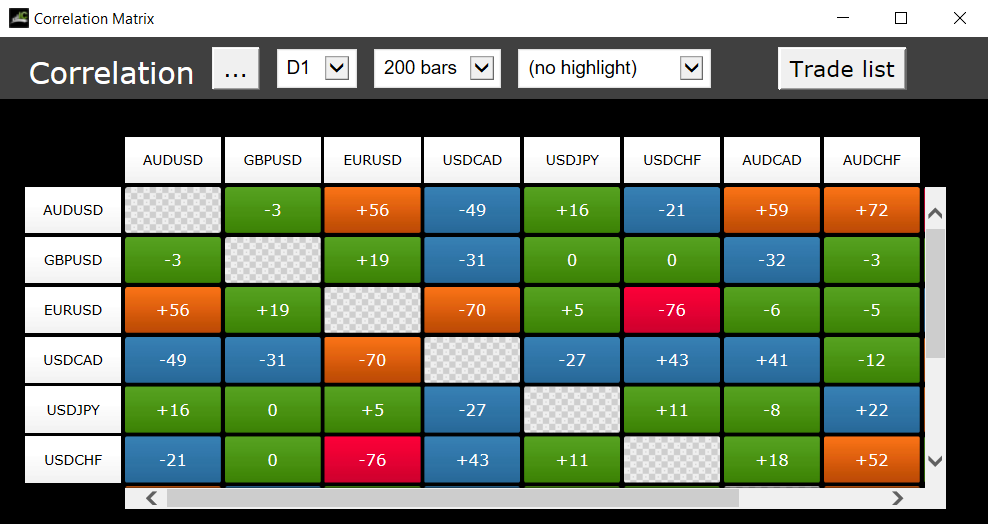
Each cell in the matrix is colour-coded:
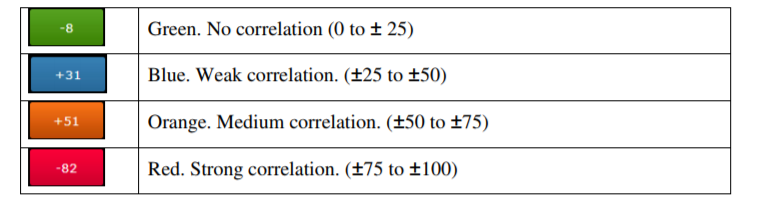
It makes little difference whether values are positive or negative (e.g. +90 or -90), the meaning depends on whether you’re long or short. For example:
- +90. If you are long both symbols, or short both symbols, then you will tend to see identical profits or losses on both positions. If you are long one symbol and short the other, then you will tend to have a matching profit and loss.
- -90. If you are long both symbols, or short both symbols, then you will tend to have matching profit and loss. If you are long one symbol and short the other, then you will tend to see identical profits or losses on both positions.
The chequered cells show rows and columns which are the same (i.e. correlation of EURUSD against itself is meaningless). The grid is symmetrical either side of the chequered line: e.g. the correlation of EURUSD against USDCHF is the same as the correlation of USDCHF against EURUSD.
IC Markets also offers the Correlation Trader. To apply this to the chart, repeat the same process for the Correlation Matrix, only this time select Correlation Trader.
Using the Correlation Trader:
The Correlation Trader shows recent price charts for two symbols side by side (and can be used simply as a way of displaying two linked price charts):
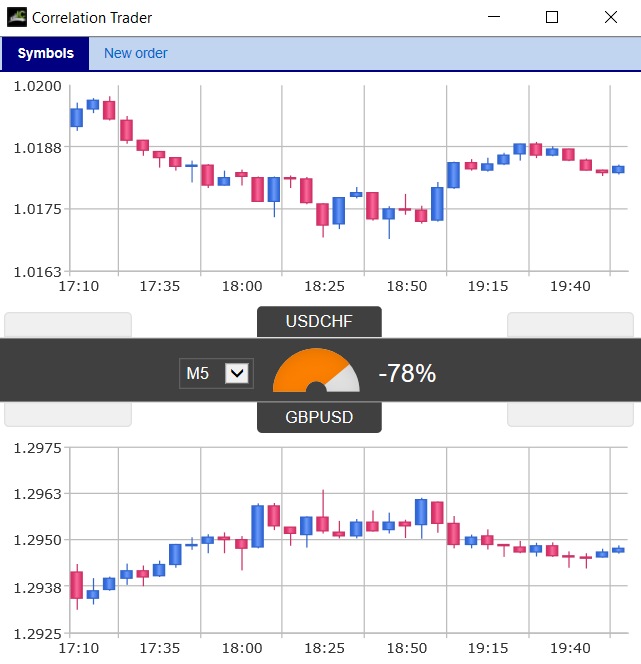
The bar in the middle lets you change the timeframe for the charts. It also shows the correlation between the two symbols over the selected timeframe, any open position in each symbol and its profitability. The correlation values (0 to ± 100) are identical to the Correlation Matrix.
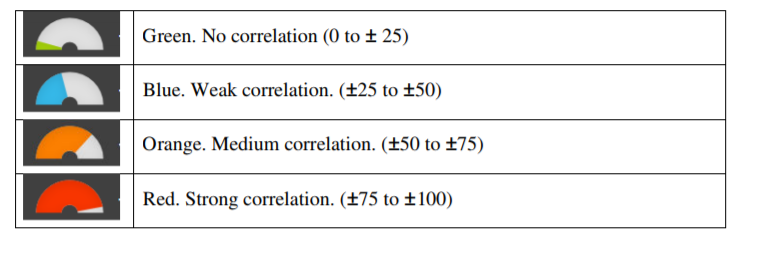
The colour of the gauge depends on the strength of the correlation:
Intermarket Analysis
Armed with a brief understanding of how some currency pairs correlate, adding additional intermarket correlations is the next step. Intermarket analysis is a branch of technical analysis that examines correlations between four major asset classes: stocks, bonds, commodities and currencies.
Commodities:
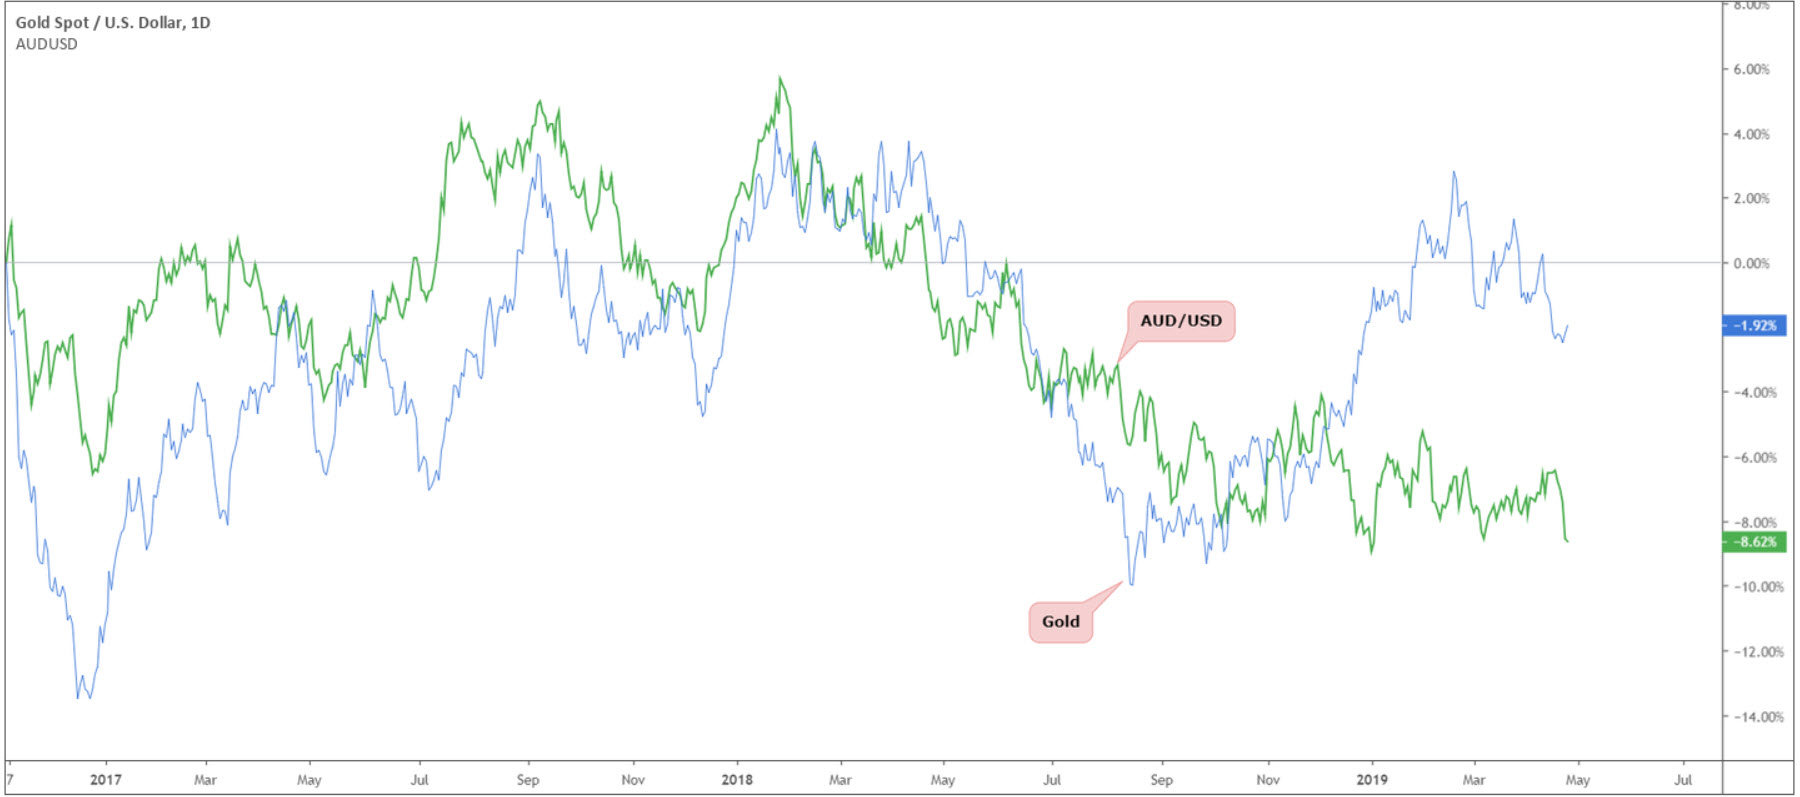
Gold:
Let’s begin by looking at everyone’s favourite yellow metal: gold.
The relationship between bullion and the AUD/USD pair remains a positive one. Behind China, Australia is the world’s second largest producer of gold. Australia produces around 295.6 tonnes, followed by Russia (270.7 tonnes) and the United States (230.0 tonnes). For that reason, when the price of gold rallies, the Aussie dollar tends to follow. Traders are, therefore, urged to try and avoid buying both the Aussie and gold simultaneously.
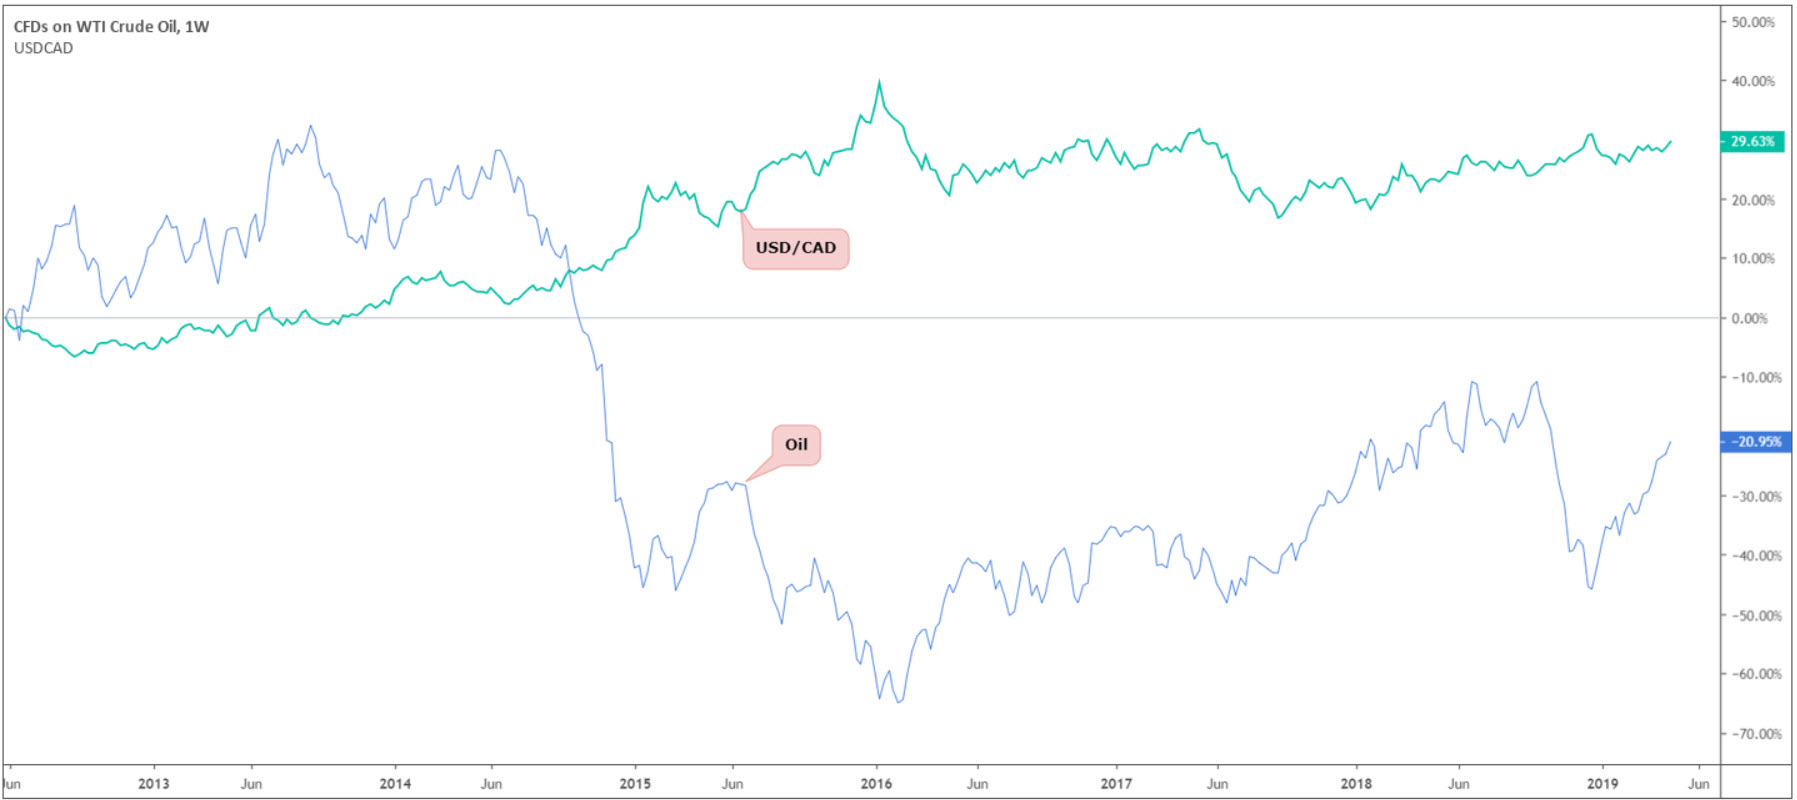
Oil:
Before looking at oil’s effect on currencies, an important link between oil and gold needs addressing: inflation.
As the price of crude rises, inflation also rises. Gold is known to be a good hedge against inflation and, therefore, the value of gold tends to increase when inflation rises. Over 60% of the time, gold and oil are said to have a positive relationship.
The price of oil also affects the USD/CAD currency pair. Canada is one of the top oil producers in the world, exporting over 3 million barrels of oil per day to the US. Due to this large volume, the Canadian dollar is in demand, i.e., a rally in oil tends to pull the Canadian dollar alongside it, and thus weighs on the USD/CAD.
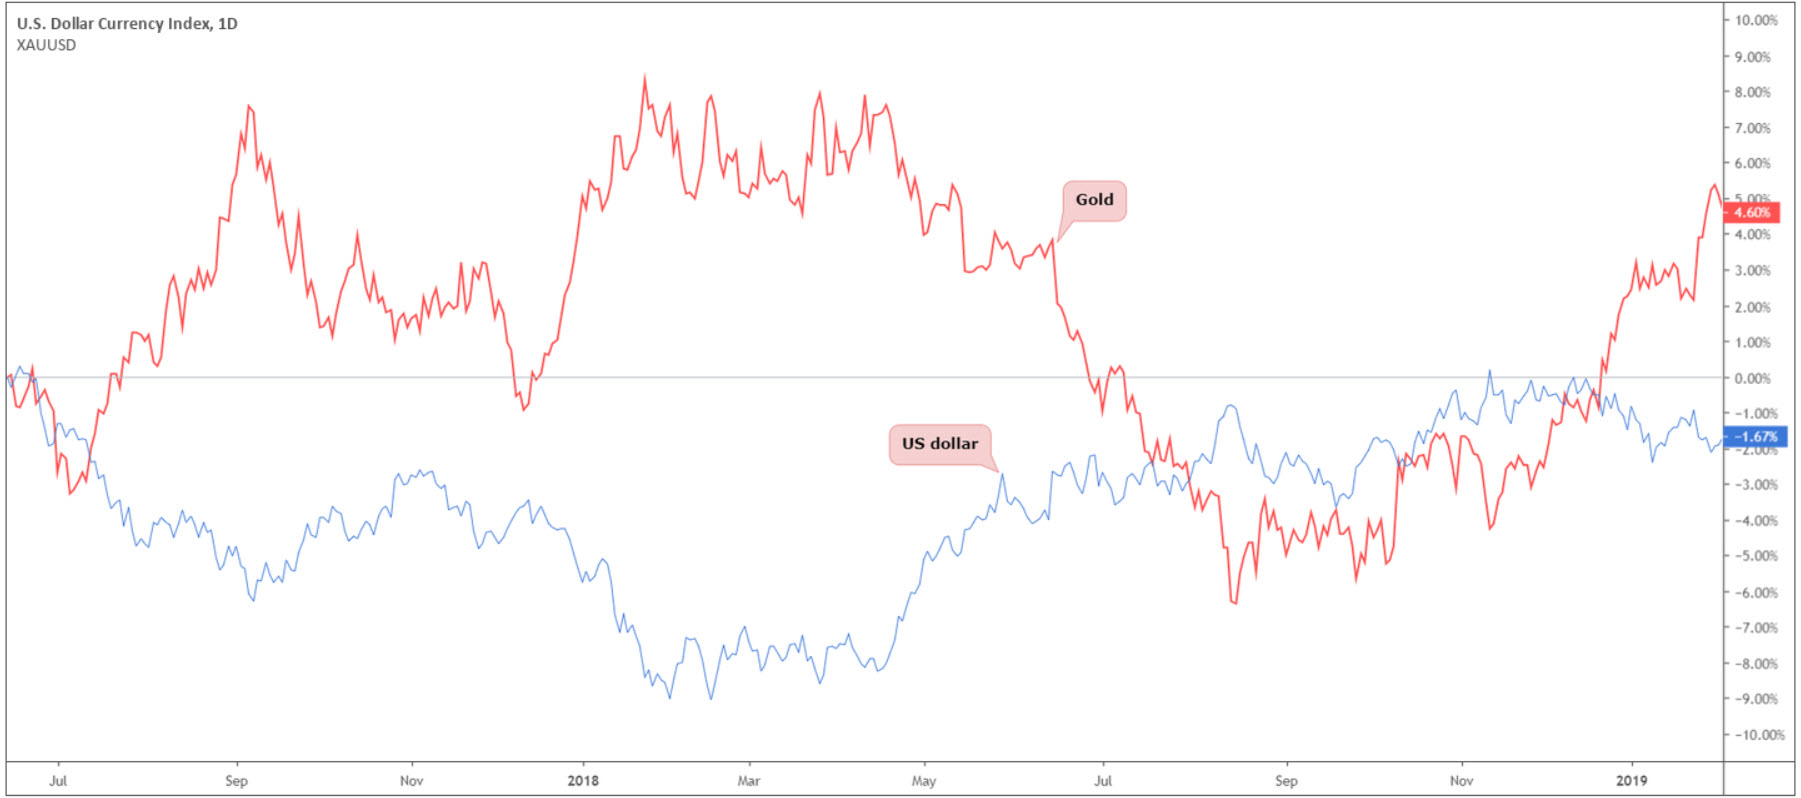
US dollar:
Gold also has an interesting relationship with the US dollar. When the dollar rises in value, the price of gold typically deteriorates. This inverse relationship remains because a falling dollar increases the value of other currencies, and thus increases the demand for gold. When the dollar starts to lose value, investors tend to look for alternative investments, with gold being one of those alternatives. During times of economic unrest, investors also tend to dump the dollar in favour of gold. Unlike other assets, gold maintains its intrinsic value.
Also of interest is the USD/JPY currency pair and gold. These two instruments continue to trade inversely. The strong correlation shows gold, alongside the Japanese yen is, in fact, viewed as a safe-haven asset.
Global stock indexes:
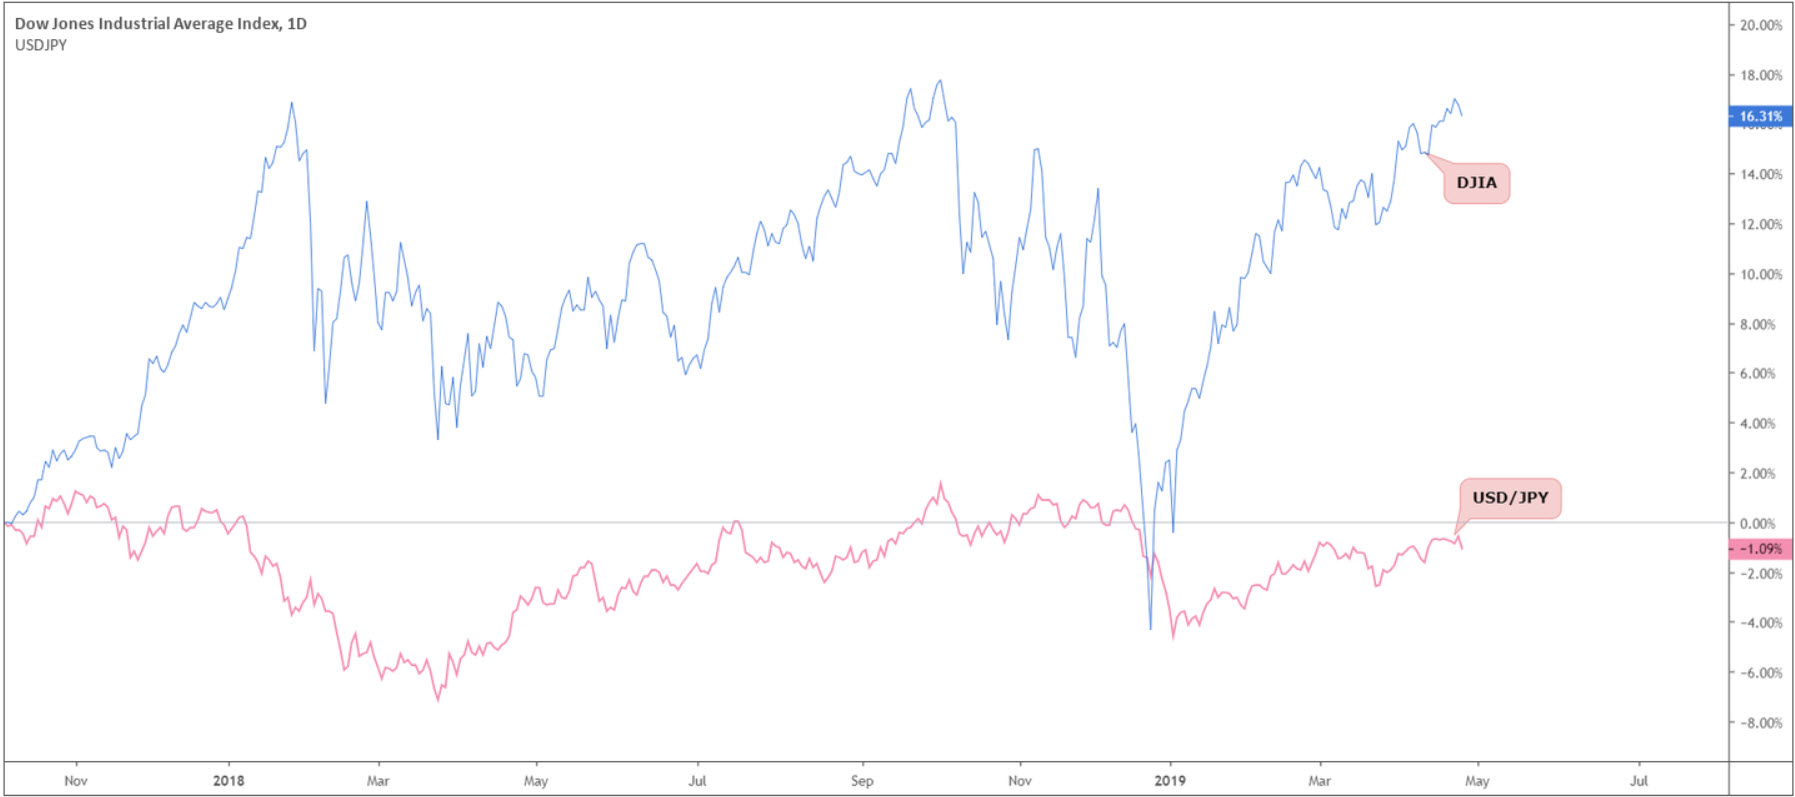
It might surprise some traders that there is a relationship present between the global stock markets and currencies.
The USD/JPY and the Dow Jones Industrial Average, for example, generally track each other’s movements. Why? It boils down to investor risk appetite. When traders feel optimistic about the global economy (the US in particular), they tend to bid both the dollar and stocks. Conversely, when global risks emerge, market participants typically sell equities and the dollar and buy safe-haven assets like gold and the Japanese yen. The correlation is not perfect, but it does tend to track each other close to 70% of the time.
Bonds:
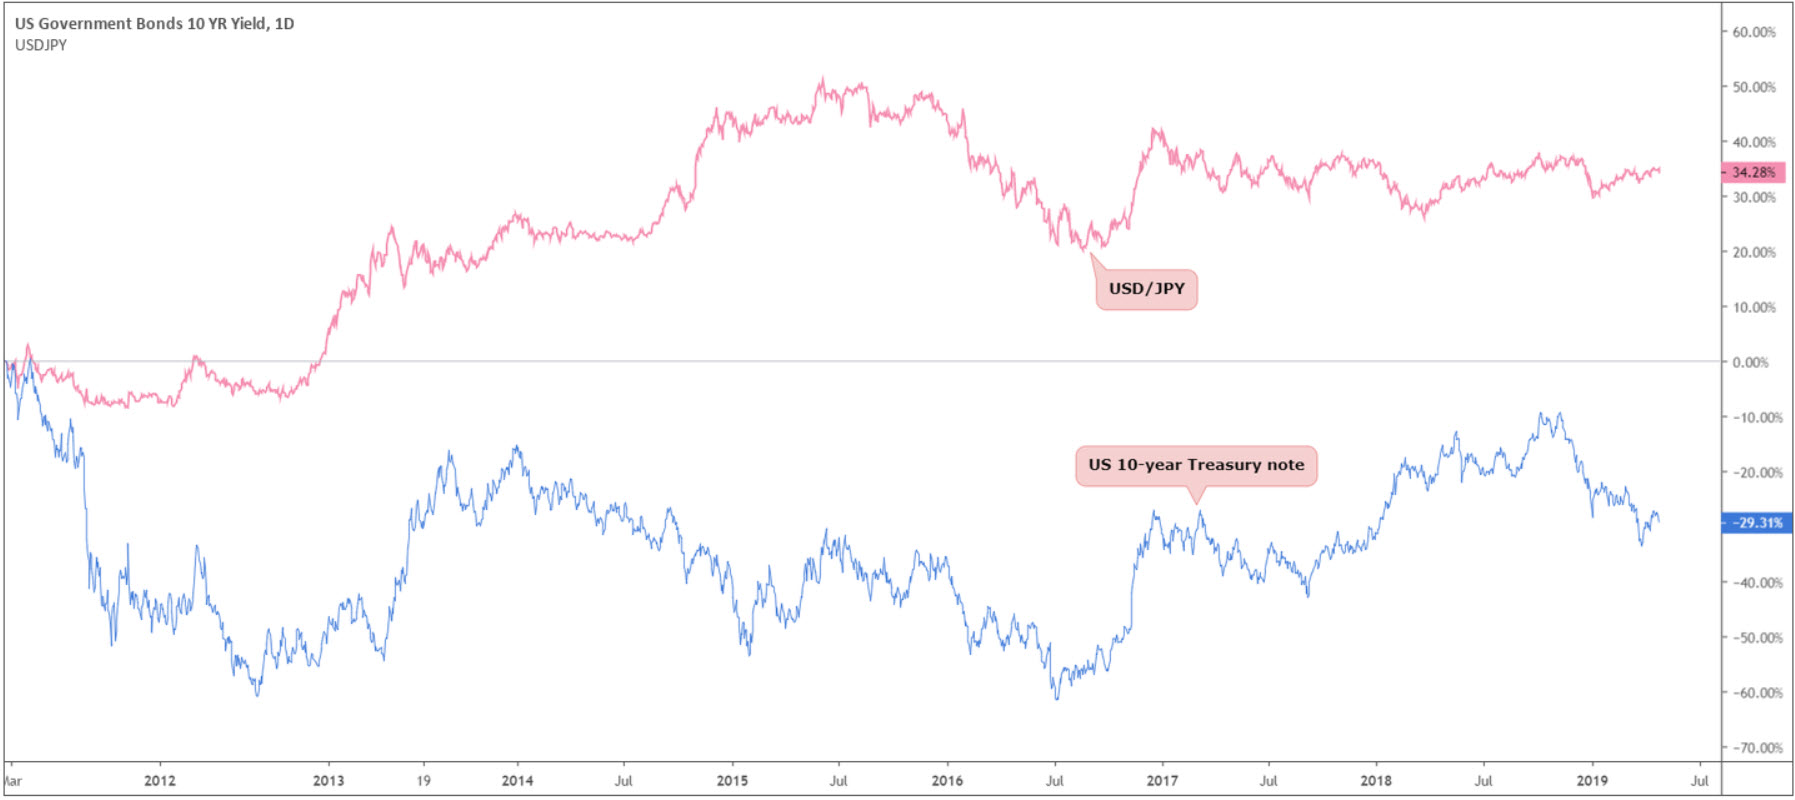
For the purpose of this article, the ten-year Treasury note will be the main focus. Basically, this instrument is a debt obligation issued by the US government that matures in ten years. It is, in effect, an ‘IOU’. So, what does this unit have to do with the currency market?
Falling treasury yields tend to be dollar negative, while rising treasury yields typically support the dollar. Bond yield refers to the rate of return, or interest, paid to the bondholder while the bond price is the amount of money the bondholder pays for the bond. Also, remember bond prices and bond yields are inversely correlated. Furthermore, government bond yields act as an indicator of the overall direction of the country’s interest rates and expectations.
Therefore, when the ten-year yield is on the rise, traders can expect the USD/JPY pair to generally follow suit – see chart below:
Further your understanding
The field of correlation analysis is vast and beyond the scope of an article.
The main objective here was to introduce the concept, illustrating basic correlations that have stood the test of time. This hopefully provided a foundation with which to work from to further your understanding.
Armed with basic knowledge of how markets intertwine, you’re now able to start avoiding trades that cancel each other out, diversify with minimal risk using markets with strong correlation and hedge exposure by hedging two markets that hold a near-perfect negative correlation.