
To say recent history has been an emotional roller-coaster for Bitcoin would be an understatement!
The market opened 2017 at a price of $966.0 and wrapped up the year at $18,960, carving out a whopping 1861.51% gain.
2018, however, has not been so kind. Deteriorating from its 2017 peak just south of the $20,000 mark to lows of $5858.6, the unit wiped approximately 70% off its value, as of current price.
Preceding these events Bitcoin was reasonably sedentary. In August 2008, the domain name bitcoin.org was quietly registered online. Two months later, a white paper was published: ‘Bitcoin: A Peer-to-Peer Electronic Cash System’ (https://bitcoin.org/bitcoin.pdf). On January 3, 2009, 30,000 lines of code spelt out the beginning of Bitcoin.
It’s widely thought Satoshi Nakamoto was a pseudonym used by the unknown person(s) who designed Bitcoin. Despite the anonymity, the unit has since evolved into the most capitalized and traded cryptocurrency in the world. Current numbers demonstrate a market cap of over $143 billion. As of writing, 17,290,900 million bitcoins are in circulation, against a presently capped limit of 21 million.
Bitcoin – and in particular blockchain – undoubtedly has the potential to revolutionize the financial services industry. A blockchain functions as a transparent digital ledger of economic transactions, recorded in chronological order that operates on a peer-to-peer network, or P2P. In its simplest form, P2P is created when two or more computers connect, enabling both to share resources (in this case bitcoins) without having to go through a separate server. Similar to traditional bank accounts, you can receive bitcoins to your Bitcoin address even if you’re offline.
Bitcoin: Investment or speculation?

Queries relating to Bitcoin’s worth as an investment or its use as a speculative instrument will likely differ depending on who you ask.
While a number of key players interact with the crypto market, two financial figures with conflicting views stand out:
- The chairman and CEO of Berkshire Hathaway, Warren Buffet, states ‘unlike buying stocks, bonds or real estate, Bitcoin is not an investment – it’s speculation.
- George Soros: the man who broke the Bank of England, despite being publicly dubious of Bitcoin in the past, has reportedly given his investment fund the green light for investing in crypto. However, they’ve yet to openly voice an investment on a specific project.
Key aspects driving Bitcoin price movement
Unlike fiat currencies (euro, US dollar and yen), bitcoins are digital coins not issued by any government or legal entity. Bitcoins rely on cryptographic protocols and a distributed network of users to mint, store and transfer.
Price/value is determined by a number of factors:
- Day traders – intraday speculation.
- Long-term speculators – buy and hold.
- Early adopters using the coin as a payment instrument.
- Vendors who accept the coin in exchange for products and services.
Supply and demand:
Like any other commodity, Bitcoin responds to supply and demand forces. The market value of Bitcoin – that is the price individuals and companies are willing to pay for it – fluctuates 24/7.
Based on the popularity of Bitcoin and trust among cryptocurrency community members, price was able to rapidly advance in 2017. With supply capped at 21 million, it is expected price will likely rebound from its 2018 lows in the future, though this remains heavily debated in the financial community.
News:
News about hacking, a number of government regulatory forces, well-known celebrities commenting on its movement/their investment plans, and scams, all contribute to Bitcoin price movement. Even the mildest rumour circulating the internet typically causes a noticeable effect.
Reports of exchange hacks in South Korea, India surveying transactions on multiple exchanges in order to collect tax revenue, a crackdown on exchanges in Japan, and China blocking more than 120 foreign cryptocurrency exchanges as part of the government’s broader crackdown, are just some of the news points that have affected crypto pricing in recent months.
Trade Bitcoin using technical analysis
In similar fashion to the foreign exchange market, Bitcoin appears ‘technical friendly’.
In fact, a number of technicians boast increased success in the crypto market.
The team’s objective here, therefore, is to highlight effective technical tools to tackle Bitcoin’s price movement, and ultimately profit. While there are a number of Bitcoin trading strategies littered throughout the internet, keeping things simple is key!
Despite the critics, technical trading is an extremely profitable endeavour, and it’s generally those who keep it simple that prosper in this domain.
Support and resistance, the backbone of many technical strategies, is crucial to understand. Knowing how to correctly plot support and resistance levels on a chart will put you light-years ahead of the competition.
The chart posted below emphasises robust support and resistance levels on the daily timeframe of BTC/USD (Bitcoin vs. the US dollar), offering traders a number of opportunities to participate in the market. Note each level boasts historical significance.
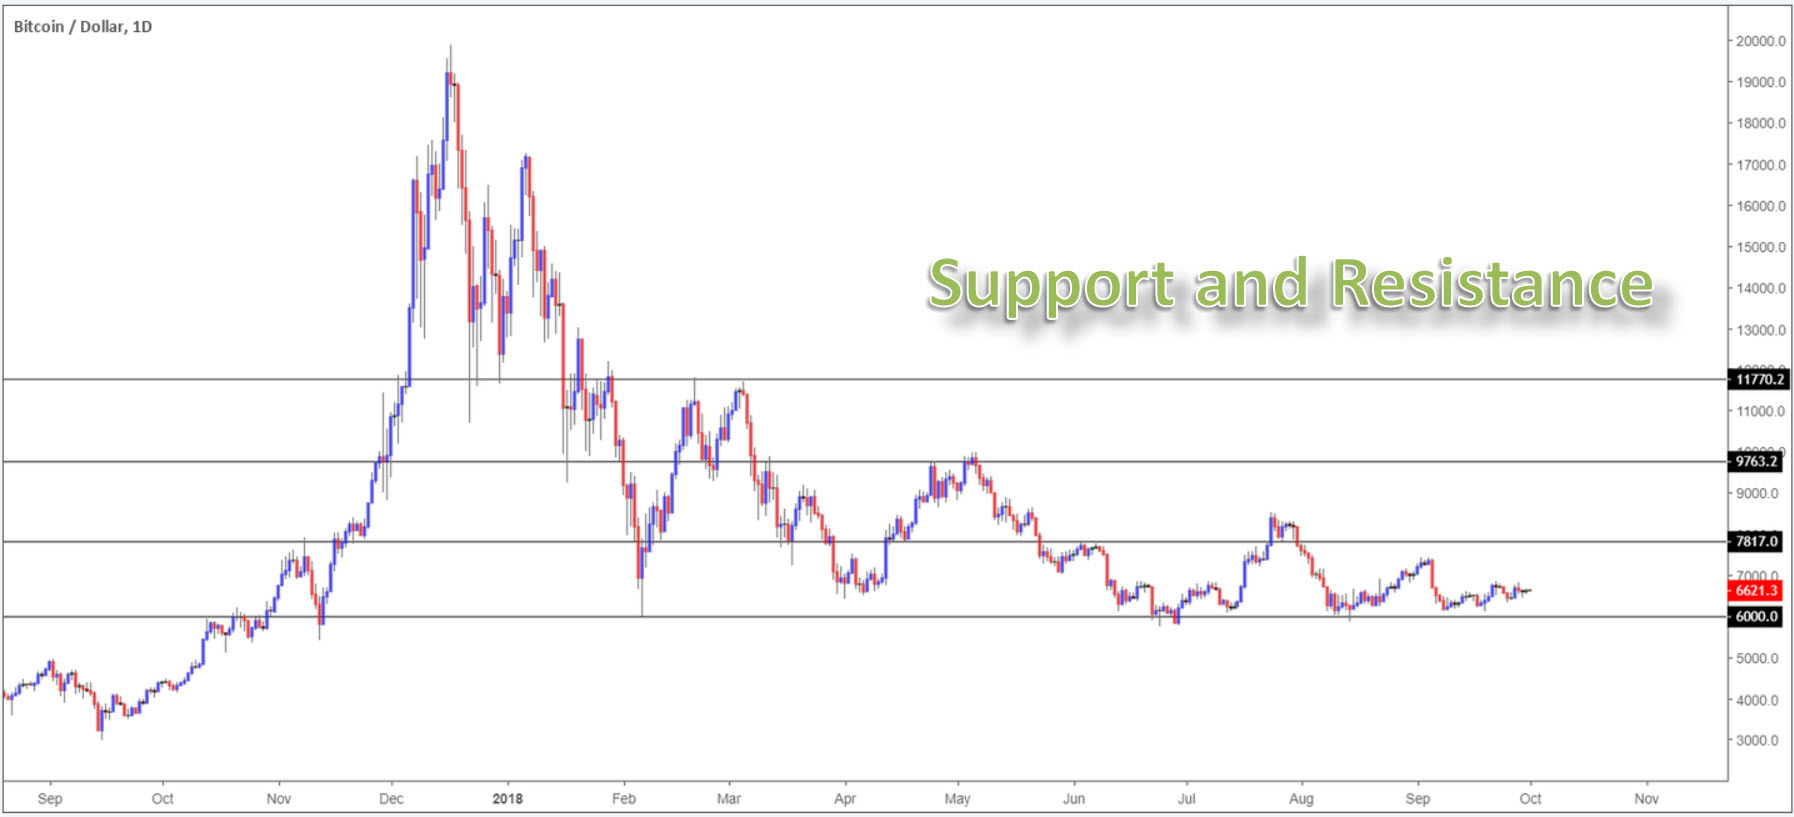
A support level denotes a ‘floor’ of a market, whereas a resistance level represents a ceiling. Note the $6000.0 mark on Bitcoin (also a psychological level) is a key barrier of support, rejecting price on a number of occasions in the past, and recently in August 2018. $7817.0 also established a point of resistance in the early stages of 2017, and has served the market as both support and resistance going forward.
At its most basic, a level of support is where downside is capped due to buying. A resistance level is similar, only inverse. Instead of buying activity, it is selling that holds the level firm. Traders use this understanding of market psychology as a means of initiating a foundation to trade.
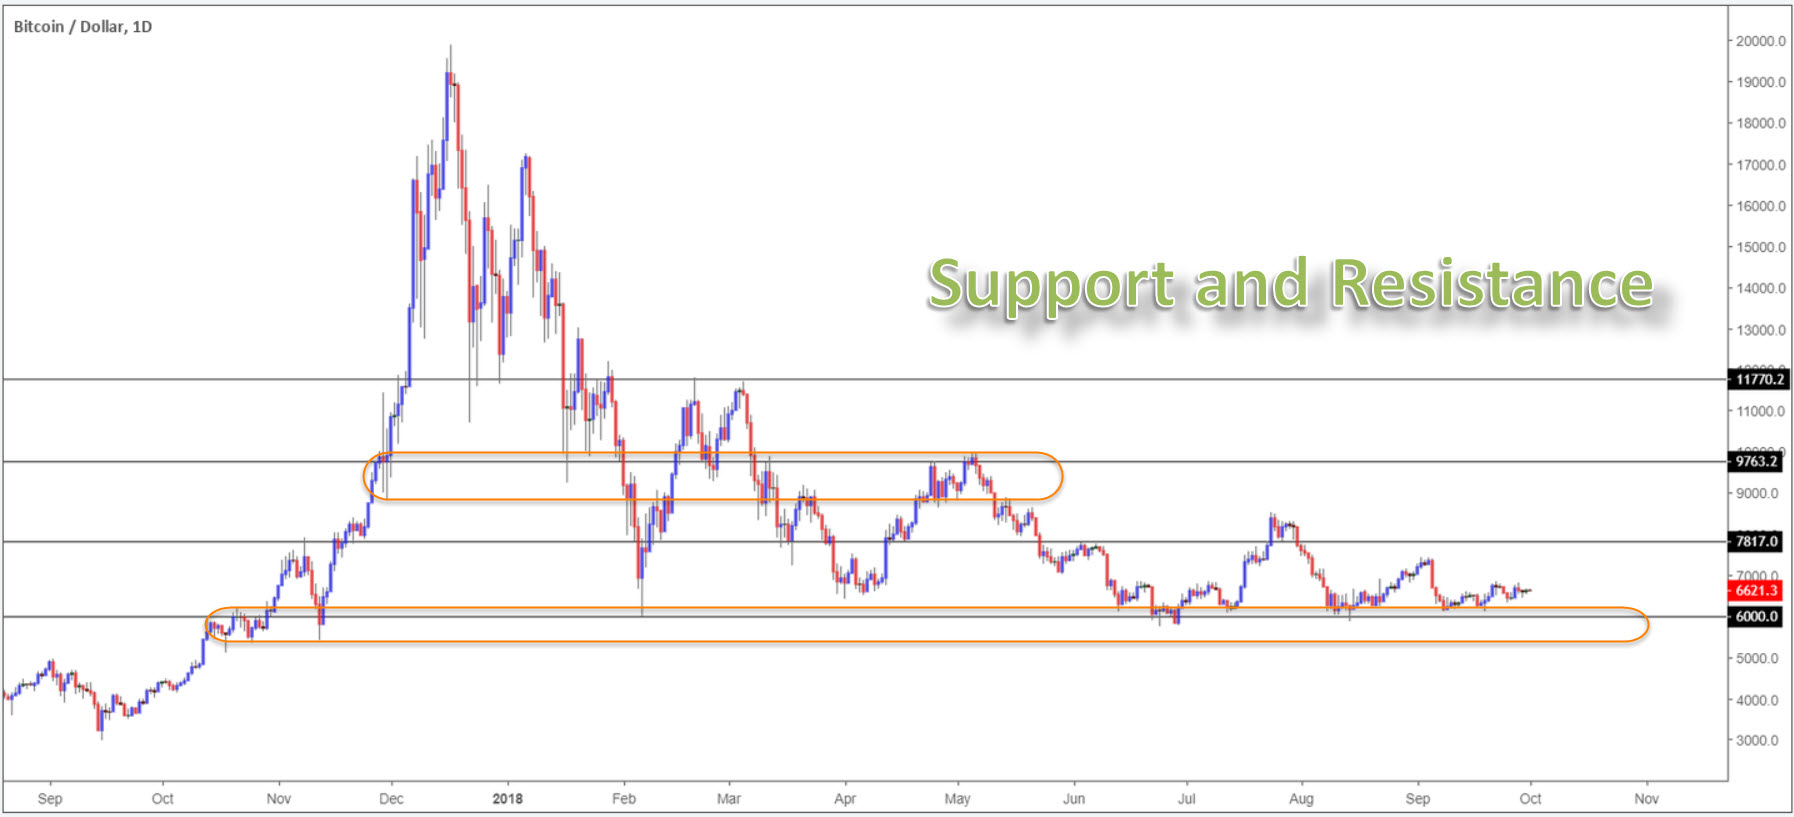
As demonstrated on the chart below, to draw effective support and resistance levels, traders should view support and resistance points as zones (marked in orange), and not defined price points. Adopting the use of a zone in place of a fixed level gives trades room to breathe. Support and resistance levels are seldom respected to the pip, and this is where the majority of traders are usually trapped and stopped out.
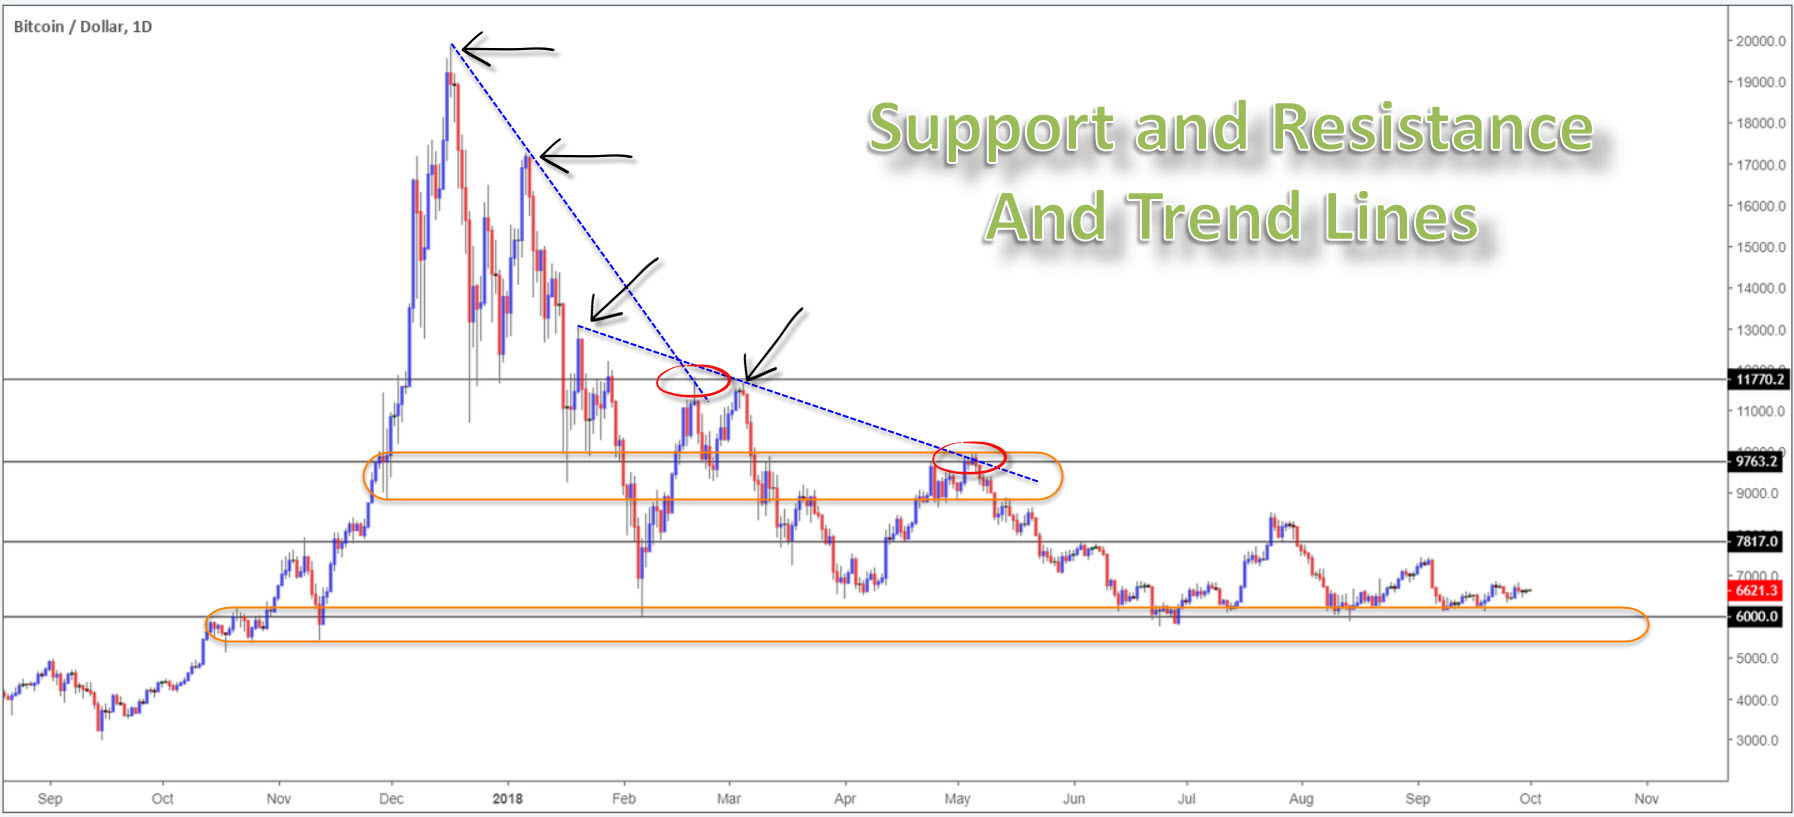
Trend lines are another key aspect to consider. When merging with noteworthy support and resistance levels, killer trading is possible.
By definition, trend lines are barriers drawn at an angle above or below price. An ascending trend line forms by connecting two or more low points. The second low must be higher than the first for the line to have a positive slope, i.e., a higher low. Note at least two points should connect before the line is considered valid. The same is said for descending trend lines, only inverse.
Do you use the candle wicks/tails or the bodies to draw these lines?
This is a question that crops up all the time. And the answer is simple: use both! Adopting both the candle extremes and the bodies allows market participants to pencil in a buffer, so to speak. Like support and resistance levels, considering a trend line as a definitive price point is a challenge. It should always be drawn in as an area.
Using the same timeframe, two high-probability trades are observed on the chart below at points where a descending trend line and support/resistance intersect (red circles):
As humans we love to overcomplicate things!
While an elaborate trading strategy may impress your family and friends, it is unnecessary to succeed. That can be said for any market.
For those involved in the markets for a while will already know keeping things simple is a MUST in trading. And that’s why trend lines and support and resistance levels remain a favourite among the technical community. Both are relatively easy to apply and offer high-probability turning points.
The only other point traders are urged to include is trend direction. As you can see on the chart above, both trading opportunities were alongside the predominant trend. Folks who feel they need additional confirmation on top of this, however, may want to consider Fibonacci calculations, specifically the 38.2% and 61.8% values.
This, by and of itself, is sufficient enough to achieve success in the cryptocurrency markets:
- Support and resistance levels.
- Trend lines.
- Trend direction.
- Fibonacci calculations (optional).
The advantages of trading Bitcoin with IC Markets
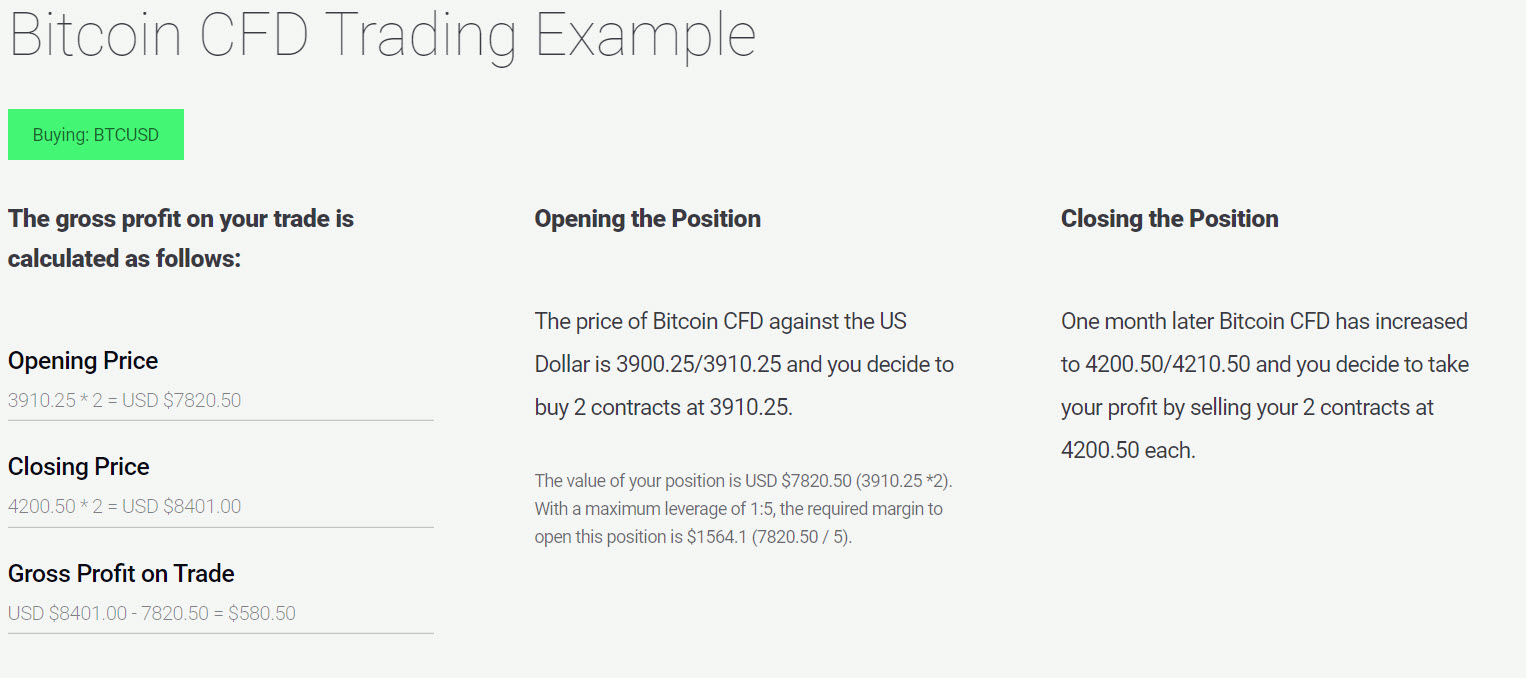
- Leverage up to 1:5
- Trade the market 24/5
- Trade long or short
- ASIC regulated
- No commissions
- Live support
Entering the world of digital currencies for the first time is overwhelming and stressful.
IC Markets, however, removes this element, offering a straightforward process from start to finish.
IC Markets offers some of the tightest spreads in the industry, leverage up to 1:5, superior execution and to-the-pip pricing from tier-1 banks.
IC Markets cryptocurrency CFD products also allows traders to go long/short without taking ownership of the cryptocurrency. This means traders can obtain exposure to cryptocurrencies without the worry of security risks associated with storing it, and counterparty risk from the exchange.
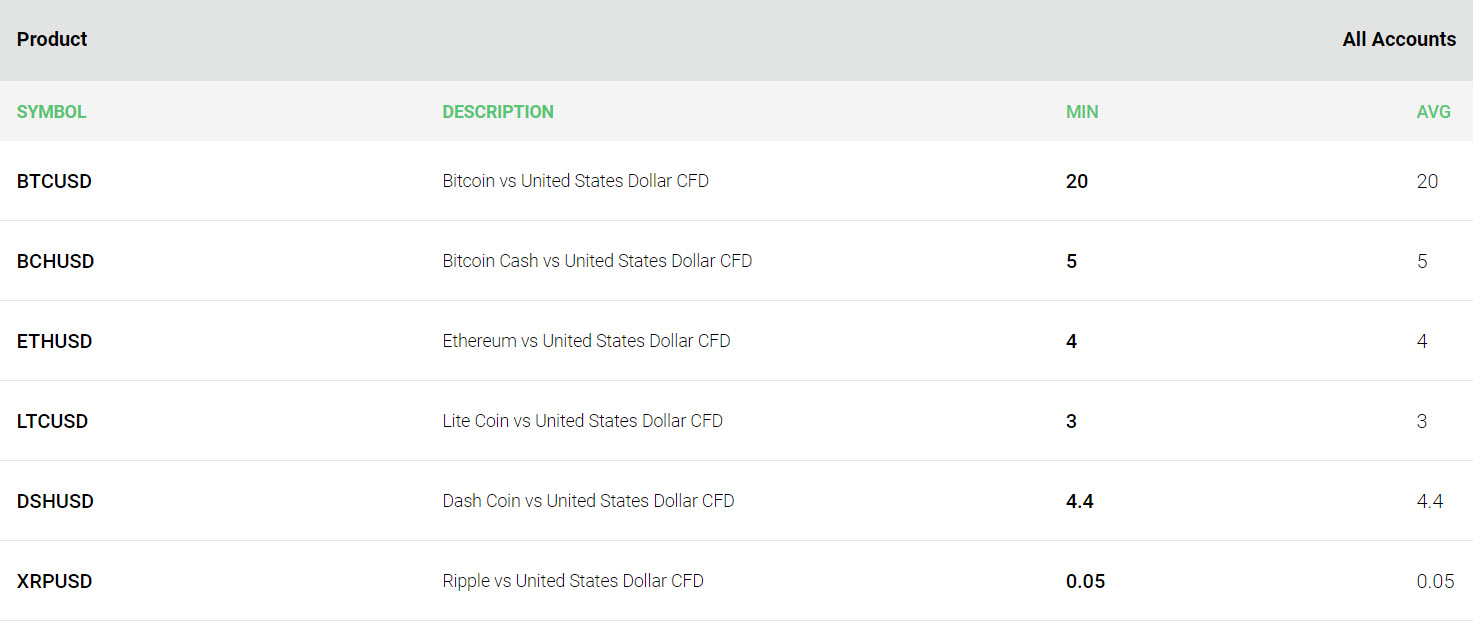
IC Markets offers 6 cryptocurrency CFDs, available to trade against the US dollar, including Bitcoin and Bitcoin cash. Below is a list of the associated ticker symbols along with minimum and average spreads:
IC Markets’ mission is clear: create a user-friendly transparent trading environment for retail and institutional clients, allowing traders to focus on what’s important: trading.
Feel free to test drive Bitcoin’s market using our award-winning MT4 or MT5 platforms: https://www.icmarkets.com/en/open-trading-account/demo. Due to its ease of use, feature rich environment and automated trading ability you won’t be disappointed!