
Waiting for lower timeframe confirmation is our main tool to confirm strength within higher timeframe zones, and has really been the key to our trading success. It takes a little time to understand the subtle nuances, however, as each trade is never the same, but once you master the rhythm so to speak, you will be saved from countless unnecessary losing trades. The following is a list of what we look for:
- A break/retest of supply or demand dependent on which way you’re trading.
- A trendline break/retest.
- Buying/selling tails/wicks – essentially we look for a cluster of very obvious spikes off of lower timeframe support and resistance levels within the higher timeframe zone.
- Candlestick patterns. We tend to stick with pin bars and engulfing bars as these have proven to be the most effective.
We typically search for lower-timeframe confirmation between the M15 and H1 timeframes, since most of our higher-timeframe areas begin with the H4. Stops are usually placed 1-3 pips beyond confirming structures.
EUR/USD:
As anticipated, H4 action failed to sustain gains above the mid-level support at 1.1250 yesterday, consequently bringing the unit back down to the 1.12 handle by the closing bell. Technically speaking, we would not be surprised to see the pair continue lower. Our reasoning lies within the higher-timeframe structure. Not only do we have a major weekly supply in play at 1.1533-1.1278, but we also see that there’s a daily supply in motion that’s glued to the underside of this weekly zone at 1.1327-1.1253. The closest higher-timeframe support target can be seen on the daily timeframe at 1.1142.
Our suggestions: Selling beyond 1.12 is an option today, but do take into account that this would only leave one 50 pips of room to play with down to the H4 mid-level support 1.1150, which is where we would look to take full profit given the confluence surrounding this barrier. To take advantage of this move, we’d recommend waiting for a H4 close beyond 1.12 that’s followed up with a retest and a lower-timeframe confirming signal. This could be either an engulf of demand followed by a retest of this area as supply, a trendline break/retest or simply a well-defined collection of selling wicks off of 1.12. We typically search for lower-timeframe confirmation between the M15 and H1 timeframes, since most of our higher-timeframe areas begin with the H4. Stops are usually placed 1-3 pips beyond confirming structures.
Not only is 1.1150 a take-profit zone, it’s also a nice area to look for buying opportunities. The base offers the following structures:
- A H4 trendline support taken from the high 1.1268.
- A H4 trendline support etched from the low 1.1075.
- A H4 61.8% Fib support at 1.1155 drawn from the low 1.1074.
- A H4 78.6% retracement level pegged at 1.1147 penciled in from the low 1.1109.
- A daily support level seen at 1.1142.
Seeing as how this zone is rather small, we will not be placing pending buy orders here. Instead, we’ve chosen to wait for a reasonably sized H4 bull candle to form, preferably a full-bodied candle. This will help prove buyer interest exists here which IS needed due to where price is trading from on the weekly chart right now.
Data points to consider: No high-impacting news events.

Levels to watch/live orders:
- Buys: 1.1150 region ([waiting for a reasonably sized H4 bull candle – preferably a full-bodied candle – to form before pulling the trigger is advised] stop loss: ideally beyond the candle’s tail).
- Sells: Watch for H4 price to engulf 1.1250 and then look to trade any retest seen thereafter ([waiting for a lower-timeframe confirming signal to form following the retest is advised] stop loss: dependent on where one confirms this level).
GBP/USD:
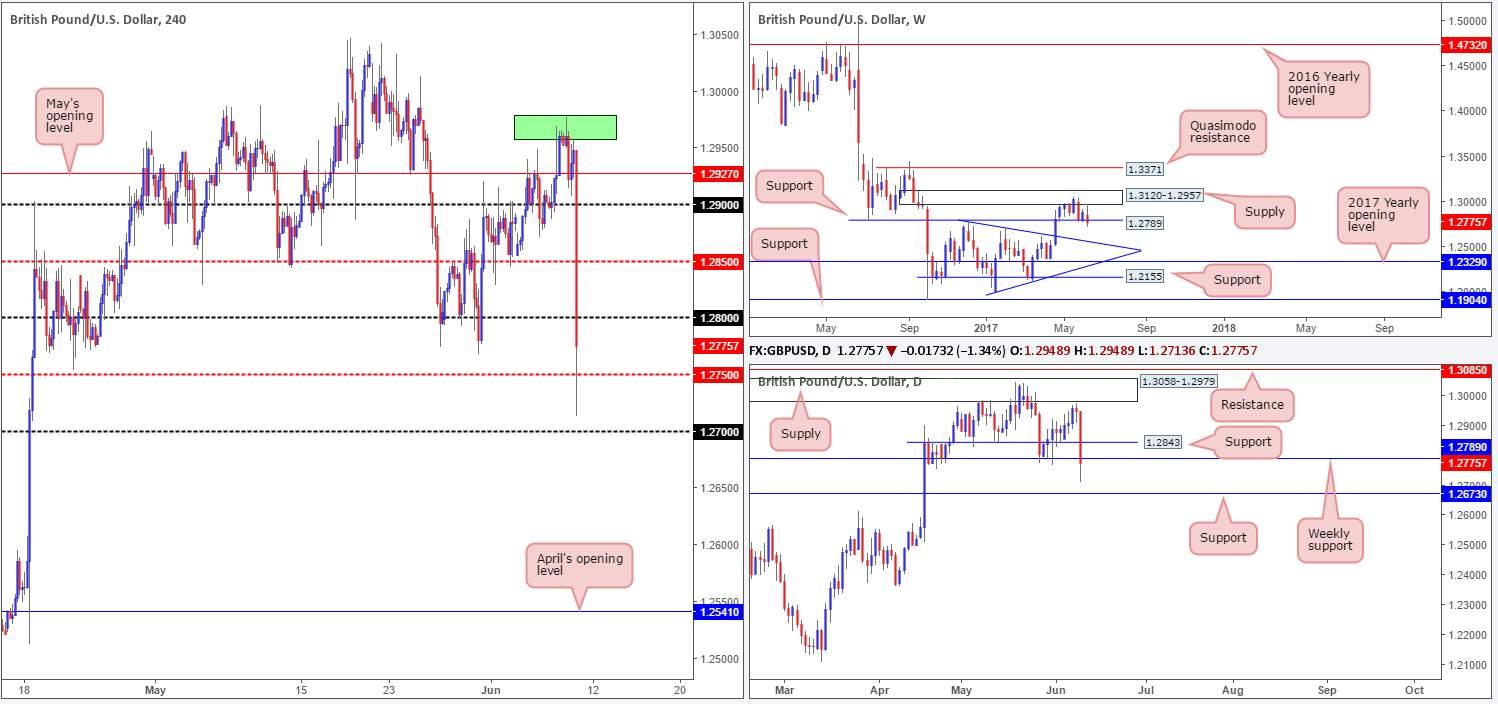
After stabilizing within the noted green area on the H4 chart at 1.2957/1.2979, the bears turned lower going into the London open yesterday. For those who did not manage to catch Thursday’s report, this H4 zone is formed by the underside of both the current weekly and daily supplies.
In recent hours however, the GBP has plummeted over 200 pips as the UK election shows that the risk of a hung parliament is now high. Well done to any of our readers who managed to take a short position from within 1.2957/1.2979!
Our suggestions: Given that the UK elections are still in motion, we will not be taking any setups, be it long or short, on GBP-related pairs today. As we mentioned in yesterday’s report, ‘acting in your own best interest’ is key to success in this business and sometimes the best position is NO position.
Data points to consider: UK elections. UK manufacturing production at 9.30am GMT+1.
Levels to watch/live orders:
- Buys: Flat (stop loss: N/A).
- Sells: Flat (stop loss: N/A).
AUD/USD:
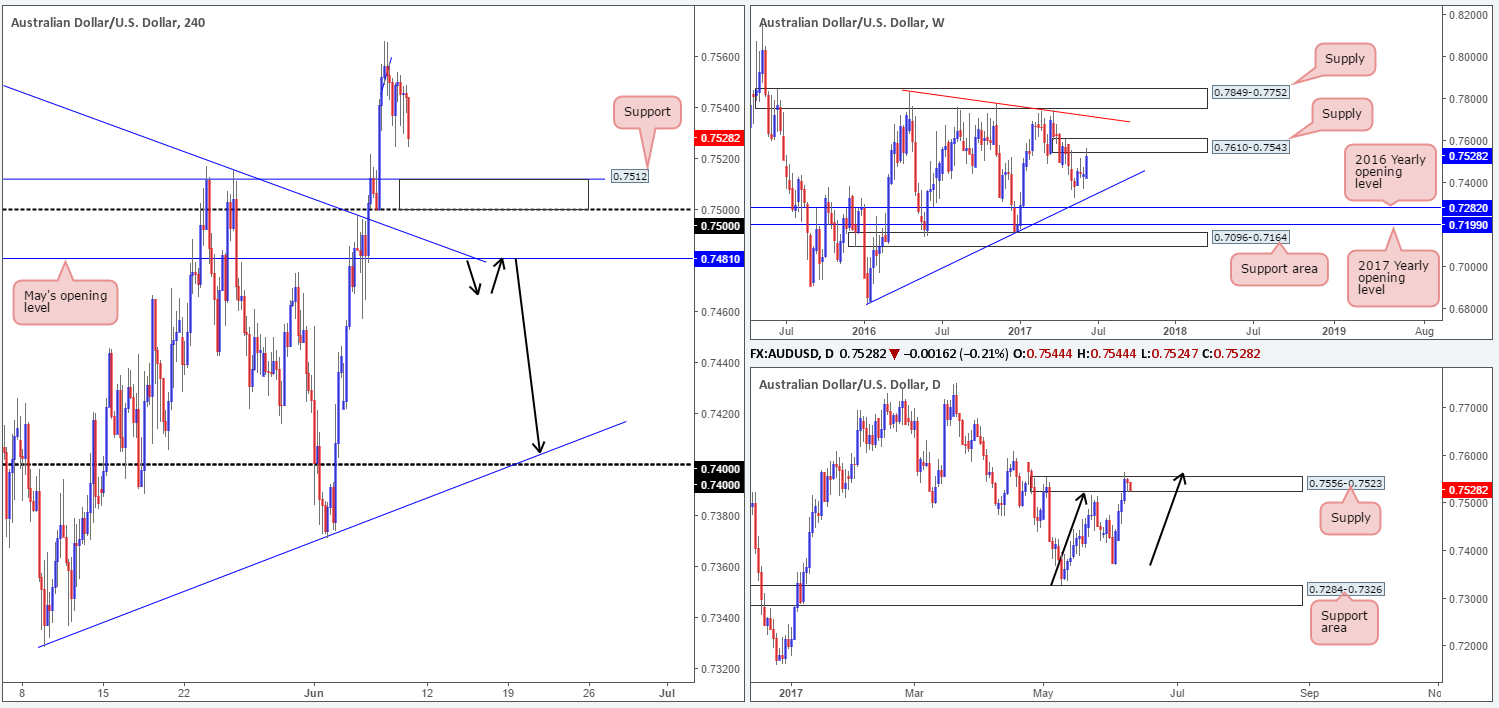
In view of weekly price recently shaking hands with supply coming in at 0.7610-0.7543, the sellers have begun to show interest. In conjunction with weekly flow, daily action recently whipsawed above supply formed at 0.7556-0.7523 and touched base with an AB=CD bearish completion point (see black arrows) at 0.7563 (taken from the low 0.7328). This move likely took out a truckload of buy stops from above the said supply and thus provided enough liquidity for the big boys to sell into.
Moving across to the H4 candles, the sellers look poised to attack the 0.75/0.7512 barrier, followed closely by May’s opening level at 0.7481 which intersects with a H4 trendline support taken from the high 0.7556. With the higher timeframes indicating lower prices are likely on the cards, these H4 supports will likely be taken out. However, selling right now is challenging since (although we believe these H4 areas to be vulnerable) there’s always that chance that they could hold and bounce price enough to stop us out!
Our suggestions: Wait for H4 price to engulf 0.7481 before looking to sell this market. Beneath this number we do not see a whole stopping the unit from reaching the 0.74 neighborhood. A retest of 0.7481 following the break would be an ideal scenario to short, as per the black arrows.
Data points to consider: Chinese inflation figures at 2.30am GMT+1.
Levels to watch/live orders:
- Buys: Flat (stop loss: N/A).
- Sells: Watch for H4 price to engulf 0.7481 and then look to trade any retest thereafter ([waiting for a reasonably sized H4 bearish candle to form – preferably a full-bodied candle – following the retest is advised] stop loss: ideally beyond the candle’s wick).
USD/JPY:
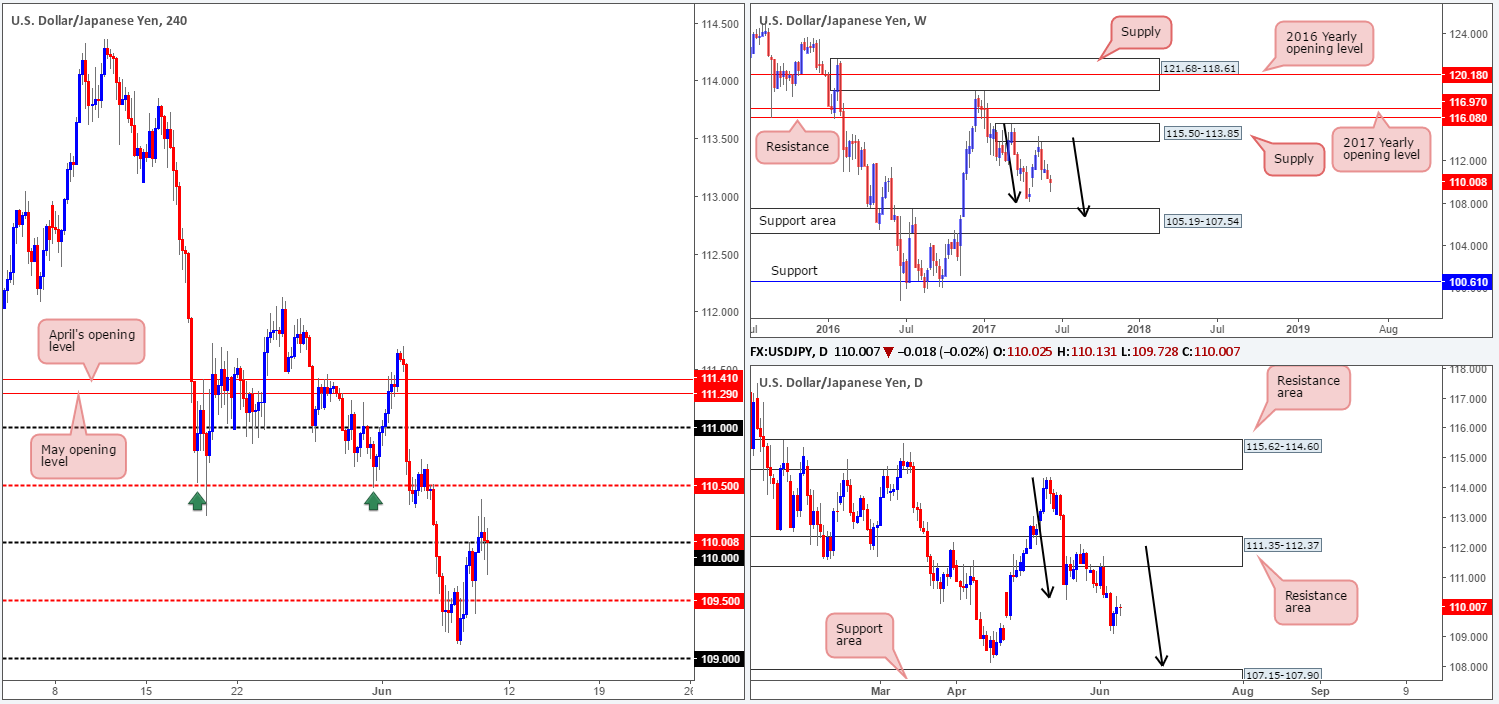
During the course of yesterday’s sessions, we saw the USD/JPY half-heartedly break above the 110 handle and clock a high of 110.38, before turning lower and retesting 110. Despite the bulls recently showing interest from just ahead of 109, our team remains biased to the downside for the time being.
Weekly bears continue to remain in a relatively strong position after pushing aggressively lower from supply registered at 115.50-113.85. We know there’s a fair bit of ground to cover here, but this move could possibly result in further downside taking shape in the form of a weekly AB=CD correction (see black arrows) that terminates within a weekly support area marked at 105.19-107.54 (stretches all the way back to early 2014). In conjunction with weekly flow, daily price also shows a potential AB=CD correction in the works taken from the high 114.36, which could see price drive lower to 107.15-107.90: a support zone that’s glued to the top edge of the said weekly support area.
Our suggestions: With that, we feel the H4 mid-level resistance 110.50 is a possible level to sell from given how well it held as support throughout May (see green arrows). To prove seller interest, however, we would advise waiting for a reasonably sized H4 bearish candle to take shape, preferably a full-bodied candle.
Data points to consider: No high-impacting news events.
Levels to watch/live orders:
- Buys: Flat (stop loss: N/A).
- Sells: 110.50 region ([waiting for a reasonably sized H4 bear candle – preferably a full-bodied candle – to form before pulling the trigger is advised] stop loss: ideally beyond the candle’s wick).
USD/CAD:
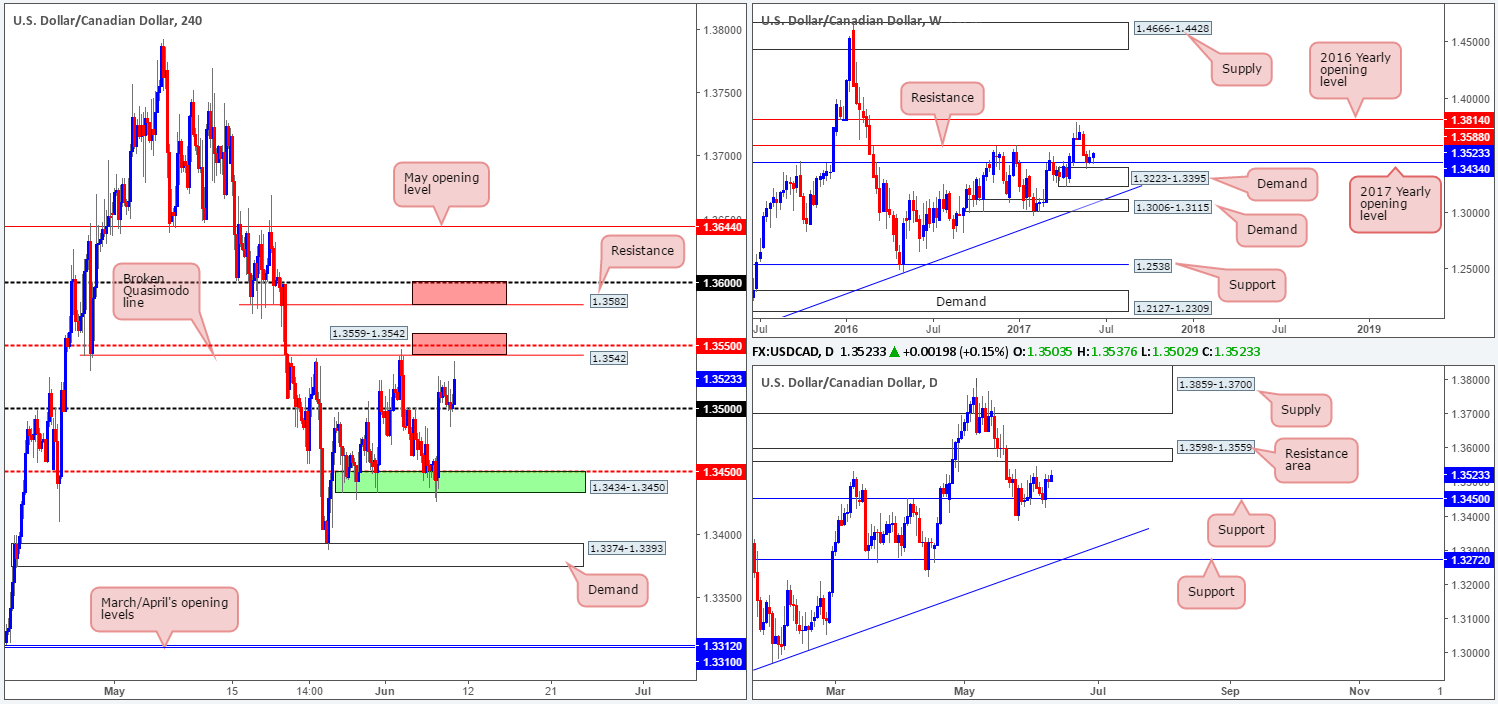
From the weekly picture this morning, the pair is seen trading from the 2017 yearly opening level at 1.3434. Should the bulls continue to press higher from here, the next line of trouble can be seen around a resistance level pegged at 1.3588. Down on the daily timeframe, price is seen trading within shouting distance of a resistance area at 1.3598-1.3559, which, as you can probably see, encapsulates the said weekly resistance line mentioned above at 1.3588.
Over on the H4 chart, the 1.35 handle came into play yesterday, holding nicely as support. This lifted the unit up to within an inch of a broken Quasimodo line at 1.3542, followed closely by a mid-level resistance penciled in at 1.3550. These two levels, coupled with the underside of the daily resistance area at 1.3559, form a potential sell zone (lower red zone). However, it might also be worth noting that the H4 resistance seen above this area at 1.3582 could also be targeted given that it’s positioned so closely to weekly resistance visible at 1.3588 and the 1.36 handle (upper red zone).
Our suggestions: Watch for lower-timeframe confirmed (see the top of this report) shorting opportunities around 1.3559-1.3542. Should this area be engulfed, however, we’ll then shift our focus up to 1.36/1.3582 neighborhood.
Data points to consider: Canadian employment figures at 1.30pm GMT+1.
Levels to watch/live orders:
- Buys: Flat (Stop loss: N/A).
- Sells: 1.3559-1.3542 ([waiting for a lower-timeframe sell signal to form before pulling the trigger is advised] stop loss: dependent on where one confirms this area). 1.36-1.3582 ([waiting for a lower-timeframe sell signal to form before pulling the trigger is advised] stop loss: dependent on where one confirms this area).
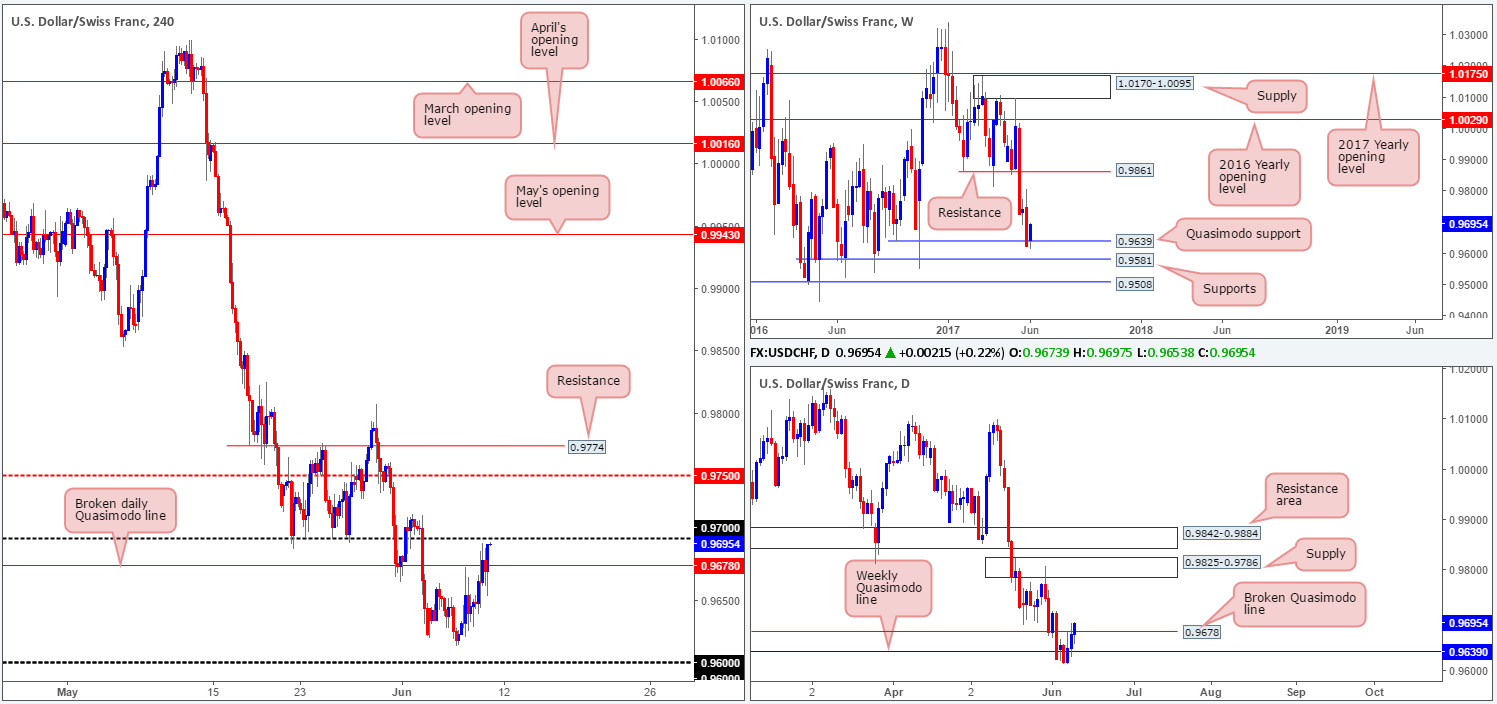
USD/CHF:
Leaving the 0.96 handle unchallenged, the Swissy has begun to gravitate north, recently trading above the daily broken Quasimodo level at 0.9678 and coming within inches of the 0.97 handle. Having seen the weekly Quasimodo support level at 0.9639 hold steady, this could encourage further buying in this market, at least until we reach the daily supply pegged at 0.9825-0.9786.
Before our team considers longs, nonetheless, we would like to see a decisive H4 close form above the 0.97 handle. Clearing offers from this level would likely open the runway north up to at least the H4 mid-level resistance at 0.9750, followed closely by H4 resistance marked at 0.9774. Notice that both of these H4 levels are positioned relatively close to the underside of the daily supply mentioned above at 0.9825-0.9786.
Our suggestions: Watch for a H4 close above 0.97 that’s followed up with a retest. Should the retest hold firm and print a reasonably sized H4 bull candle (a full-bodied candle would be ideal), our desk would look to trade long and target 0.9750/0.9744.
Data points to consider: No high-impacting news events.
Levels to watch/live orders:
- Buys: Watch for H4 price to engulf 0.97 and then look to trade any retest thereafter ([waiting for a reasonably sized H4 bullish candle to form – preferably a full-bodied candle – following the retest is advised] stop loss: ideally beyond the candle’s tail).
- Sells: Flat (stop loss: N/A).
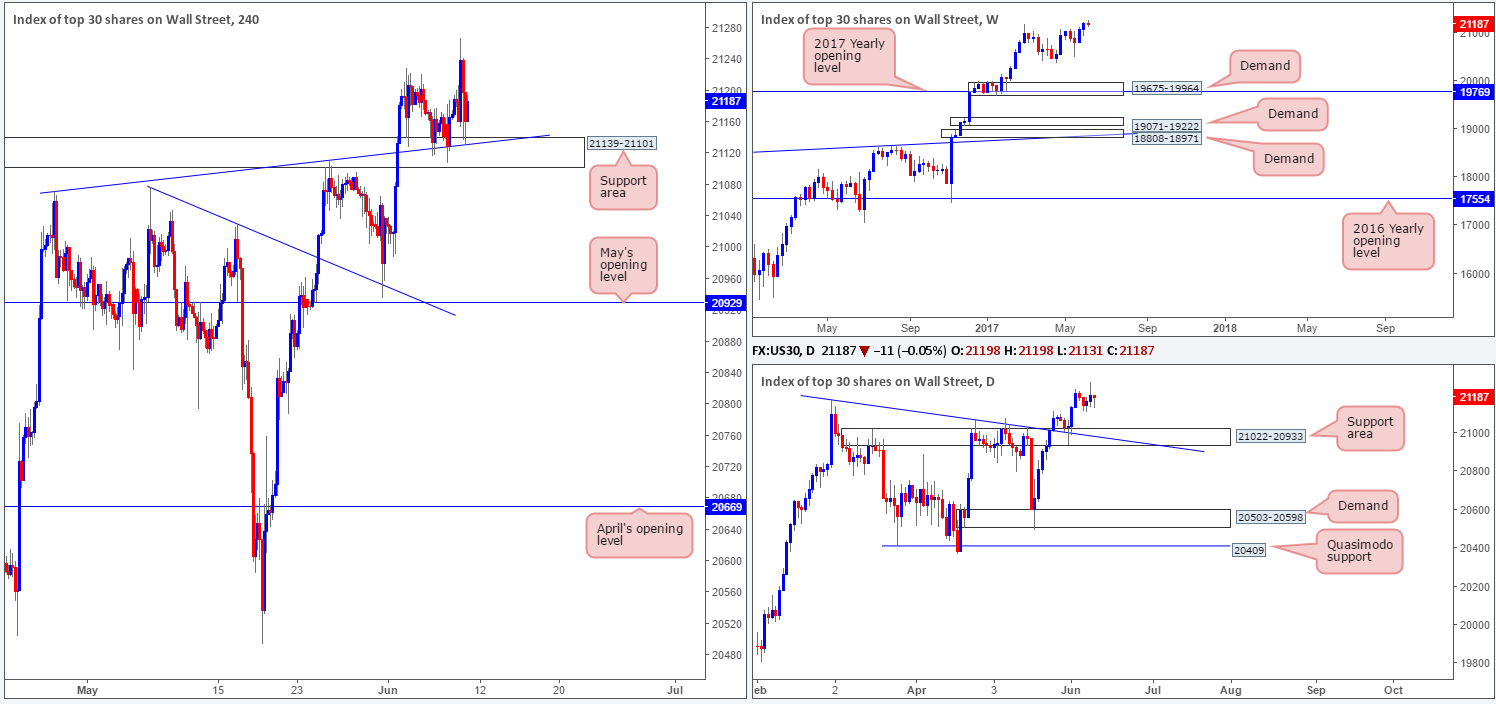
DOW 30:
The H4 support area at 21139-21101 (converges with a H4 trendline support etched from the high 21072), as you can see, remains in a stable position. It has withstood several bearish attacks and shows promise to continue holding firm. On Wednesday, we mentioned that our desk had taken a small long position at 21164 and placed stops below the said H4 support area at 21097. The position is still active, but we have now liquidated 50% of the trade around the 21234 neighborhood. The stop-loss order remains in place.
As mentioned in yesterday’s report, we see absolutely no higher-timeframe resistance ahead, so further buying is what we expect to be seen in the week ahead.
Our suggestions: Essentially, what we’re looking for here is trend continuation.
Data points to consider: No high-impacting news events.
Levels to watch/live orders:
- Buys: 21164 ([live] stop loss: 21097).
- Sells: Flat (stop loss: N/A).
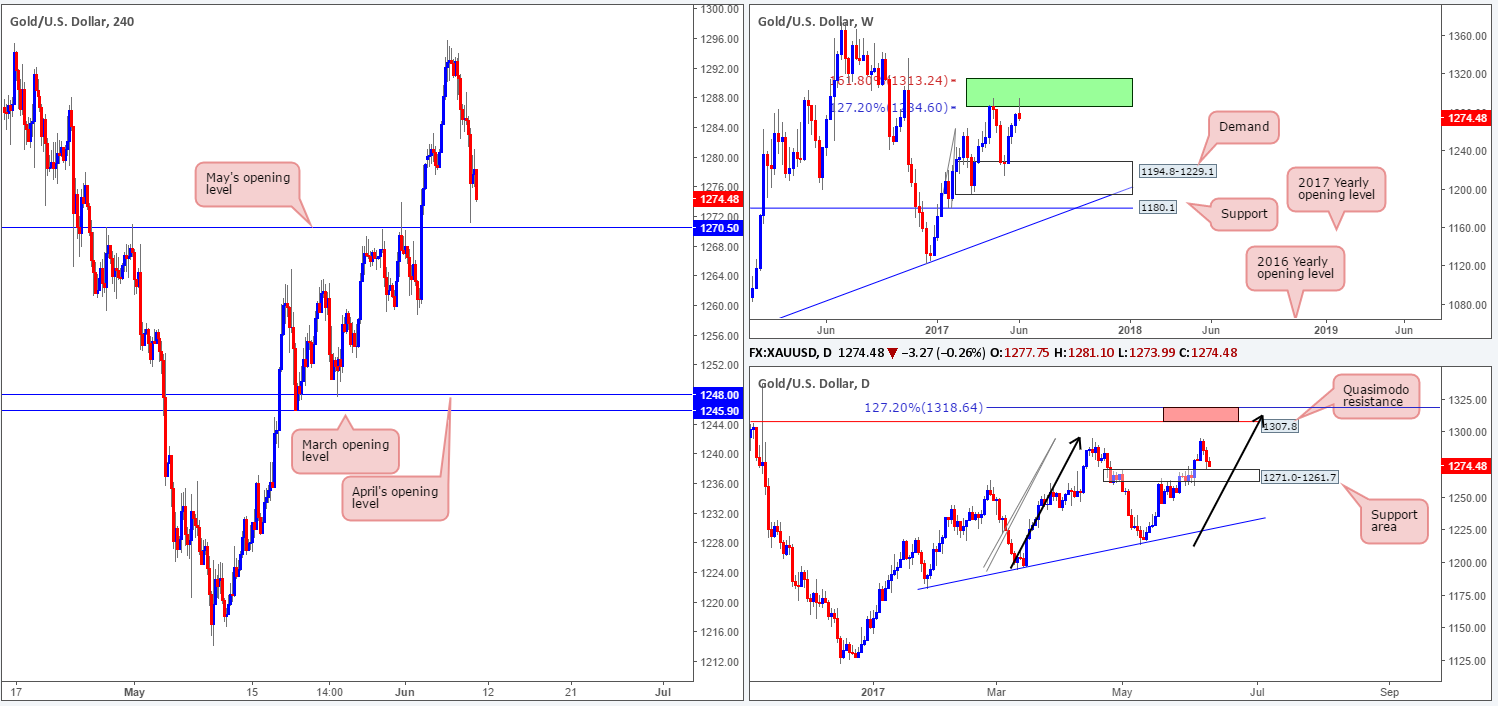
GOLD:
In recent sessions, bullion has continued to drive lower from an area comprised of two weekly Fibonacci extensions 161.8/127.2% at 1313.7/1285.2 taken from the low 1188.1 (green zone). Depending on this market’s movements today, weekly price may end the week printing a selling wick! Bouncing down to the daily timeframe, the support area at 1271.0-1261.7 was recently brought into the picture. Having seen this area cap upside nicely between mid-May and the end of June, this base is likely to offer support. Provided that this area remains stable, the unit could approach the Quasimodo resistance at 1307.8. Also noteworthy here is the possible AB=CD daily bearish pattern (see black arrows) that terminates a tad beyond the said Quasimodo resistance (positioned within the upper limits of the weekly green zone) at 1318.6 (127.2% ext.).
A closer look at price action on the H4 chart shows the unit came within a few pips of connecting with May’s opening level pegged at 1270.5 during yesterday’s segment. From our perspective this is currently not a buyers’ market, simply because this would entail one going up against potential weekly sellers! The same, of course, goes for shorts. Selling into the above noted support areas, even with knowing that weekly price is trading within a sell zone would, in our opinion, still be considered too risky.
Our suggestions: Although it’s unlikely that we’ll see it come to fruition today, we’re still going to be keeping a close eye out for the daily candles to test the aforementioned Quasimodo resistance/127.2% AB=CD completion area (red zone) as it is (given its location on the weekly chart) an ideal sell zone, in our opinion.
Levels to watch/live orders:
- Buys: Flat (stop loss: N/A).
- Sells: 1318.6/1307.8 is a potential sell zone to keep an eye on.


