
Key risk events today:
UK GDP m/m; UK Manufacturing Production m/m; UK Prelim GDP q/q; Canadian Employment Change and Unemployment Rate; US Core PPI m/m and PPI m/m.
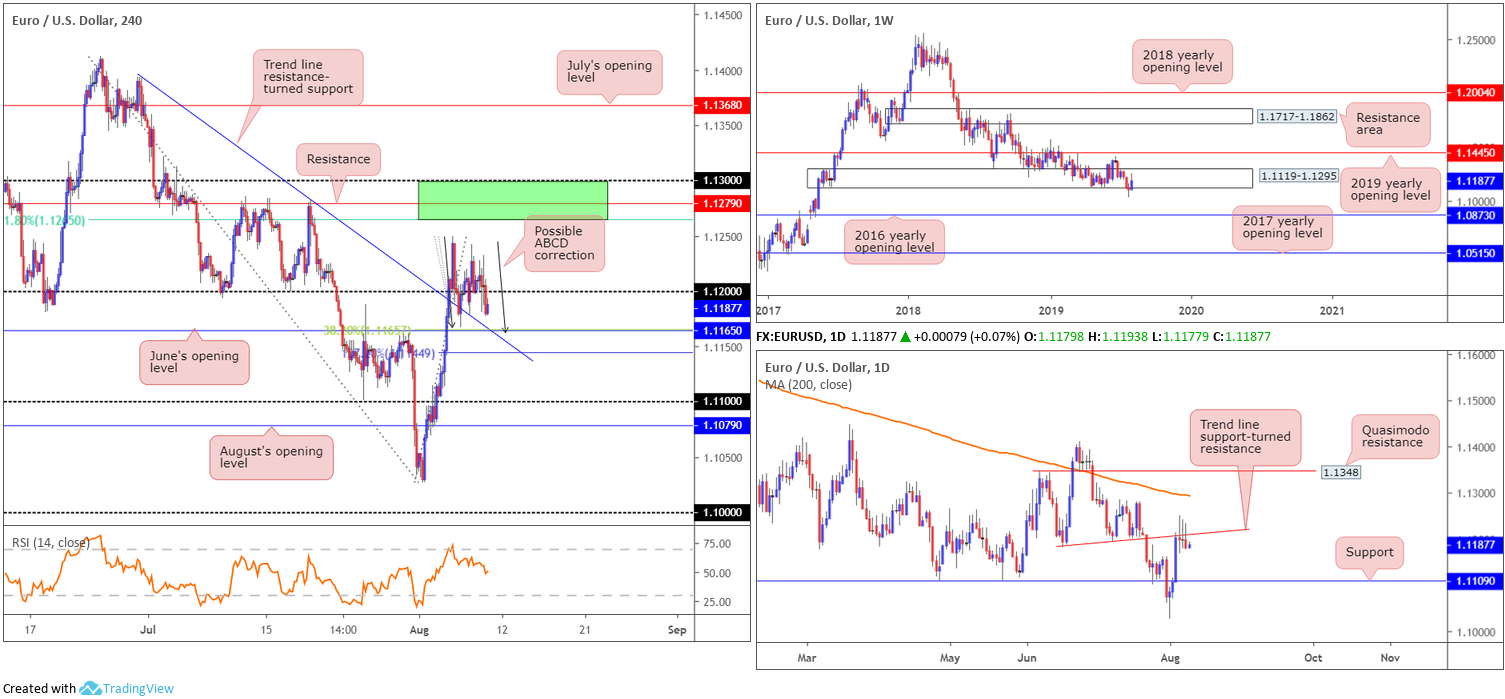
EUR/USD:
Speculative interest, for the most part, remains range bound, though 1.12 suffered a breach to the downside Thursday, consequently exposing June’s opening level at 1.1165 as the next support. Note 1.1165 also intersects with a trend line resistance-turned support (etched from the high 1.1393), a 38.2% Fibonacci retracement ratio and the approach, so far, meets the characteristics of an ABCD (black arrows) correction. In the event we push below here, traders’ crosshairs will likely be fixed on the 1.11 handle, closely shadowed by August’s opening level at 1.1079.
In terms of the weekly timeframe’s position, the current candle remains trading within the parapets of long-standing demand at 1.1119-1.1295, with resistance at 1.1445 in sight as the next upside target: the 2019 yearly opening level. A closer reading of price action on the daily timeframe shows the unit found thin air above a local trend line support-turned resistance (taken from the low 1.1181). Three back-to-back selling wicks have taken shape from here, suggesting a move towards support at 1.1109 could be in store.
Areas of consideration:
Longer term, it appears weekly and daily price emphasise a conflicting tone at the moment: weekly buyers attempting to push from demand and daily sellers defending a trend line support-turned resistance.
Medium-term flow (H4), on the other hand, exposes a potential opening for longs off June’s opening level at 1.1165 today, targeting 1.12 as the initial point of concern. In light of the surrounding confluence, entry at 1.1165 is an option, with a protective stop-loss order plotted beneath the 127.2% Fibonacci ext. point at 1.1144.
GBP/USD:
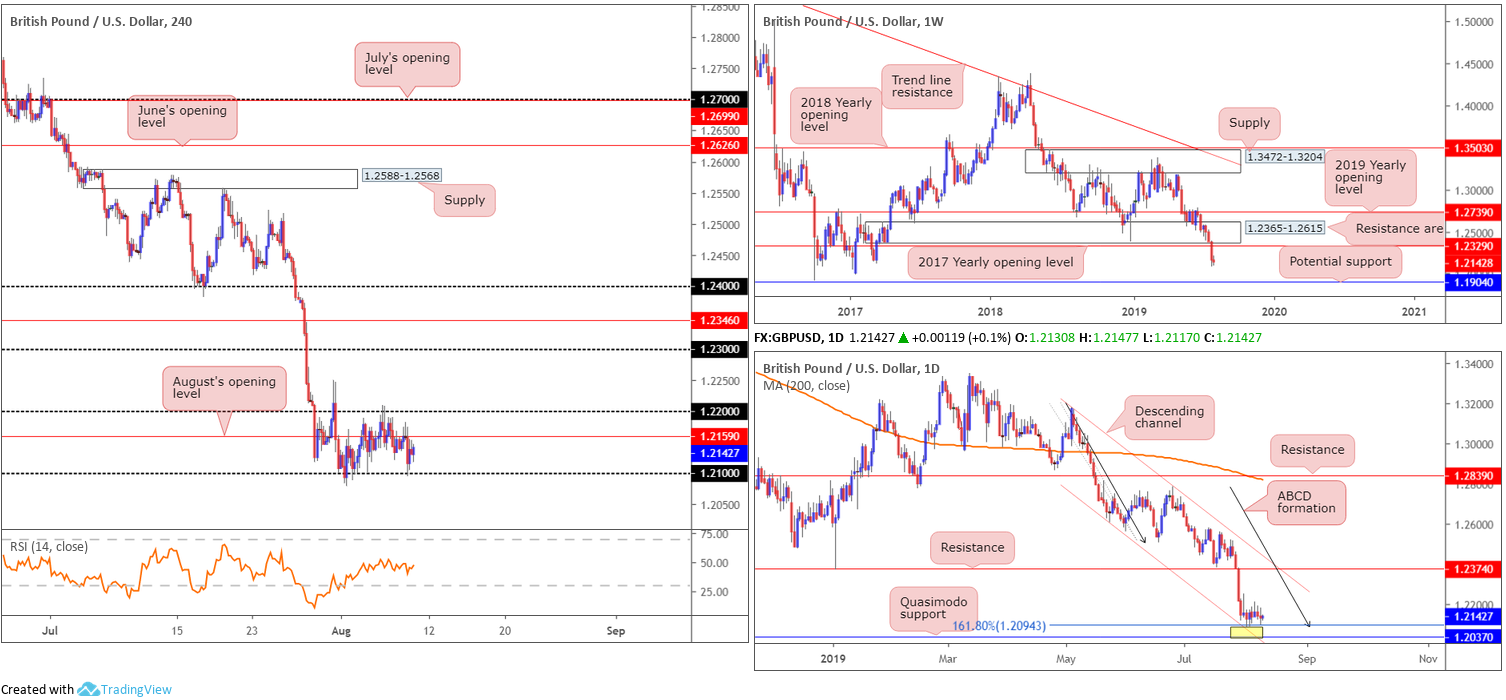
Outlook remains unchanged.
Since the beginning of the month, the British pound has underscored a somewhat subdued tone vs. its US counterpart, consolidating between 1.21/1.22 on the H4 timeframe. Traders may also wish to acknowledge the RSI indicator touching the underside of its mid-point value (50.0) and between the two round numbers we have August’s opening level situated at 1.2159.
Higher-timeframe flow remains unchanged since Monday’s weekly report:
From the weekly timeframe:
Since retesting the underside of the 2019 yearly opening level at 1.2739 in May, the British pound has been grinding lower against its US counterpart. Tunnelling through bids residing within long-standing demand at 1.2365-1.2615 and eventually overthrowing the 2017 yearly opening level at 1.2329, longer-term flow is exposed to further downside this week, targeting potential support from 1.1904: a standout low clocked in early October 2016.
The daily timeframe:
Contrary to the weekly timeframe’s estimation, daily movement is bottoming around the top edge of a rather interesting support zone between 1.2037/1.2094. Comprised of a 161.8% ABCD (black arrows) pattern at 1.2094, a channel support extended from the low 1.2605 and a Quasimodo support at 1.2037, does this area possess enough oomph to send price towards resistance at 1.2374?
Areas of consideration:
Having observed limited change over the past week, much of the following echoes thoughts aired in previous reports.
Weekly price portends further downside this week, while daily price reveals a clear-cut support area at 1.2037/1.2094. In cases such as this, it’s always best to plot the H4 position for directional cues. For example, a break of 1.22 to the upside confirms bullish strength not only on the H4 timeframe, but also on the daily timeframe, and, therefore, may make a run to 1.23. As such, a long entry either on the breakout or retest at 1.22 is an option.
A break of 1.21, nonetheless, implies weakness within the daily support area and strength on the weekly timeframe. This implies a possible run towards 1.1904 on the weekly scale.
For traders still long from 1.21, specifically the H4 bullish engulfing candle, there’s little you can do at the moment except wait for a move to take shape. Ultimately, you’ll need a H4 close above 1.22 before reducing risk to breakeven.
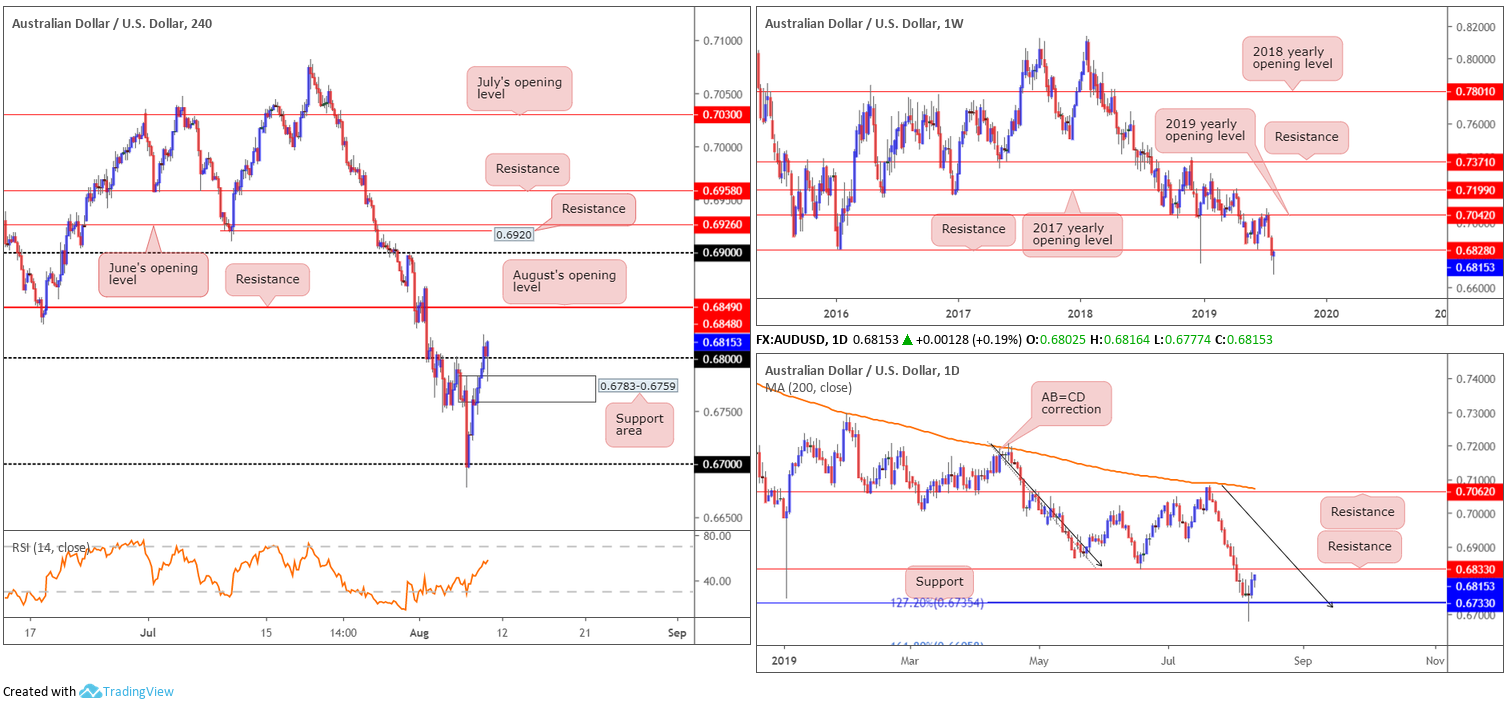
AUD/USD:
In recent hours, increased demand for the Australian dollar lifted the currency beyond 0.68 vs. the US dollar, as RBA Governor Lowe testified before the House of Representatives’ Standing Committee on Economics, in Canberra. Lowe stated the Australian economy is to expand 2.5% this year and that downward revision reflects weak consumption growth. Lowe also added the central bank expects quarterly GDP growth to increase gradually.
Using the top edge of a supply-turned support area at 0.6783-0.6759 on the H4 timeframe, the candles are making headway above 0.68, with August’s opening level/resistance at 0.6849/0.6848 in sight.
Before reaching the said H4 resistances, nevertheless, weekly price decorates its chart with notable resistance nearby at 0.6828. This is closely followed by resistance on the daily timeframe at 0.6833 after finding a floor off 0.6733, which happened to merge with a 127.2% AB=CD (black arrows) formation at 0.6735.
Areas of consideration:
Entering long based on H4 price showing room for extension above 0.68 is a chancy move, knowing both weekly and daily structure pencil in resistance. Instead, traders may want to consider August’s opening level/resistance at 0.6849/0.6848 on the H4 timeframe as a base for shorts. Although positioned slightly above the aforementioned higher-timeframe resistances, a H4 bearish candlestick configuration printed from here is likely enough to draw in sellers (entry/risk can be determined according to the candlestick’s structure) and reclaim the higher-timeframe levels.
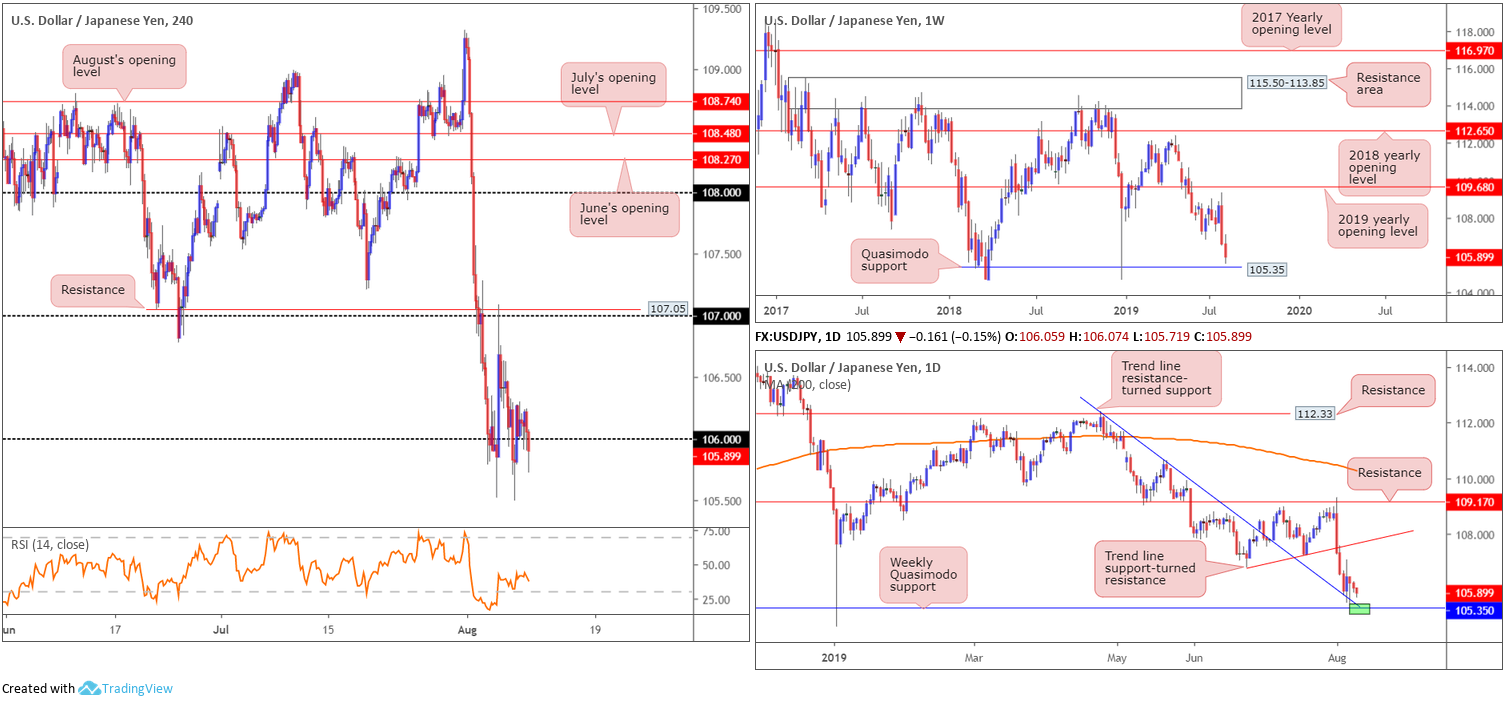
USD/JPY:
Kicking things off from the weekly timeframe this morning, the research team notes price remains hovering just north of a Quasimodo support at 105.35 – this level already proved some worth by holding the unit higher at the beginning of the year.
Daily movement, on the other hand, recently crossed swords with trend line resistance-turned support (extended from the high 112.40). Although producing a bullish engulfing candlestick signal Tuesday as well as a hammer candlestick signal (another bullish sign) Wednesday, the pair has been unable to print anything of meaning to the upside thus far.
Across the page on the H4 timeframe, the candles remain toying with the 106 handle. Beyond here, limited support is visible until connecting with 105, whereas a decisive push higher could lead to 107 re-entering the fold.
Areas of consideration:
Outlook unchanged.
Selling beyond 106 is certainly a possibility according to the weekly timeframe, though daily price defending its trend line resistance-turned support may hamper downside. If you must take shorts sub 106, you’re urged to consider waiting for at least a H4 bearish candle to form before committing funds. Not only does this help identify seller intent, it also provides entry/risk levels to work with.
Drawing in buyers from the aforementioned weekly Quasimodo support is also still a reasonable possibility, even more so seeing as how the daily trend line support now merges beautifully with the weekly level (green zone on daily timeframe). Therefore, the research team still feels it is best to hold fire and wait for weekly support to enter the mix before considering a long in this market.
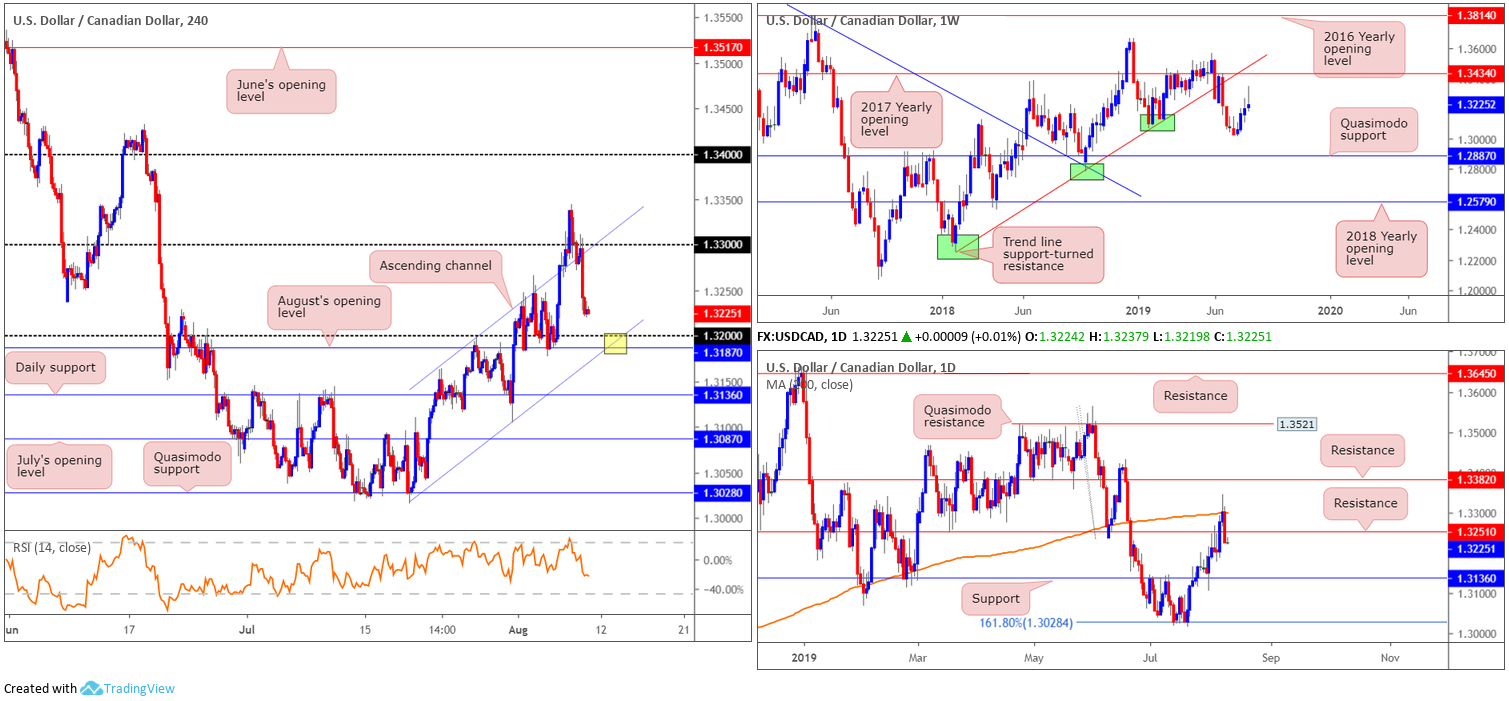
USD/CAD:
As oil prices gathered momentum Thursday, up around 1.00%, and the US dollar index remained soft around the underside of weekly resistance at 97.72, the USD/CAD overthrew 1.33 to the downside and closed just north of 1.32. With respect to the H4 timeframe’s technical structure, 1.32 brings together August’s opening level at 1.3187 and a channel support extended from the low 1.3016. Medium term, this is a high-probability buy zone, though is unlikely to enter the mix today but is certainly an area to keep an eye on Monday.
Viewing the market’s higher-timeframe position, we can see the daily candles respected its 200-day SMA (orange), despite whipsawing to highs of 1.3344, and concluded yesterday’s session strongly sub resistance at 1.3251. Continued selling from this point has support at 1.3136 in view as its next port of call, which, as you can see, sports an appealing history as support/resistance.
Areas of consideration:
Keeping it simple this morning, should the H4 candles test 1.32, a long from here could be something to consider, targeting daily resistance at 1.3251 as the initial take-profit zone. Entry can be found at 1.32, with a tight protective stop-loss order positioned a few points beneath August’s opening level at 1.3187. Conservative traders requiring a little more confirmation may opt to wait and see if a H4/H1 bullish candlestick signal develops before pulling the trigger. That way, entry and risk can be set according to this structure.
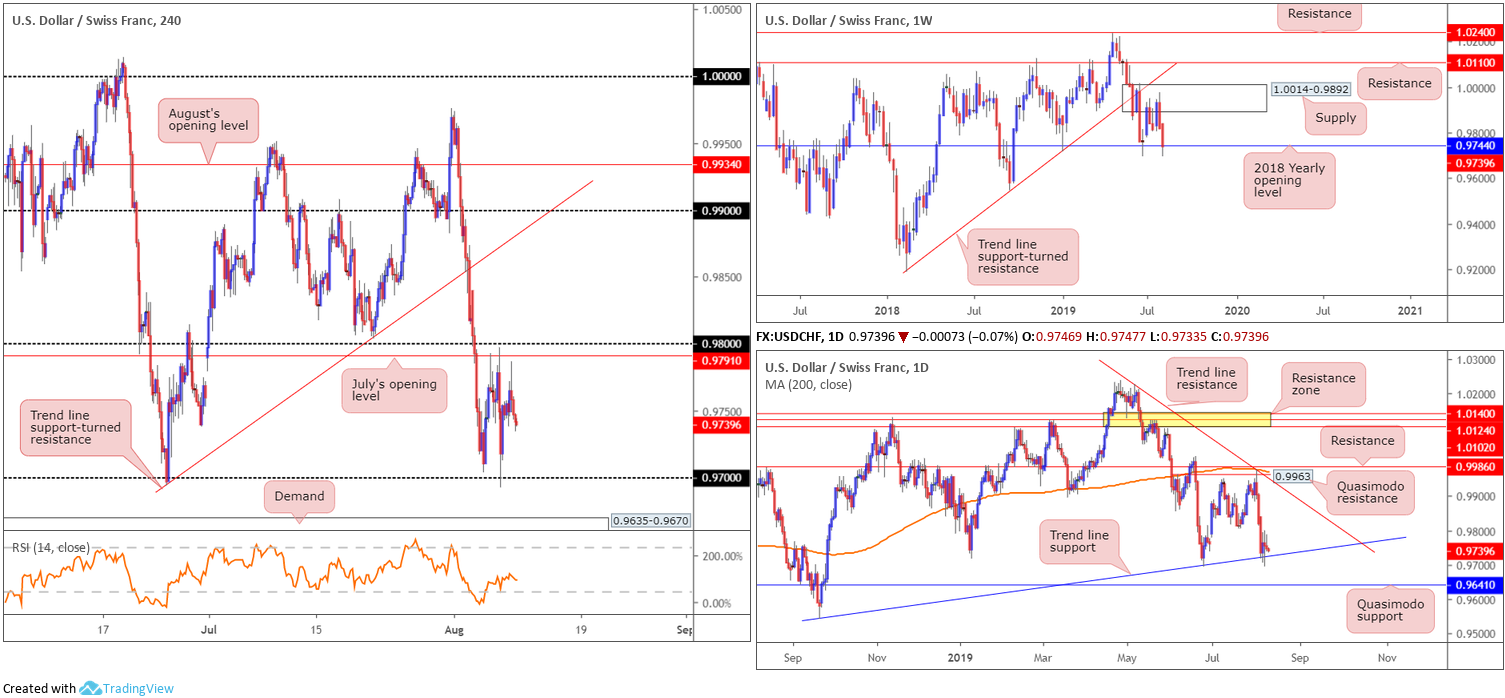
USD/CHF:
Since the beginning of the week, the H4 candles have been carving out a 100-point range between 0.98/July’s opening level at 0.9791 and 0.97 A decisive move beyond 0.98 may attempt an approach towards trend line support-turned resistance (extended from the low 0.9693, whereas a push sub 0.97 has demand in view at 0.9635-0.9670.
Higher-timeframe technicals reveal weekly price testing support by way of the 2018 yearly opening level at 0.9744. A rejection off this barrier could land the unit back at supply drawn from 1.0014-0.9892. In conjunction with weekly support, daily activity is testing trend line support etched from the low 0.9542. Below here, eyes are on Quasimodo support at 0.9641.
Areas of consideration:
Having seen weekly support at 0.9744 remain in the fold, and daily price respect trend line support, buyers, as highlighted in previous reports, still appear to have the upper hand as far as structure is concerned.
Unless the H4 candles retest 0.97 and produce a sizeable bullish candlestick signal (entry/risk set according to this structure), limited support is visible to take advantage of any up move as of current price. Another alternative is an engulf of 0.98 to the upside, consequently unlocking the door to potential longs toward trend line support-turned resistance (take from the low 0.9693).
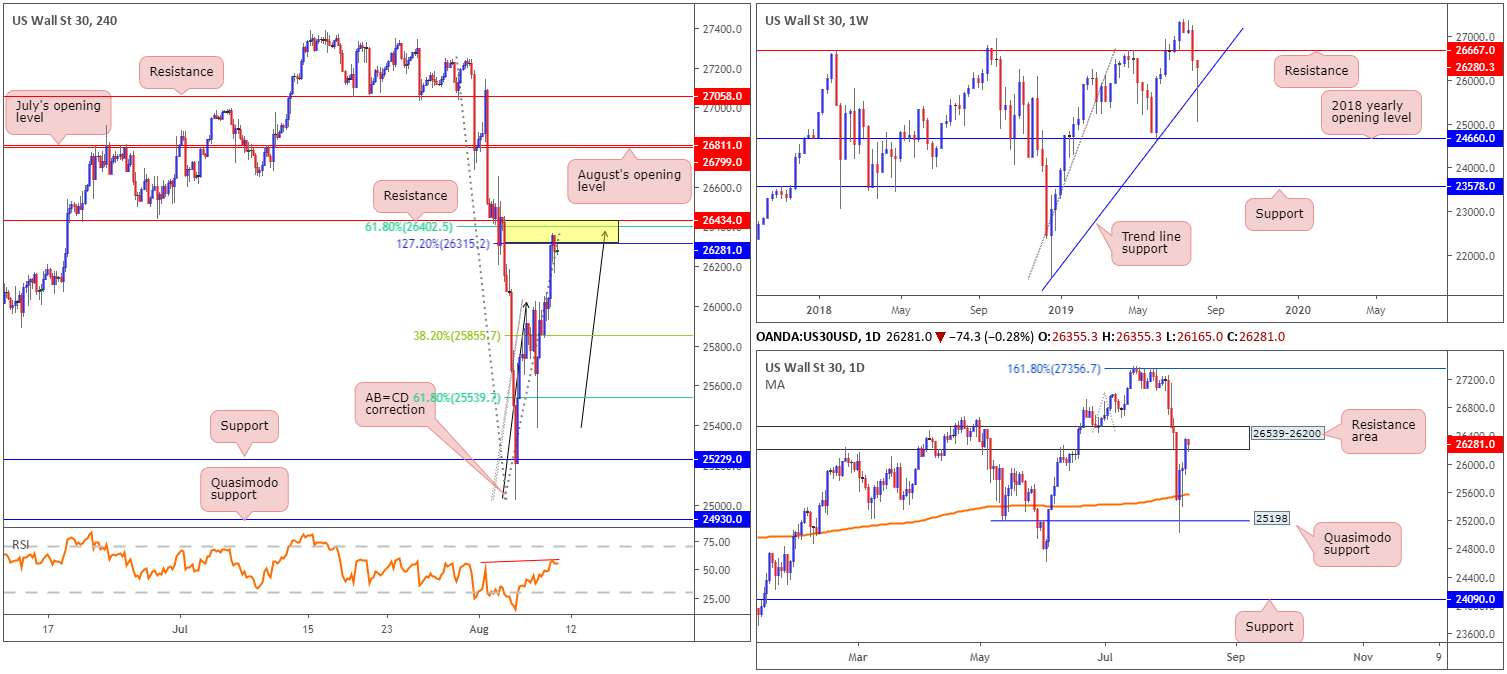
Dow Jones Industrial Average:
US stocks closed higher Thursday as concerns over a global economic slowdown eased. The Dow Jones Industrial Average added 371.12 points, or 1.43%; the S&P 500 added 54.13 points, or 1.88% and the Nasdaq advanced 172.93 points, or 2.29%.
The technical landscape on the Dow’s H4 chart this morning is appealing for shorts. Between resistance at 26434, a 127.2% AB=CD (black arrows) correction point at 26315, a 61.8% Fibonacci retracement value at 26402 and the RSI indicator currently chalking up divergence (red line), we have a compact sell zone (yellow). What’s also notable from a technical perspective is a converging daily resistance area in the mix at 26539-26200.
The only grumble to selling the current H4 sell zone is the weekly timeframe showing price could potentially run as far north as weekly resistance at 26667, after taking hold of trend line support (etched from the low 21452) following Tuesday’s sharp move to lows of 25024.
Areas of consideration:
Keeping things simple this morning, shorts from the H4 resistance area at 26434/26315 are an option today, though traders are urged to wait for additional candlestick confirmation to form before pulling the trigger. Not only will this help identify seller intent, it’ll also provide entry and risk levels to work with. As for downside targets, keep eyes on the 38.2% and 68.1% Fibonacci retracements at 25855 and 25539, respectively.
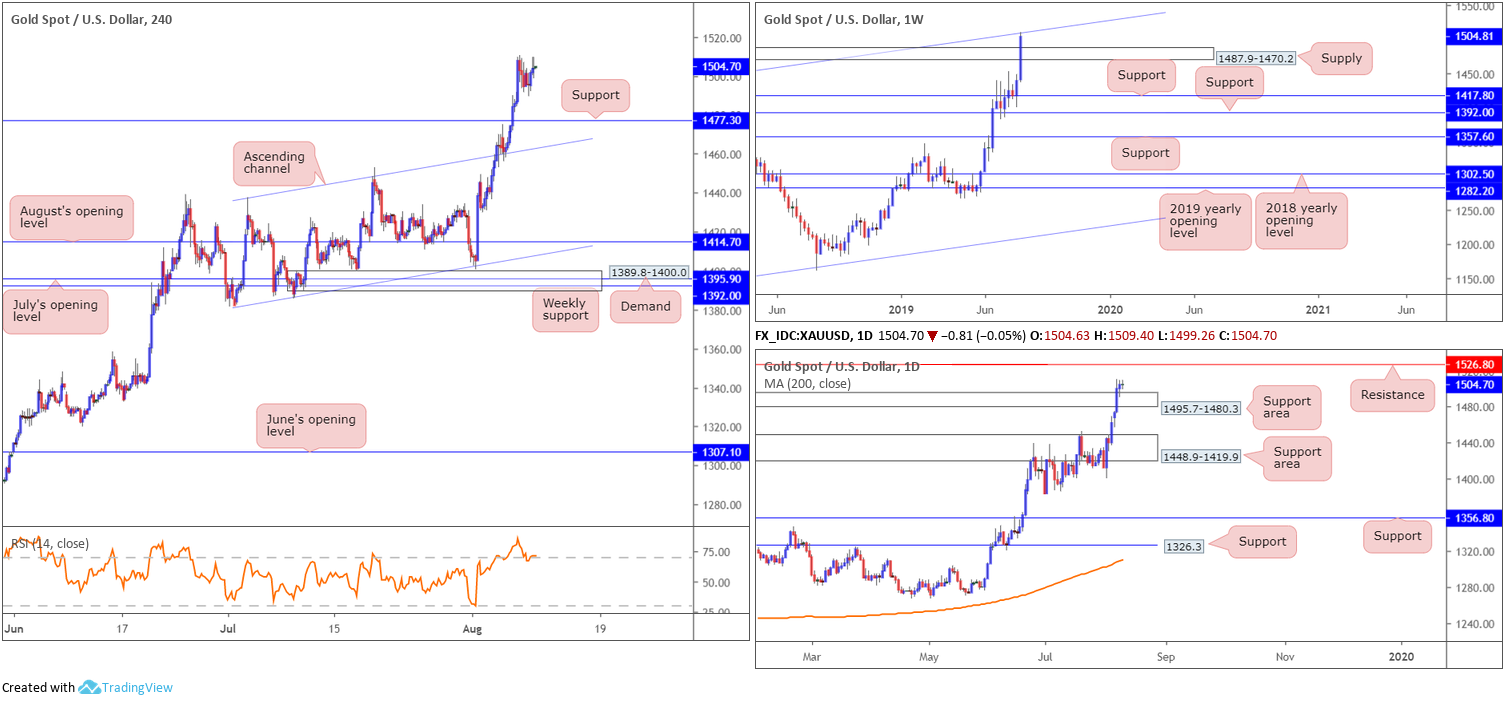
XAU/USD (GOLD):
Despite recording its fourth consecutive session in positive territory Thursday, price remained within the upper limit of Wednesday’s range. As underscored in Thursday’s technical briefing, weekly flow recently dethroned supply at 1487.9-1470.2, permitting a free run towards a long-term channel resistance taken from the high 1375.1, which, as is evident from the chart, is holding ground. In terms of daily price, nonetheless, 1495.7-1480.3 remains serving as a support area which may eventually prompt additional upside in the direction of resistance at 1526.8.
Across the charts on the H4 timeframe, yesterday’s lacklustre performance left Thursday ranging above support at 1477.3. To the upside, however, bullion exhibits scope to press as far north as supply coming in at 1568.4-1552.9 (not visible on the screen).
Areas of consideration:
Outlook unchanged.
Despite weekly channel resistance recently entering the fold, traders are still likely focused on the current uptrend and looking for an opportunity to get involved. With daily price already retesting 1495.7-1480.3 as support, H4 support at 1477.3 is an ideal location to look for buying opportunities today, preferably on the back of a H4 bullish candlestick signal (entry and risk can be determined according to this structure). Why the need for candlestick confirmation? This is simply to try and help limit losses should weekly sellers push for lower ground.
The accuracy, completeness and timeliness of the information contained on this site cannot be guaranteed. IC Markets does not warranty, guarantee or make any representations, or assume any liability regarding financial results based on the use of the information in the site.
News, views, opinions, recommendations and other information obtained from sources outside of www.icmarkets.com.au, used in this site are believed to be reliable, but we cannot guarantee their accuracy or completeness. All such information is subject to change at any time without notice. IC Markets assumes no responsibility for the content of any linked site.
The fact that such links may exist does not indicate approval or endorsement of any material contained on any linked site. IC Markets is not liable for any harm caused by the transmission, through accessing the services or information on this site, of a computer virus, or other computer code or programming device that might be used to access, delete, damage, disable, disrupt or otherwise impede in any manner, the operation of the site or of any user’s software, hardware, data or property.


