
EUR/USD:
Heading into Thursday’s close, the single currency shed more than 1.00% vs. its US counterpart, as the European Central Bank came out with more of a dovish-than-expected conclusion to its monetary policy meeting. The ECB cut growth forecasts and indicated rates would be on hold through 2019 (previously it had guided it would be on hold through summer). The central bank over-delivered in that sense, since it announced fresh liquidity measures as well.
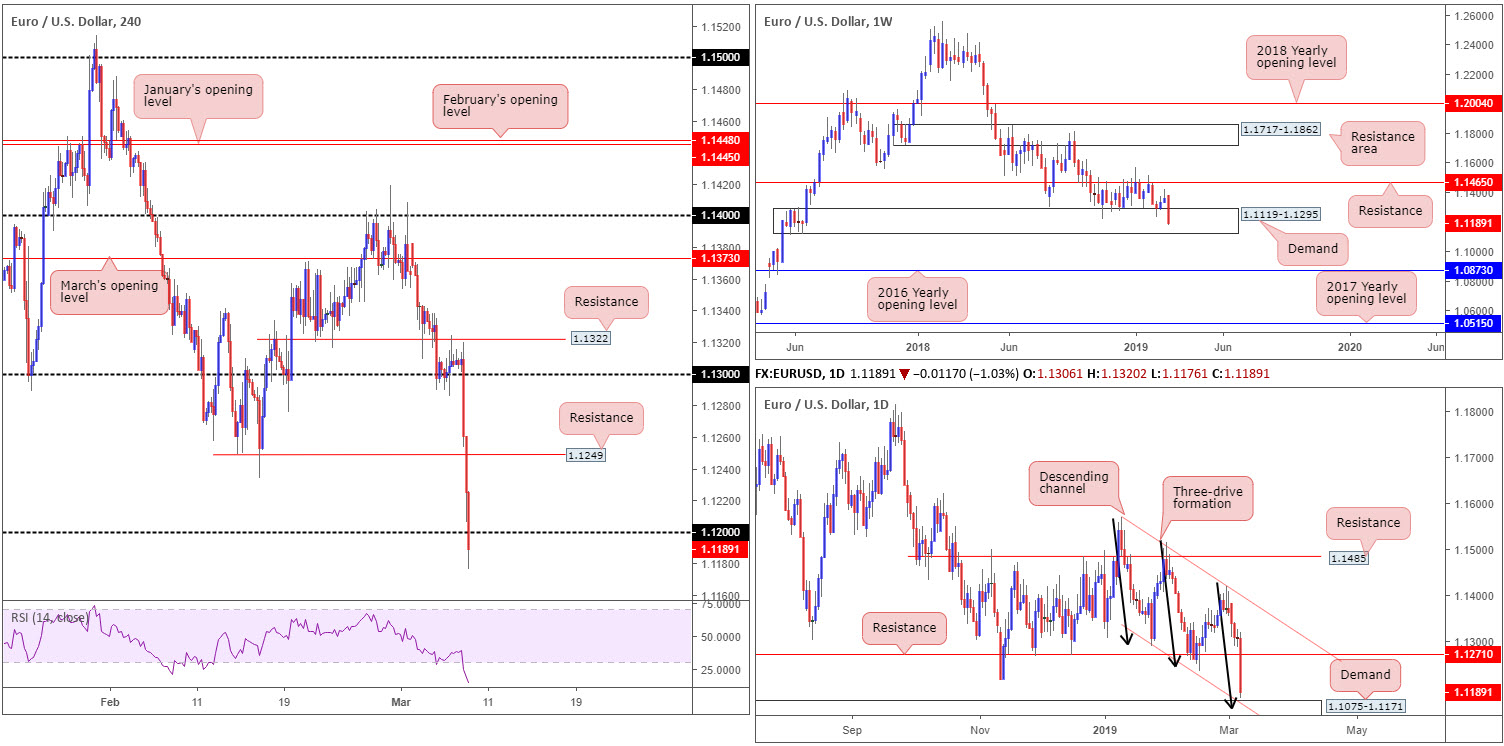
In spite of recent selling, weekly demand at 1.1119-1.1295 remains unharmed for now. A push beneath this base, however, has the 2016 yearly opening level at 1.0873 to target. In conjunction with the current demand, the daily timeframe also has demand plotted nearby at 1.1075-1.1171, merging closely with channel support (extended from the low 1.1289) and a bullish three-drive formation (black arrows) at 1.1151 (taken from the high 1.1569).
A closer reading of price action has the H4 candles trading sub 1.12. The break of this psychological mark has potentially set the stage for a run towards support framed at 1.1139 (not seen on the screen).
Areas of consideration:
Selling the retest of 1.12 is likely on the radar for many traders this morning. This is fine should the H4 timeframe be your only timeframe. With the top edge of daily demand entering the fold around 1.1171, along with its surrounding confluence and supporting weekly demand at 1.1119-1.1295, sellers could be entering short into a strong wall of buying.
On account of the above, the research team recommends waiting for daily price to connect with its aforementioned demand. A H4 close back above 1.12 following this would, technically speaking, be sufficient evidence to suggest buyer intent at least towards 1.1249: H4 resistance. Either buying the breakout candle (with stop-loss orders tucked beneath its tail) or waiting and seeing if the unit retests 1.12 as support (place stop-loss orders beneath the tail of the rejecting candle) are both potential ideas going forward.
Today’s data points: US Average Hourly Earnings m/m; US Non-Farm Employment Change; US Unemployment Rate; US Building Permits.
GBP/USD:
Limited progress made in discussions with the EU ahead of next week’s Meaningful Votes in Parliament, and some ‘sympathy selling’ alongside the euro (hammered post-ECB), collectively weighed on the British pound Thursday, down 0.67% as of writing.
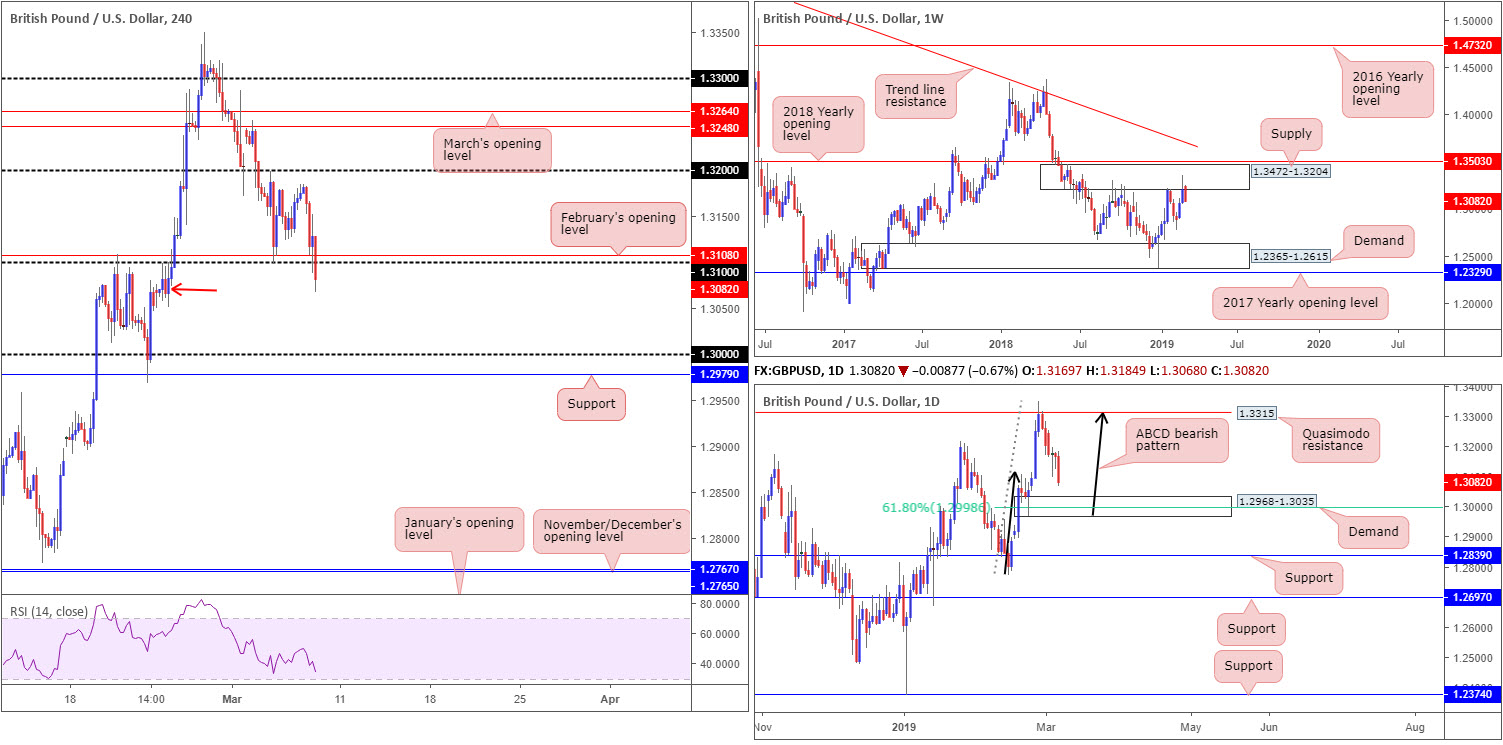
Leaving the underside of 1.32 unchallenged, the H4 candles dethroned February’s opening level at 1.3108 and neighbouring psychological level 1.31. Demand at 1.3050-1.3099 is seen to the left of current price (red arrow), which could hamper further downside. A break of this area, however, may call for a move towards the key figure 1.30.
The outlook on the weekly timeframe supports further selling beyond 1.31, as the pair continues to occupy the lower edge of supply pictured at 1.3472-1.3204 (positioned south of the 2018 yearly opening level at 1.3503). In addition to this, daily flow appears poised to shake hands with demand chalked up at 1.2968-1.3035, which happens to hold a 61.8% Fibonacci value within at 1.2998 – considered the second take-profit target for those short the ABCD bearish pattern (black arrows)/Quasimodo resistance at 1.3315.
Areas of consideration:
Aside from minor H4 demand present at 1.3050-1.3099, all three timeframes portend lower levels. As a result of this, the underside of 1.31/1.3108 (H4) is potential resistance to work with today, targeting the top edge of daily demand at 1.3035 as the initial downside target, followed by the 1.30 handle on the H4 (merges with the daily 61.8% Fibonacci value mentioned above at 1.2998).
For traders wishing for a little more confirmation from 1.31, waiting for a H4 bearish candlestick formation to come about is an option. Not only will the candlestick signal identify seller intent, it’ll serve as a guide for entry and risk levels as well.
Today’s data points: US Average Hourly Earnings m/m; US Non-Farm Employment Change; US Unemployment Rate; US Building Permits.
AUD/USD:
In early trade Thursday, the commodity-linked currency rose higher on reasonably upbeat news out of Australia. In seasonally adjusted terms, the balance on goods and services reported a surplus of $4,549m in January 2019, an increase of $780m on the surplus in December 2018. In addition to this the retail sales (seasonally adjusted) estimate rose 0.1% in January 2019. This follows a fall of 0.4% in December 2018, and a rise of 0.5% in November 2018.
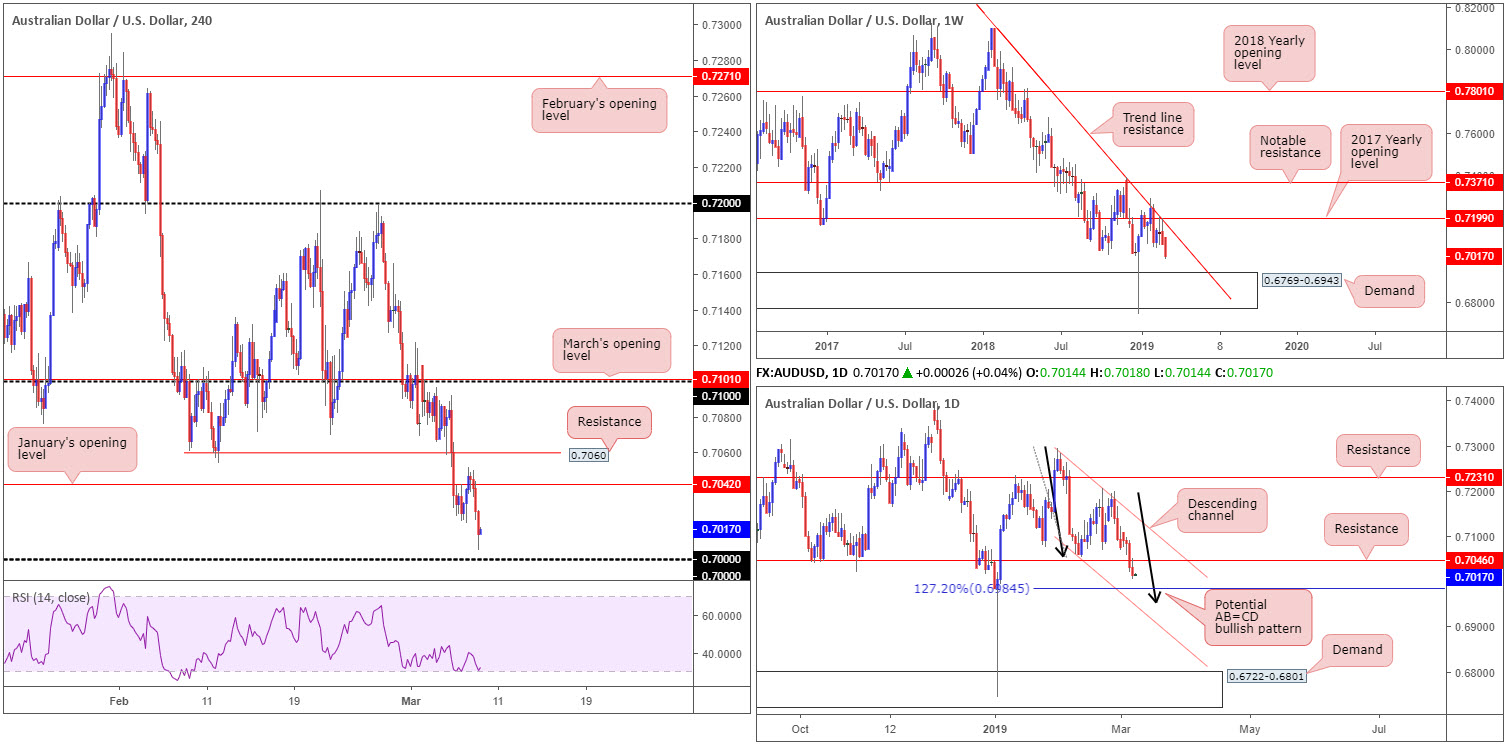
Though early hours witnessed a pop higher, the H4 candles failed to sustain gains above January’s opening level at 0.7042, turning heavily lower into US trade as the US dollar index reclaimed 97.50+ status. Thanks to recent selling, the key figure 0.70 is in view. It may also be worth noting the H4 RSI indicator is seen crawling along its oversold value.
On more of a broader standpoint, Weekly flow remains contained by the 2017 yearly opening level at 0.7199 and merging trend line resistance (taken from the 2018 yearly high of 0.8135). This coupled with downside displaying room to press as far south as demand at 0.6769-0.6943 on this timeframe, sellers appear to have the upper hand. Daily action also remains compressing within a descending channel (0.7295/0.7060) and has an AB=CD (black arrows) 127.2% bullish completion point at 0.6984 in view as its next downside base.
Areas of consideration:
With the key figure 0.70 on the H4 timeframe being a widely watched barrier, and having noted a daily 127.2% Fibonacci ext. point fixed 15 pips beneath the level at 0.6984, a correction out of this range is also a possible play to keep eyeballs on.
To avoid being whipsawed out of a trade from 0.70 (fakeouts are common viewing around psychological levels), nevertheless, traders are urged to consider waiting for additional forms of confirmation before pulling the trigger. This could be anything from a H4 bullish candlestick signal (entry/risk can be defined according to this structure), to drilling down to the lower timeframes and trading a resistance-turned support setup.
Today’s data points: US Average Hourly Earnings m/m; US Non-Farm Employment Change; US Unemployment Rate; US Building Permits.
USD/JPY:
Although the market witnessed the USD/JPY extend losses Thursday (-0.18%), the overall (technical) structure remains unchanged. As a result, much of the following piece will echo thoughts put forward in previous reports.
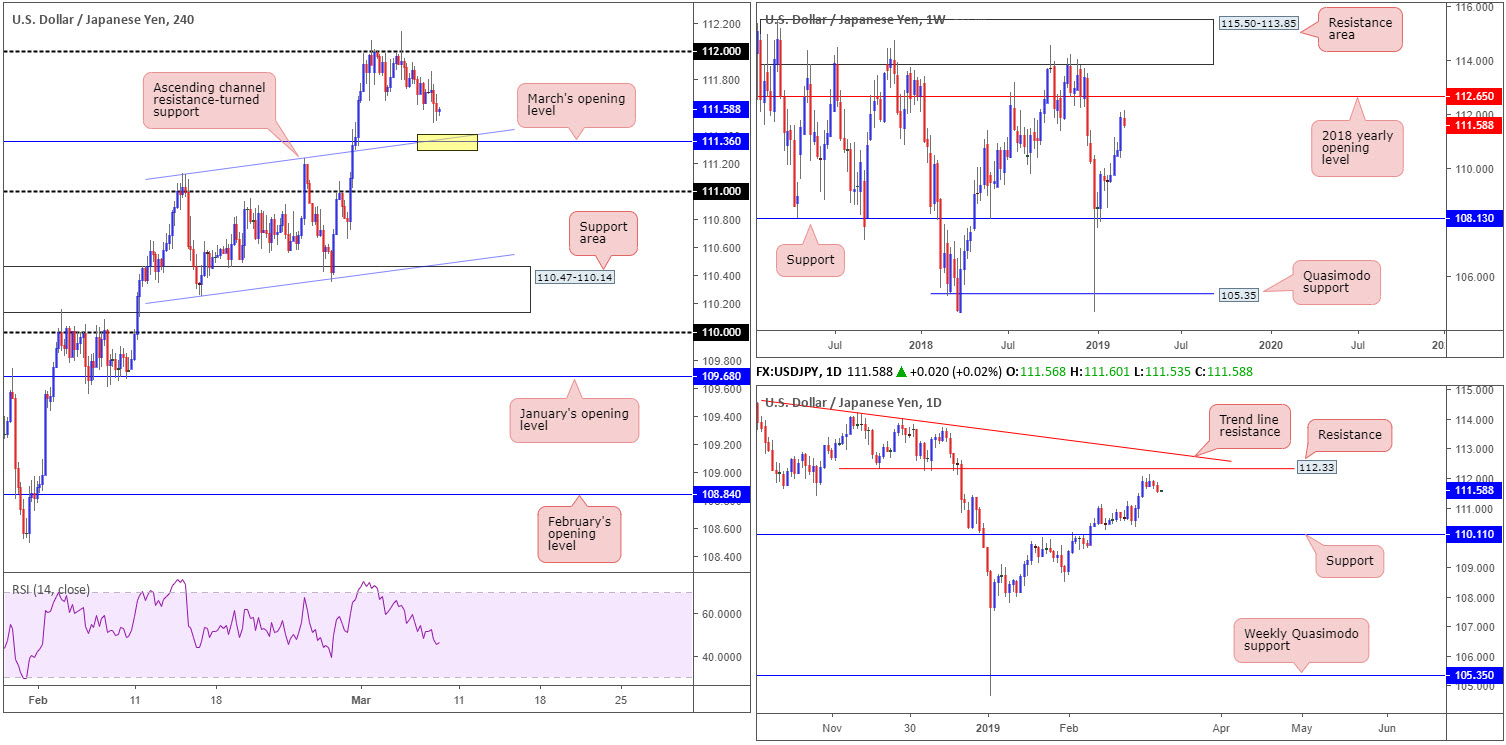
The H4 candles, as you can see, remain capped by 112 as resistance and are visibly grinding lower. Assuming further selling takes form today, price is likely to shake hands with March’s opening level drawn from 111.36 – links closely with an ascending channel resistance-turned support (taken from the high 111.12).
Pivotal resistance at 112.65 (the 2018 yearly opening level) is seen on the weekly timeframe, demonstrating this market still has room to advance. The story on the daily timeframe, however, shows price consolidating south of resistance pencilled in at 112.33, followed by trend line resistance extended from the high 114.23.
Areas of consideration:
On account of the above reading, there’s a chance the market may observe sellers push lower and possibly bring the H4 candles towards March’s opening level mentioned above on the H4 timeframe at 111.36. This barrier, particularly at the point the channel support merges with the level (yellow), is an interesting buy zone given we have room to move higher on the weekly timeframe to at least 112.65. The initial upside target from this point, though, rests at 112.
For traders wishing for a little more confirmation out of 111.36, waiting for a H4 bullish candlestick formation to come about is an option. Not only will the candlestick signal identify buyer intent, it’ll serve as a guide for entry and risk levels.
Today’s data points: US Average Hourly Earnings m/m; US Non-Farm Employment Change; US Unemployment Rate; US Building Permits.
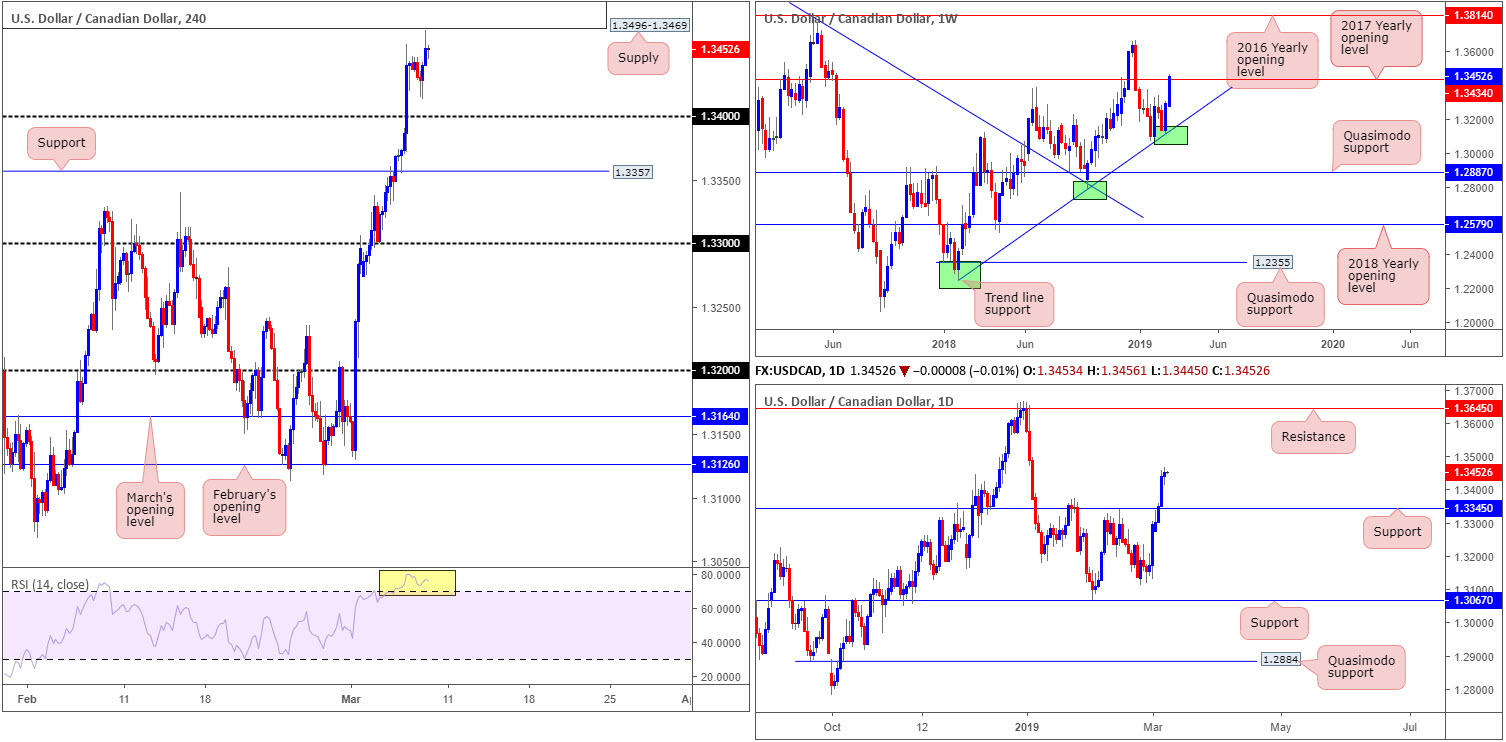
USD/CAD:
Despite oil prices recovering towards its $57 mark Thursday, broad-based USD bidding dominated the market. Following a brief spell around lows of 1.3413, H4 movement rallied to a session high of 1.3467 – the highest level since early January 2019. Traders may have also acknowledged nearby supply at 1.3496-1.3469 and the RSI indicator trading deep within overbought territory (yellow).
What’s also interesting from a technical standpoint is weekly price touching gloves with the underside of the 2017 yearly opening level at 1.3434. Contrary to this, daily price recently crossed above resistance at 1.3345 (now acting support) and potentially set the stage for a run towards resistance priced in at 1.3645.
Areas of consideration:
According to our technical studies, as highlighted in Thursday’s briefing, a correction lower from the H4 supply area mentioned above at 1.3496-1.3469 is possible, knowing we’re coming from weekly resistance at 1.3434. The first logical downside target out of here falls in around yesterday’s low of 1.3413.
Why only a correction and not a reversal out of 1.3496-1.3469 comes down to the fact the market is entrenched within a long-term uptrend (see weekly chart), alongside daily flow demonstrating room to push beyond the aforesaid H4 supply area.
For conservative traders, waiting and seeing how H4 action behaves before pulling the trigger from 1.3496-1.3469 is certainly an idea. Each trader has their own method of confirming areas, though a simple approach here might be a H4 bearish candlestick signal, whereby entry and risk levels can be defined according to this structure.
Today’s data points: US Average Hourly Earnings m/m; US Non-Farm Employment Change; US Unemployment Rate; US Building Permits; Canadian Employment Change and Unemployment Rate.
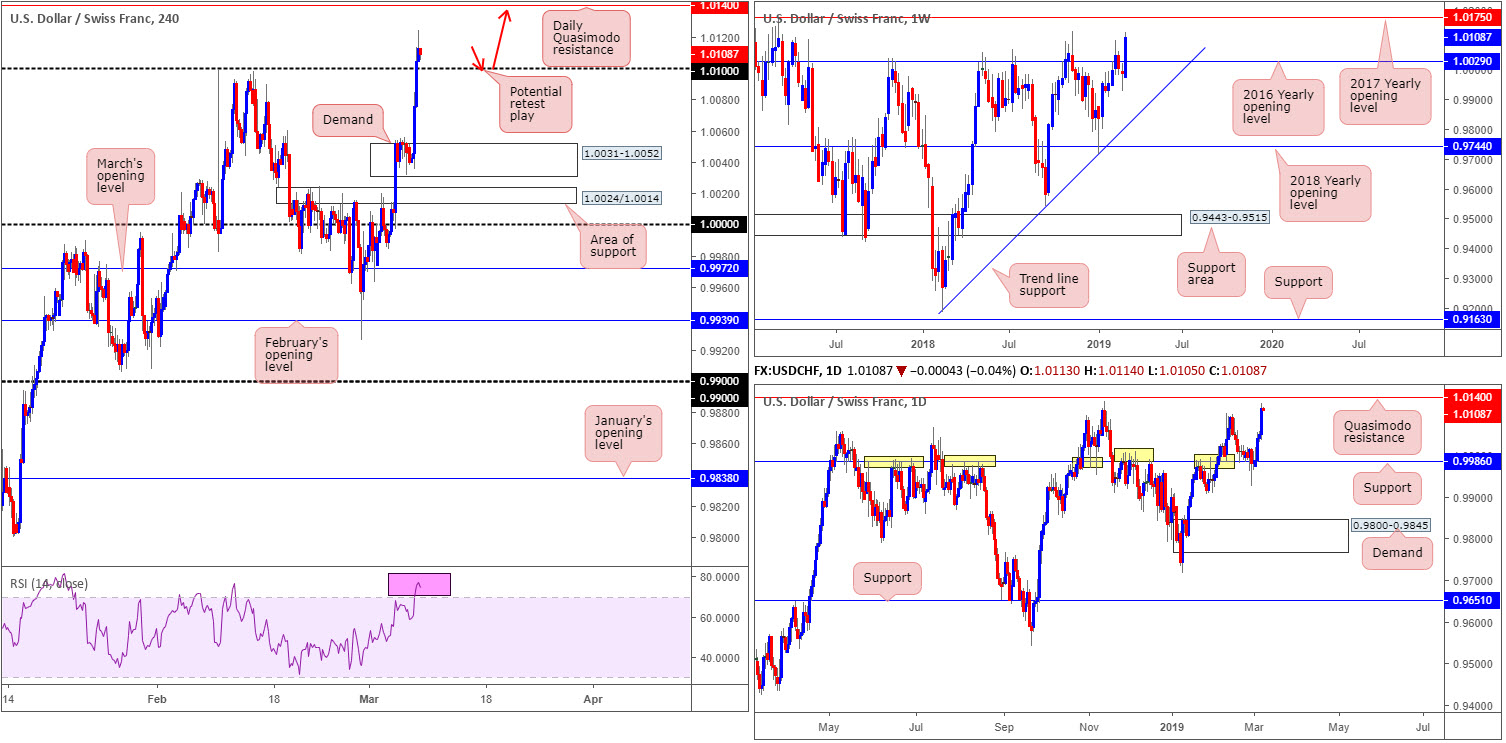
USD/CHF:
Having observed the US dollar index explore 2019 highs Thursday, as well as the European Central Bank reporting more of a dovish-than-expected conclusion to its monetary policy meeting, the USD/CHF surged to fresh 2019 highs of 1.0124.
On the weekly timeframe, focus has now shifted towards the 2017 yearly opening level at 1.0175 as viable resistance after recently crossing above the 2016 yearly opening level at 1.0029. Technical structure on the daily timeframe, however, draws attention towards 1.0140 as the next feasible resistance: a Quasimodo formation.
Drilling down to the H4 timeframe, the research team notes the pair overthrowing 1.01 as resistance Thursday, likely clearing a truckload of sellers out of the market. 1.01, according to structure on this scale, is the last line of defence ahead of the daily Quasimodo resistance mentioned above at 1.0140.
Areas of consideration:
Based on our technical studies the pair reflects a mildly bullish stance today, at least until reaching 1.0140, tailed closely by the 2017 yearly opening level on the weekly chart at 1.0175. With this being the case, a retest (preferably shaped in the form of a H4/H1 bullish candlestick signal as this provides entry/risk levels to work with) off 1.01 as support could be an option (red arrows).
Today’s data points: US Average Hourly Earnings m/m; US Non-Farm Employment Change; US Unemployment Rate; US Building Permits.
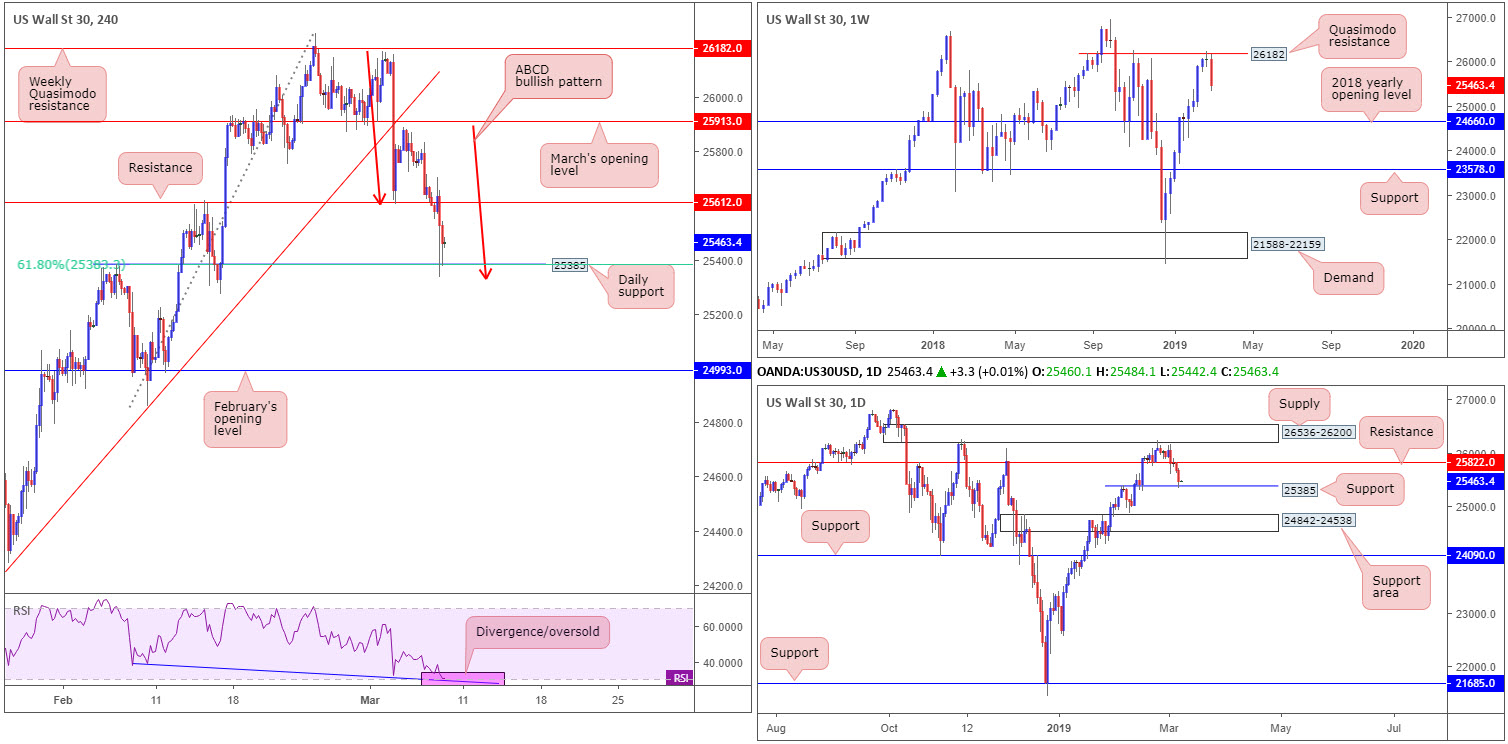
Dow Jones Industrial Average:
Starved of optimistic headlines, global growth concerns coupled with the European Central Bank casting a dark cloud over the markets, saw US equities close lower for a fourth consecutive session.
Thursday’s risk-off environment concluded in the shape of a H4 ABCD bullish pattern (red arrows) around daily support plotted at 25385, which happens to fuse with a 61.8% H4 Fibonacci support value at 25383 and a confirming H4 RSI divergence/oversold signal.
Although price has made a stand from 25385, buyers are likely cautious. Not only because of recent selling and the US employment report due out later on today, but also due to weekly price selling off from Quasimodo resistance at 26182. Additional selling on this timeframe has the 2018 yearly opening level at 24660 to target.
Areas of consideration:
Threatened with potential selling taking form on the weekly timeframe, H4 traders interested in buying daily support at 25385 and its converging H4 ABCD bullish formation may want to consider waiting for an additional H4 candlestick signal to form before pressing the button. A bullish pin bar pattern or engulfing pattern, for example, would suffice. Traders then have the option of either entering based on the candlestick’s rules of engagement, or using the 25273 Feb 15 low as a base for stop-loss orders. As for the initial take-profit target, the H4 resistance at 25612 is eyed.
Today’s data points: US Average Hourly Earnings m/m; US Non-Farm Employment Change; US Unemployment Rate; US Building Permits.
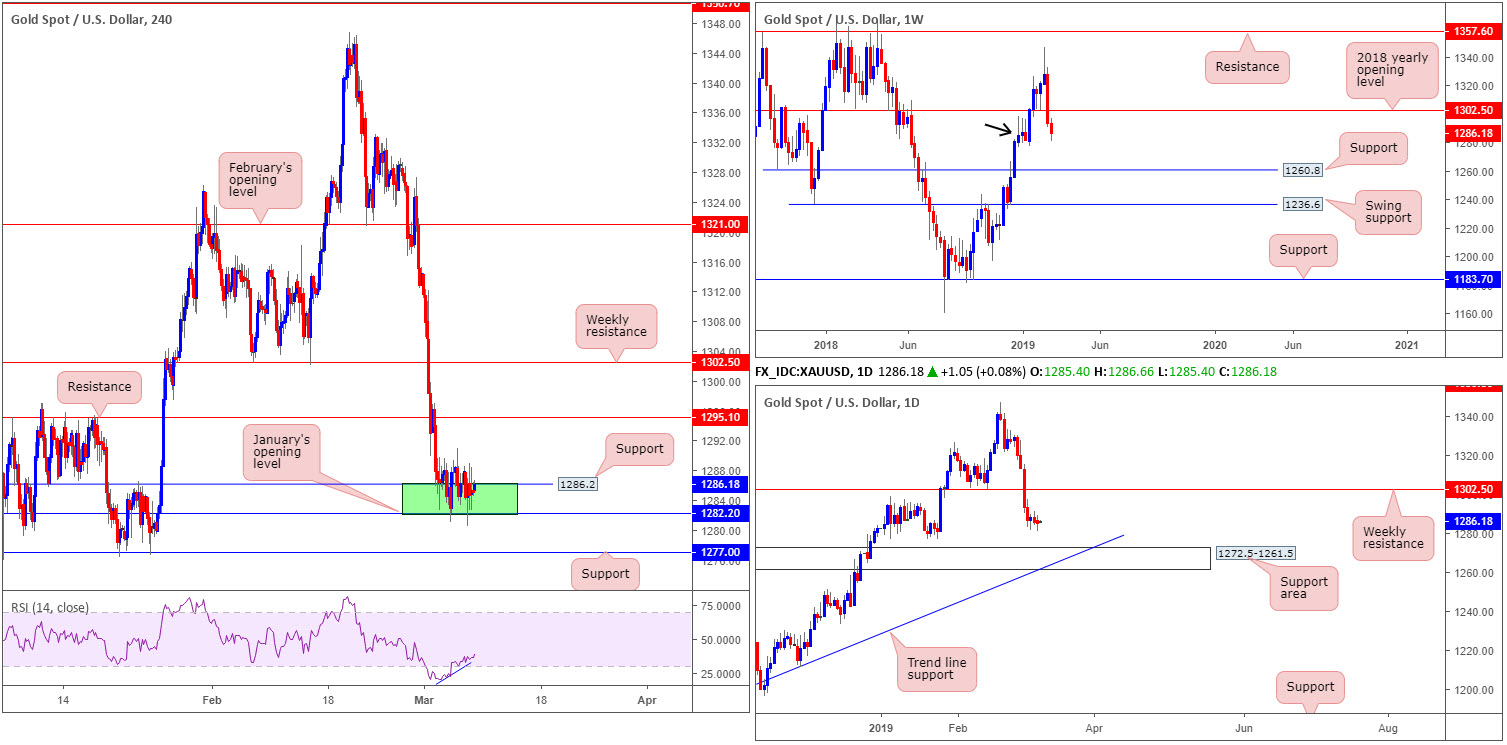
XAU/USD (GOLD):
Despite the greenback refreshing 2019 yearly highs Thursday, bullion remained sedated, unchanged at -0.01% on the day. Since Tuesday, the H4 candles have been confined to a tight range around 1282.2/1286.2 (green area comprised of January’s opening level at 1282.2 and H4 support at 1286.2). It might interest some traders to note the H4 RSI indicator is displaying a divergence reading (blue line).
As of writing, 1282.2/1286.2 is holding ground, though has suffered two attacks to its lower limit, likely tripping a portion of stops. In the event we do push for lower ground from here, though, nearby H4 support is seen at 1277.0.
The interest in 1282.2/1286.2 largely stemmed from the weekly timeframe. By way of a near-full-bodied bearish candle, weekly price engulfed the 2018 yearly opening level at 1302.5 in strong fashion last week. However, demand is seen in motion around 1276.5-1298.5 (black arrow), which could force a retest of 1302.5 as resistance this week. It’s the demand that caught our interest here.
Beyond the parapets of the current weekly demand, the daily chart has eyes on a support area coming in at 1272.5-1261.5, which happens to align with a trend line support (taken from the low 1160.3).
Areas of consideration:
The green zone on the H4 timeframe at 1282.2/1286.2 remains of interest for longs despite its lacklustre movement.
For those already long from the said H4 zone (and survived Tuesday and Thursday’s move beneath 1282.2), the first take-profit target rests around H4 resistance at 1295.1, followed by weekly resistance at 1302.5.
The accuracy, completeness and timeliness of the information contained on this site cannot be guaranteed. IC Markets does not warranty, guarantee or make any representations, or assume any liability with regard to financial results based on the use of the information in the site.
News, views, opinions, recommendations and other information obtained from sources outside of www.icmarkets.com.au, used in this site are believed to be reliable, but we cannot guarantee their accuracy or completeness. All such information is subject to change at any time without notice. IC Markets assumes no responsibility for the content of any linked site. The fact that such links may exist does not indicate approval or endorsement of any material contained on any linked site.
IC Markets is not liable for any harm caused by the transmission, through accessing the services or information on this site, of a computer virus, or other computer code or programming device that might be used to access, delete, damage, disable, disrupt or otherwise impede in any manner, the operation of the site or of any user’s software, hardware, data or property


