
DXY:
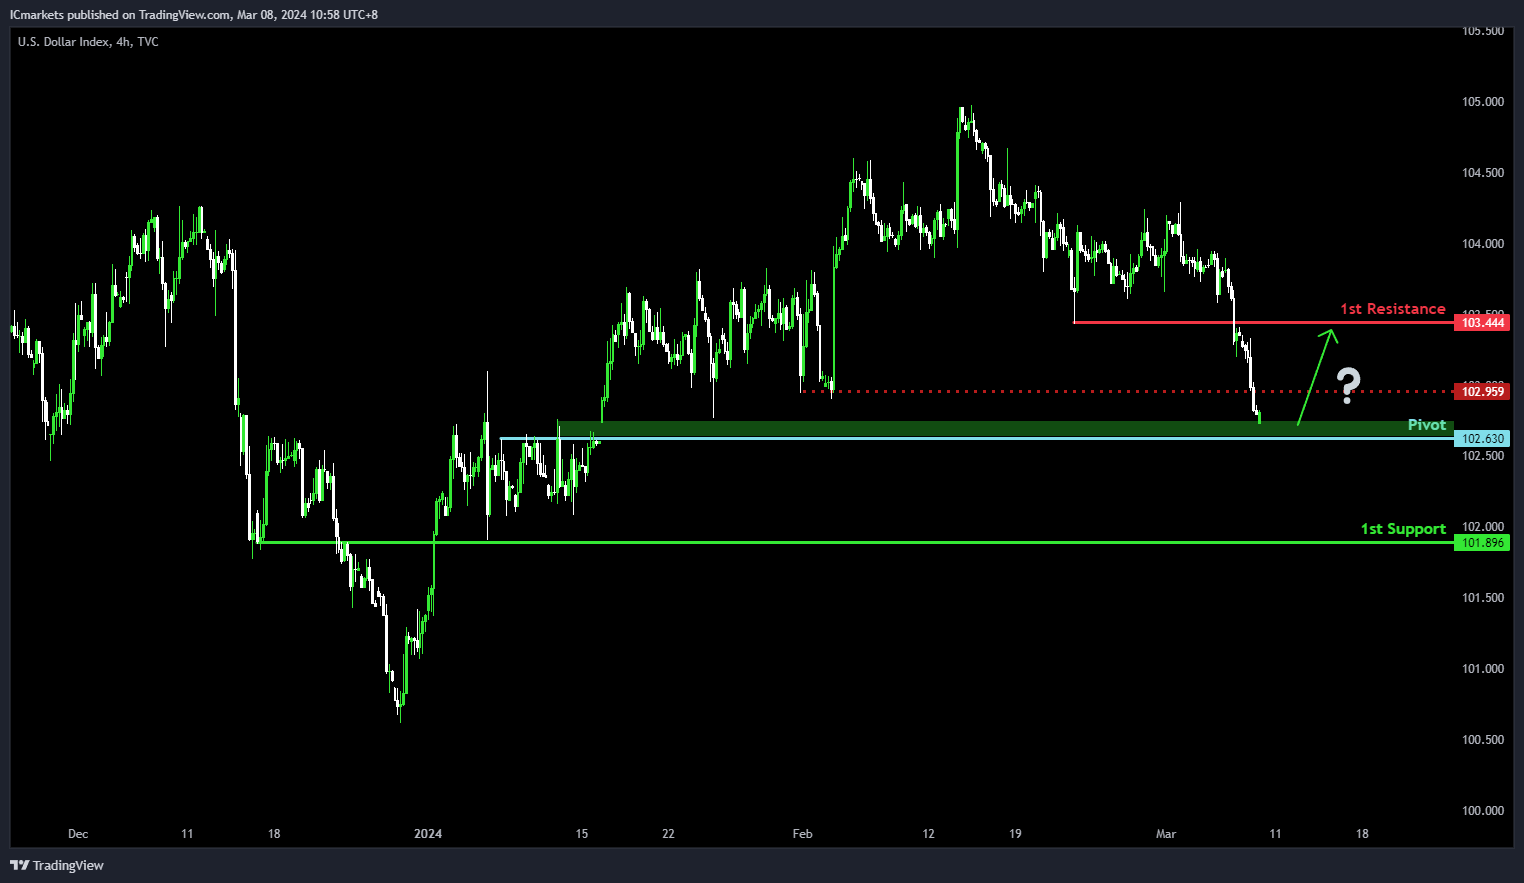
The DXY (US Dollar Index) chart currently maintains its bullish momentum, indicating a potential scenario of a bullish bounce off the pivot and a subsequent move towards the 1st resistance.
The pivot level at 102.63 serves as an overlap support, suggesting historical significance as a level where buying interest has previously emerged to support the price. Additionally, the 1st support at 101.89 is identified as an overlap support, further reinforcing its importance as a level
On the resistance side, the 1st resistance level at 103.44 is noted as a pullback resistance, indicating its historical significance as a barrier where selling pressure may increase, potentially limiting upward movement. An intermediate resistance level at 102.95 is highlighted as a pullback resistance.
EUR/USD:
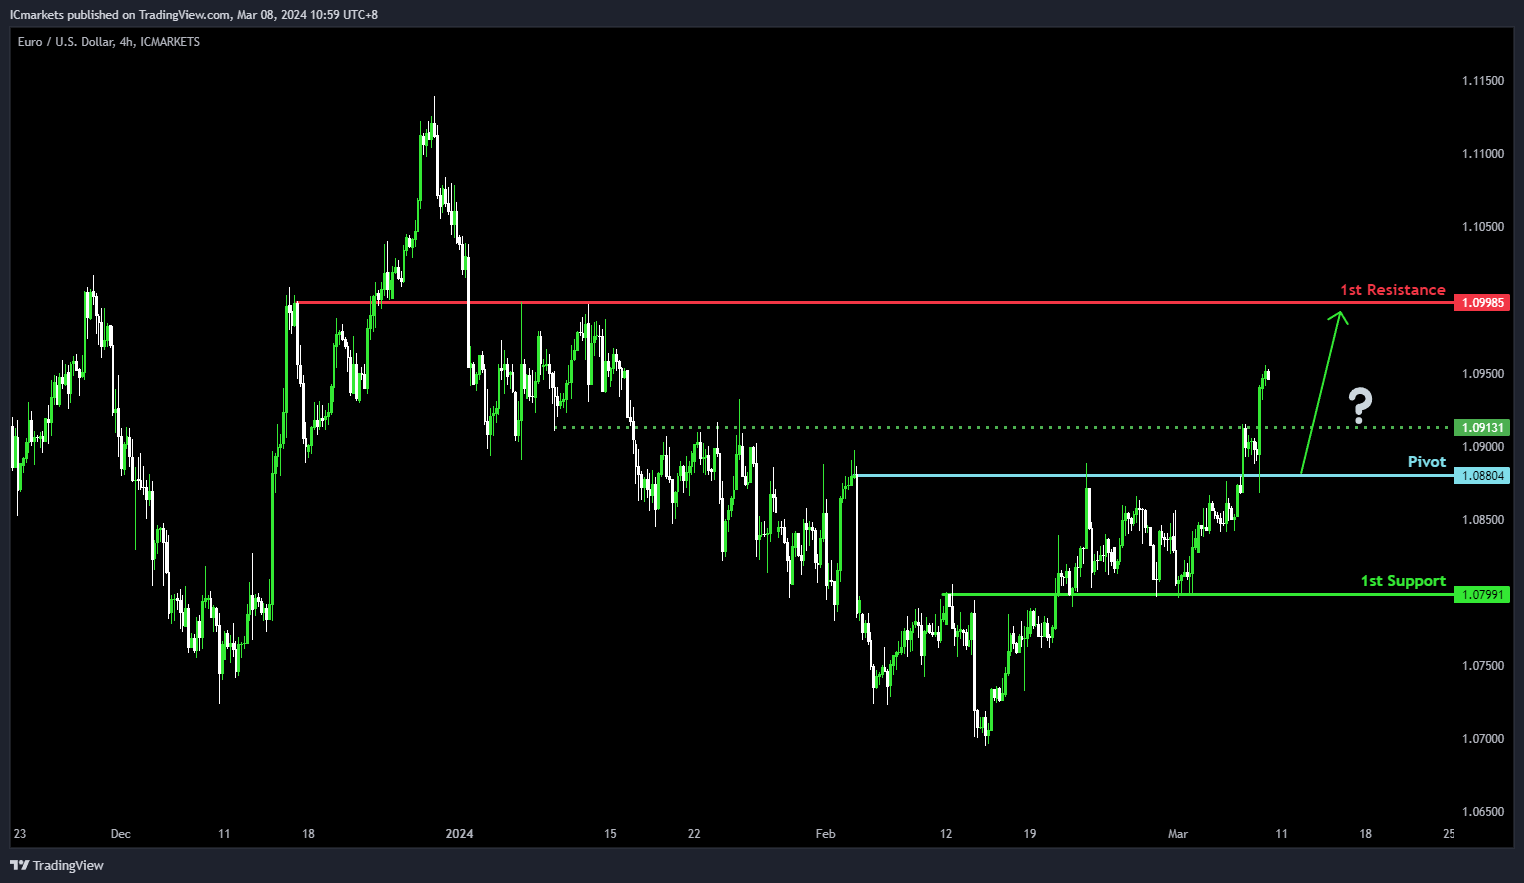
The EUR/USD chart currently exhibits bullish momentum, suggesting a potential scenario of a bullish bounce off the pivot and a subsequent move towards the 1st resistance.
The pivot level at 1.0880 is identified as an overlap support, indicating historical significance as a level where buying interest has previously emerged to support the price. Additionally, the 1st support at 1.0799 is also noted as an overlap support, further reinforcing its importance as a level where price has historically found support.
On the resistance side, the 1st resistance level at 1.0998 is identified as an overlap resistance, suggesting its historical significance as a barrier where selling pressure may increase, potentially limiting upward movement.
EUR/JPY:
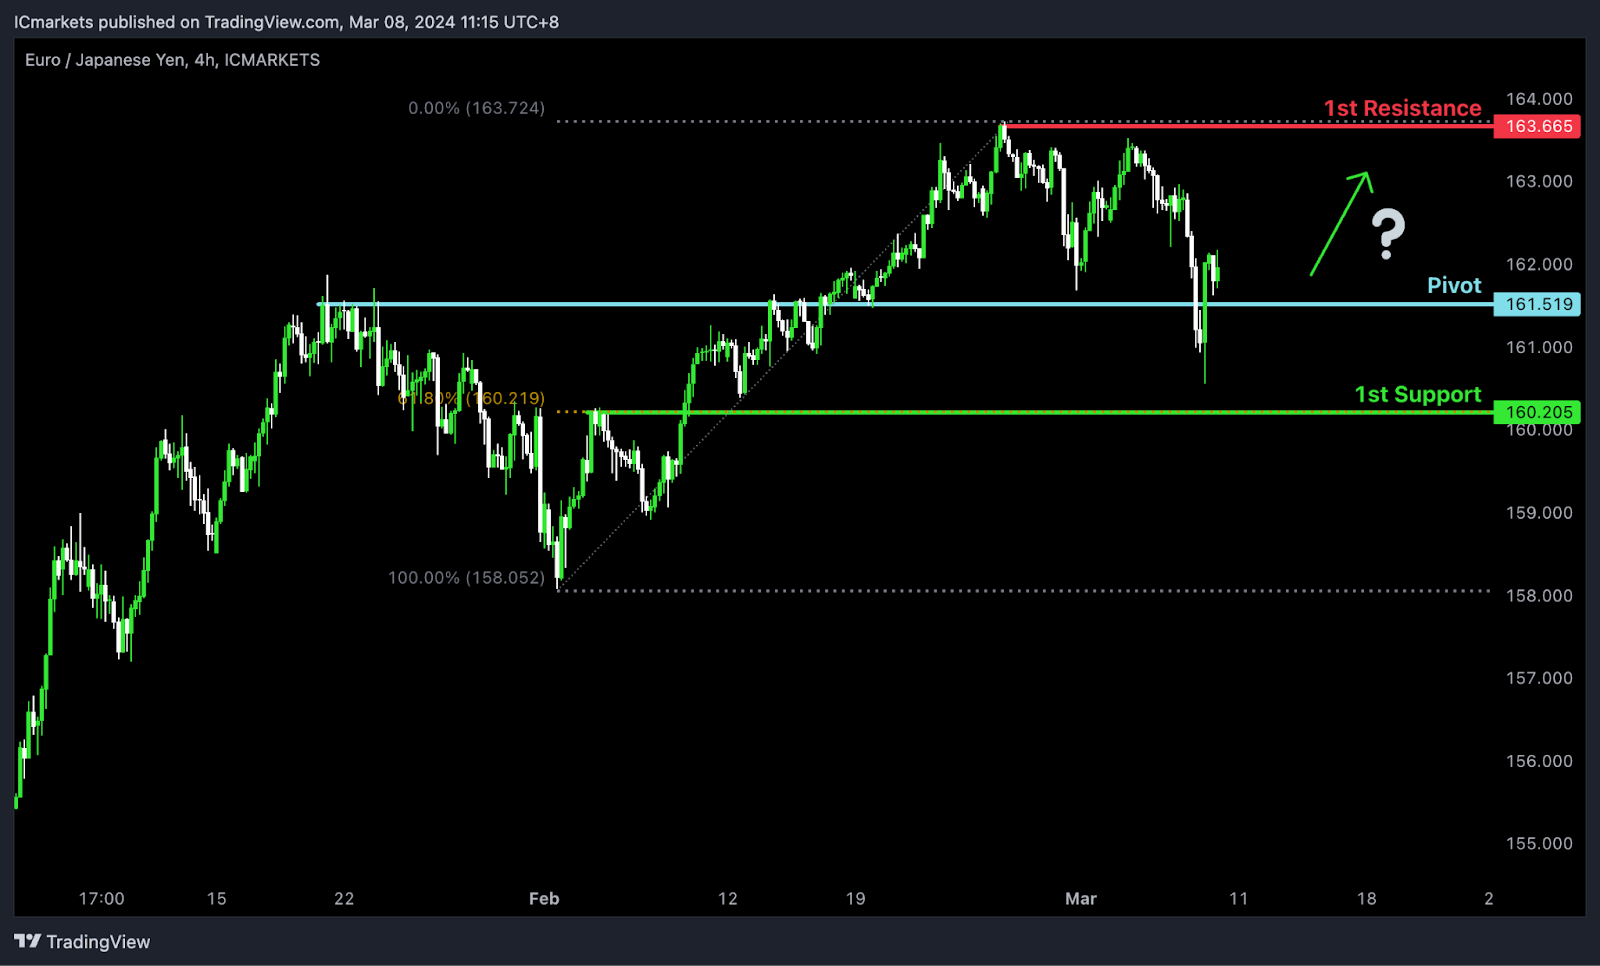
The EUR/JPY chart currently demonstrates bullish momentum, suggesting a potential continuation of the upward trend. Several key levels support the possibility of a bullish movement towards the 1st resistance.
The Pivot level at 161.519 serves as an overlap support, indicating a significant historical level where buying interest could emerge. Additionally, the 1st support at 160.205 aligns with a pullback support and coincides with the 61.80% Fibonacci Retracement level, further reinforcing its significance as a potential area of support.
On the resistance side, the 1st resistance level at 163.665 is identified as a swing high resistance, suggesting a historical barrier to upward movement.
EUR/GBP:
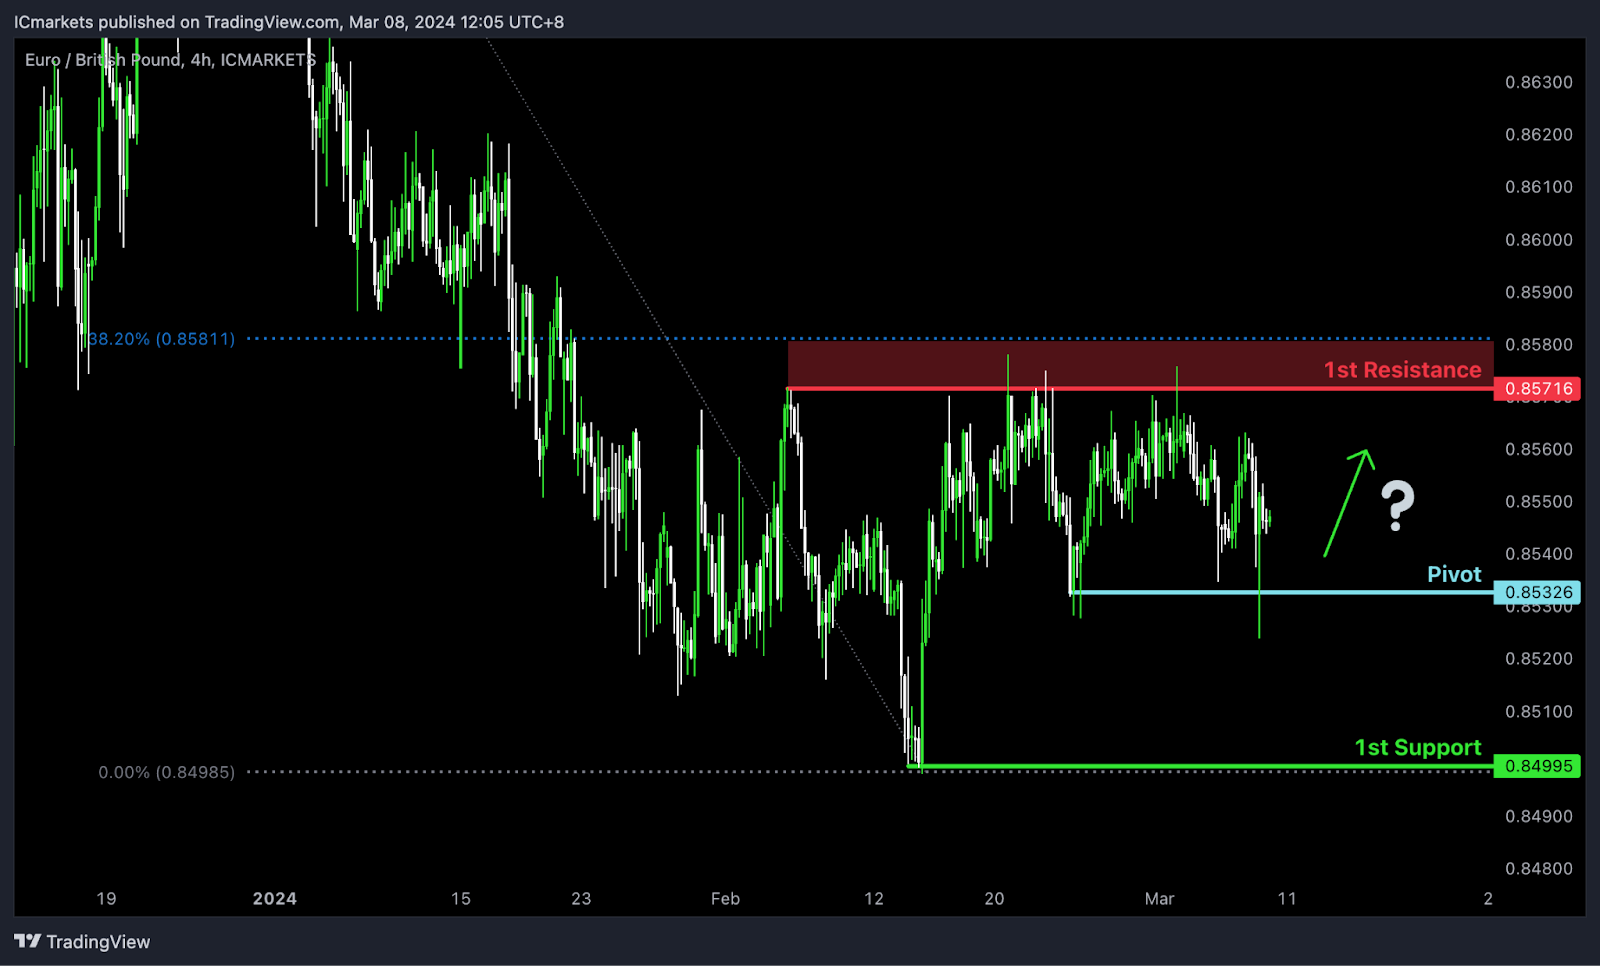
The EUR/GBP chart currently demonstrates neutral momentum, suggesting a potential fluctuation between the 1st resistance and 1st support levels. Key levels support this scenario.
The Pivot at 0.85326 serves as a swing low support, indicating historical buying interest. Another swing low support is observed at 0.89445, suggesting significant historical support.
On the resistance side, the 1st resistance at 0.85716 is identified as a swing high resistance and coincides with the 38.20% Fibonacci Retracement level, indicating a historical barrier to upward movement.
GBP/USD:
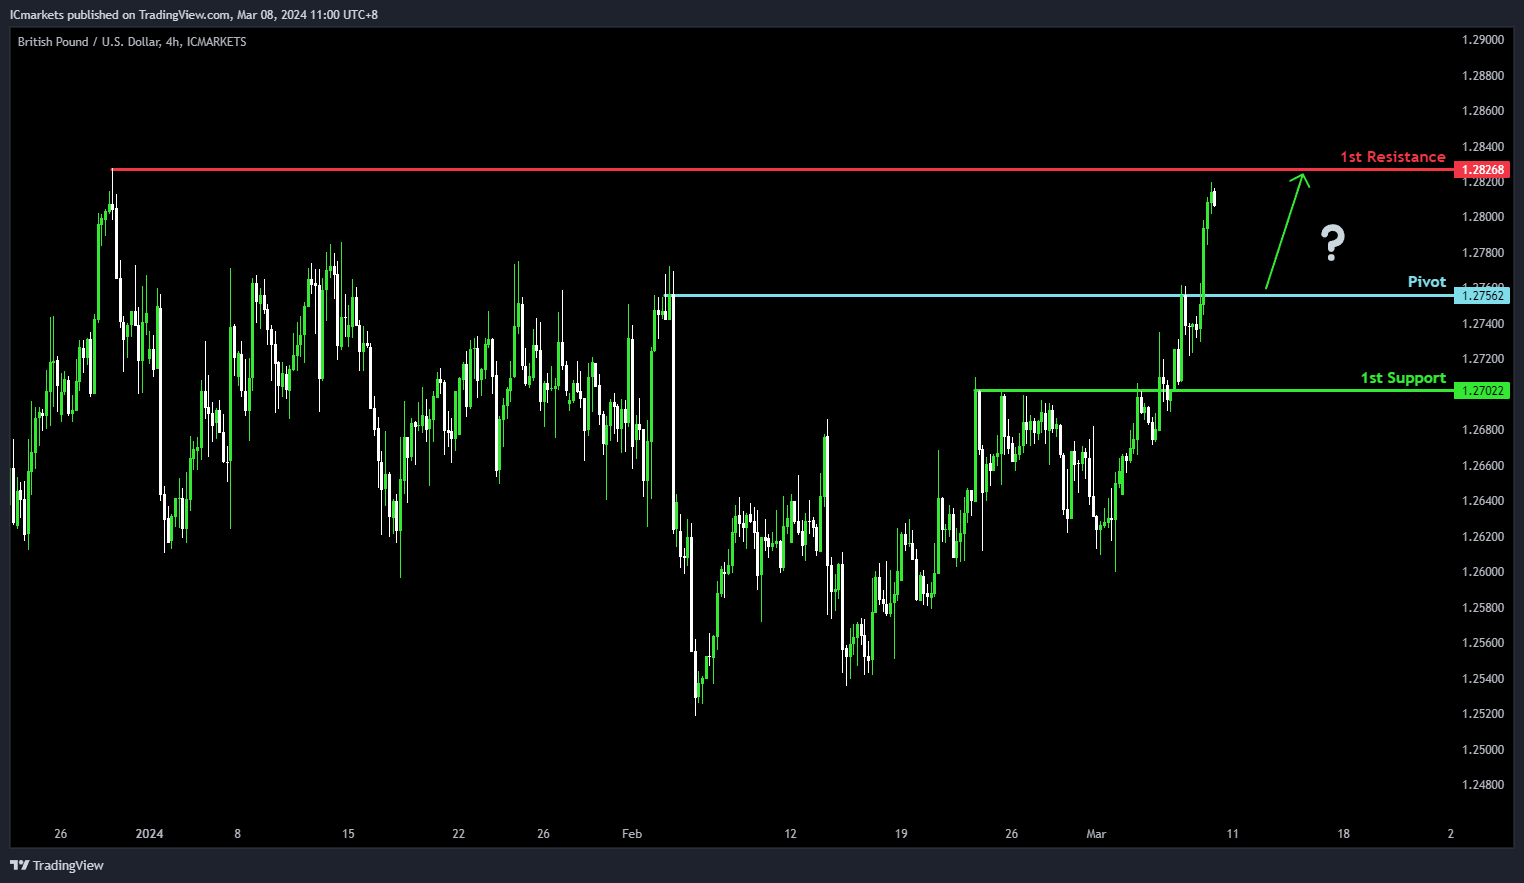
The GBP/USD chart currently shows bullish momentum, suggesting a potential scenario where the price could experience a bullish bounce off the pivot and move towards the 1st resistance.
The pivot level at 1.2756 is identified as a pullback support, indicating its significance as a level where buyers may step in to support the price, potentially leading to a bullish bounce. Additionally, the 1st support at 1.2702 is noted as an overlap support, further reinforcing its importance as a level where buying interest has historically emerged.
On the resistance side, the 1st resistance level at 1.2826 is identified as a swing high resistance, suggesting its historical significance as a level where selling pressure may increase, potentially limiting further upward movement.
.
GBP/JPY:
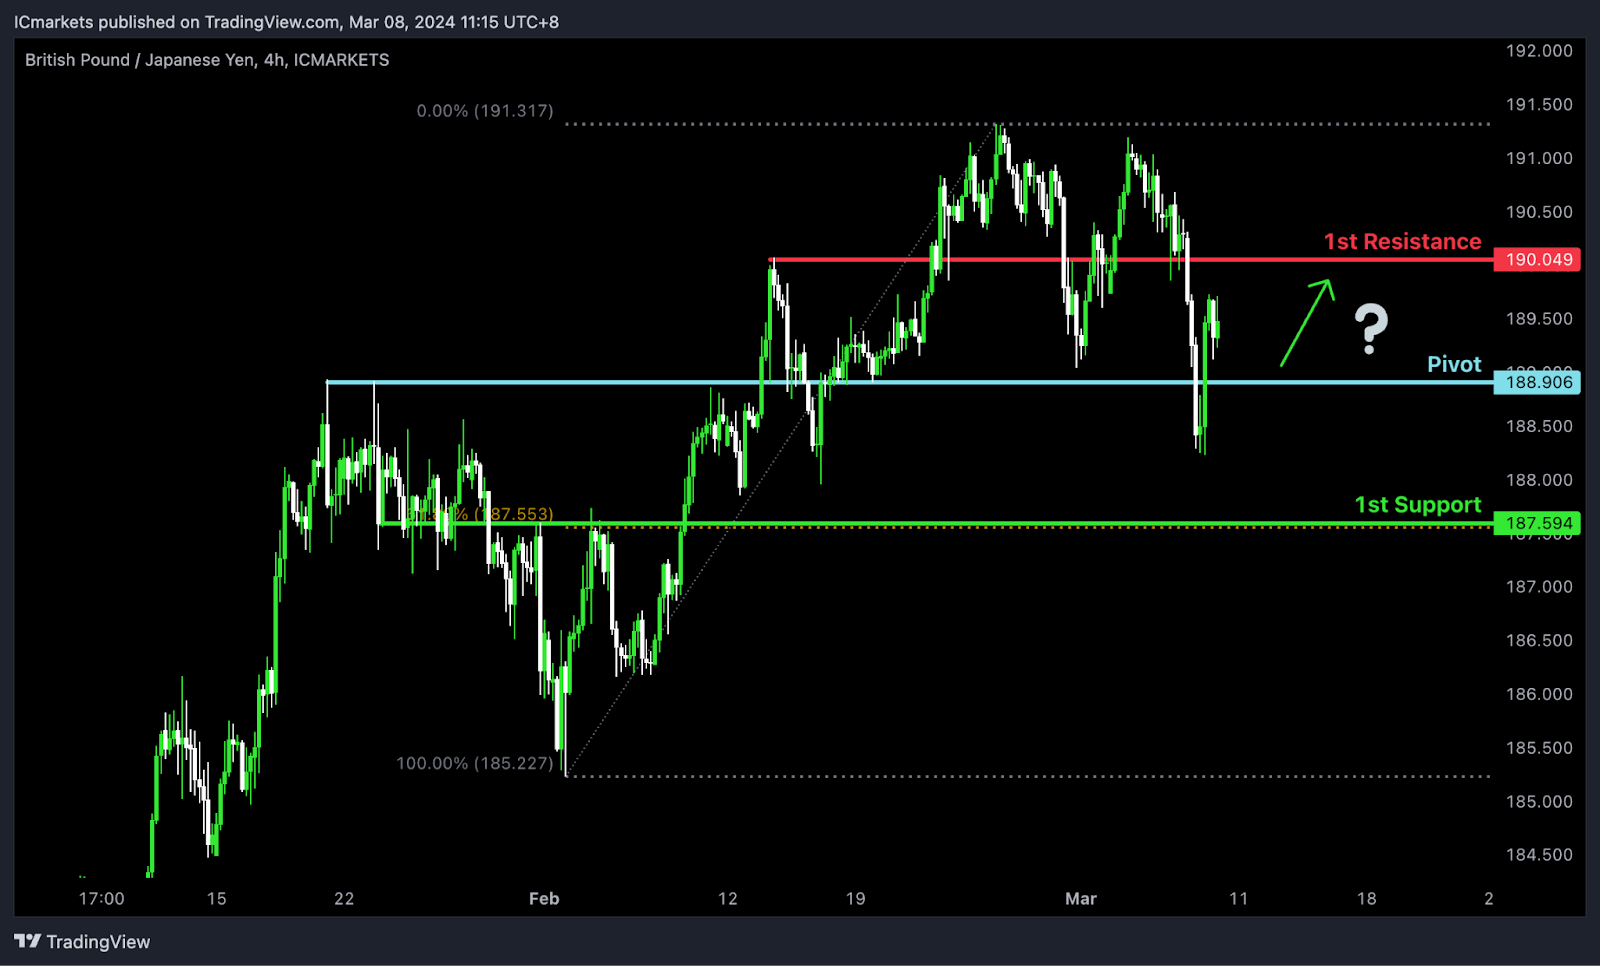
The GBP/JPY chart currently exhibits bullish momentum, indicating a potential continuation of the upward trend. Several key levels support the possibility of a bullish movement towards the 1st resistance.
The Pivot level at 188.906 serves as a pullback support, suggesting a significant historical level where buying interest may emerge. Furthermore, the 1st support at 187.594 aligns with an overlap support and the 61.80% Fibonacci Retracement, reinforcing its significance as a potential area of support.
On the resistance side, the 1st resistance level at 190.049 is identified as a pullback resistance, indicating a historical barrier to further upward movement.
USD/CHF:
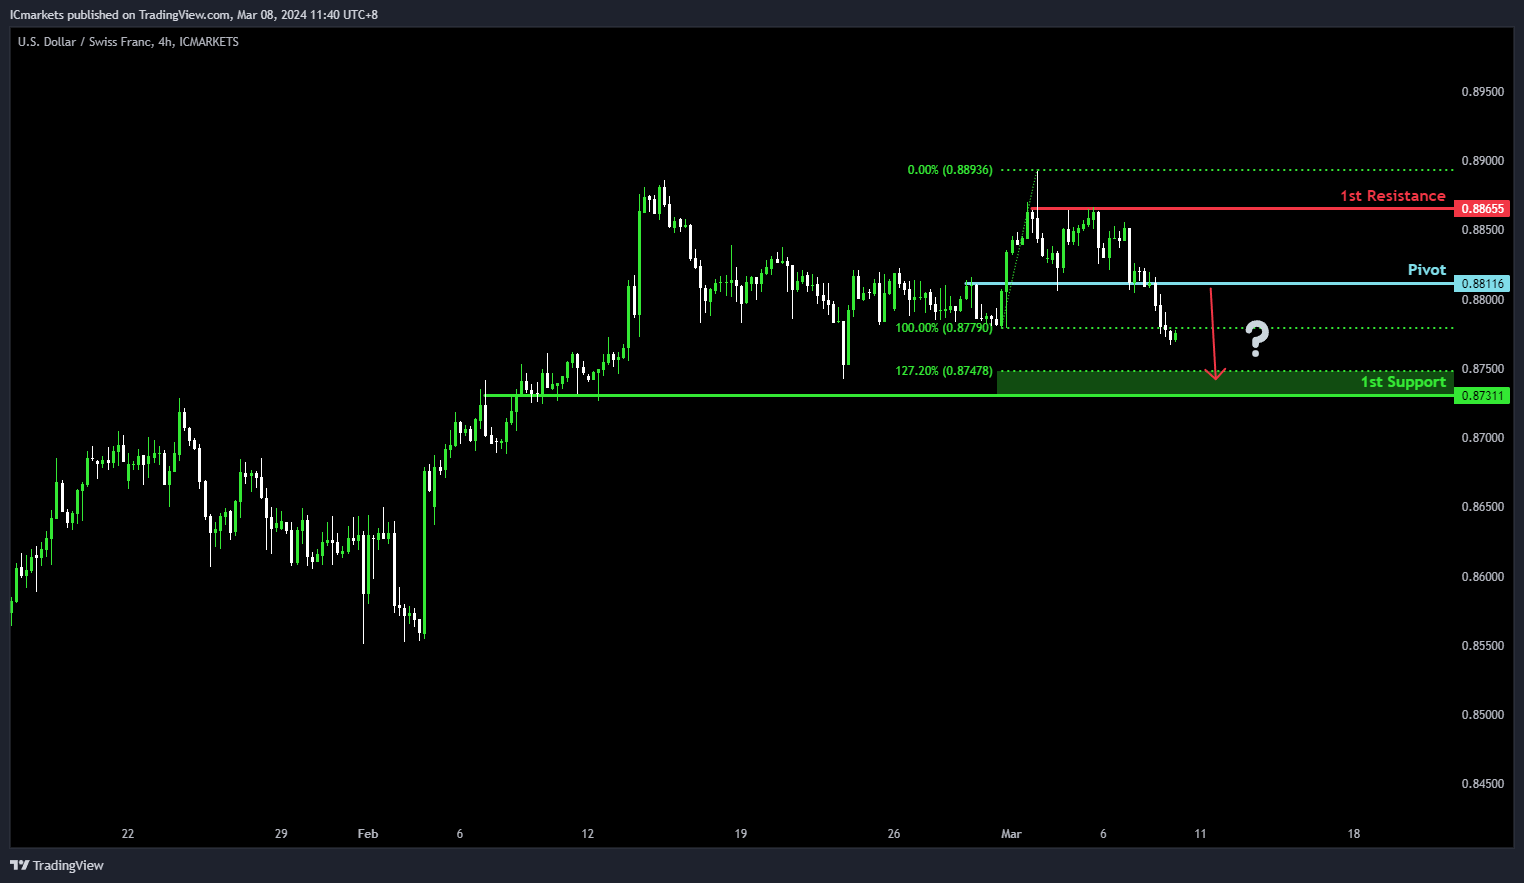
The USD/CHF chart currently exhibits bearish momentum, implying a potential scenario where the price might encounter a bearish reaction as it reaches the pivot level and subsequently declines towards the 1st support.
The pivot point at 0.8811 is recognized as a significant area of pullback resistance, accentuated by the presence of the 127.20% Fibonacci Extension. This indicates a level where selling pressure could escalate, potentially triggering a bearish response in the price. Moreover, the 1st support level at 0.8731 is identified as an overlap support, underscoring its historical role as a level where buying interest has traditionally emerged to provide support.
Conversely, the 1st resistance level at 0.8865 is noted as a multi-swing high resistance. This highlights its historical importance as a level where selling pressure has been notable, potentially constraining further upward movement in the price.
USD/JPY:
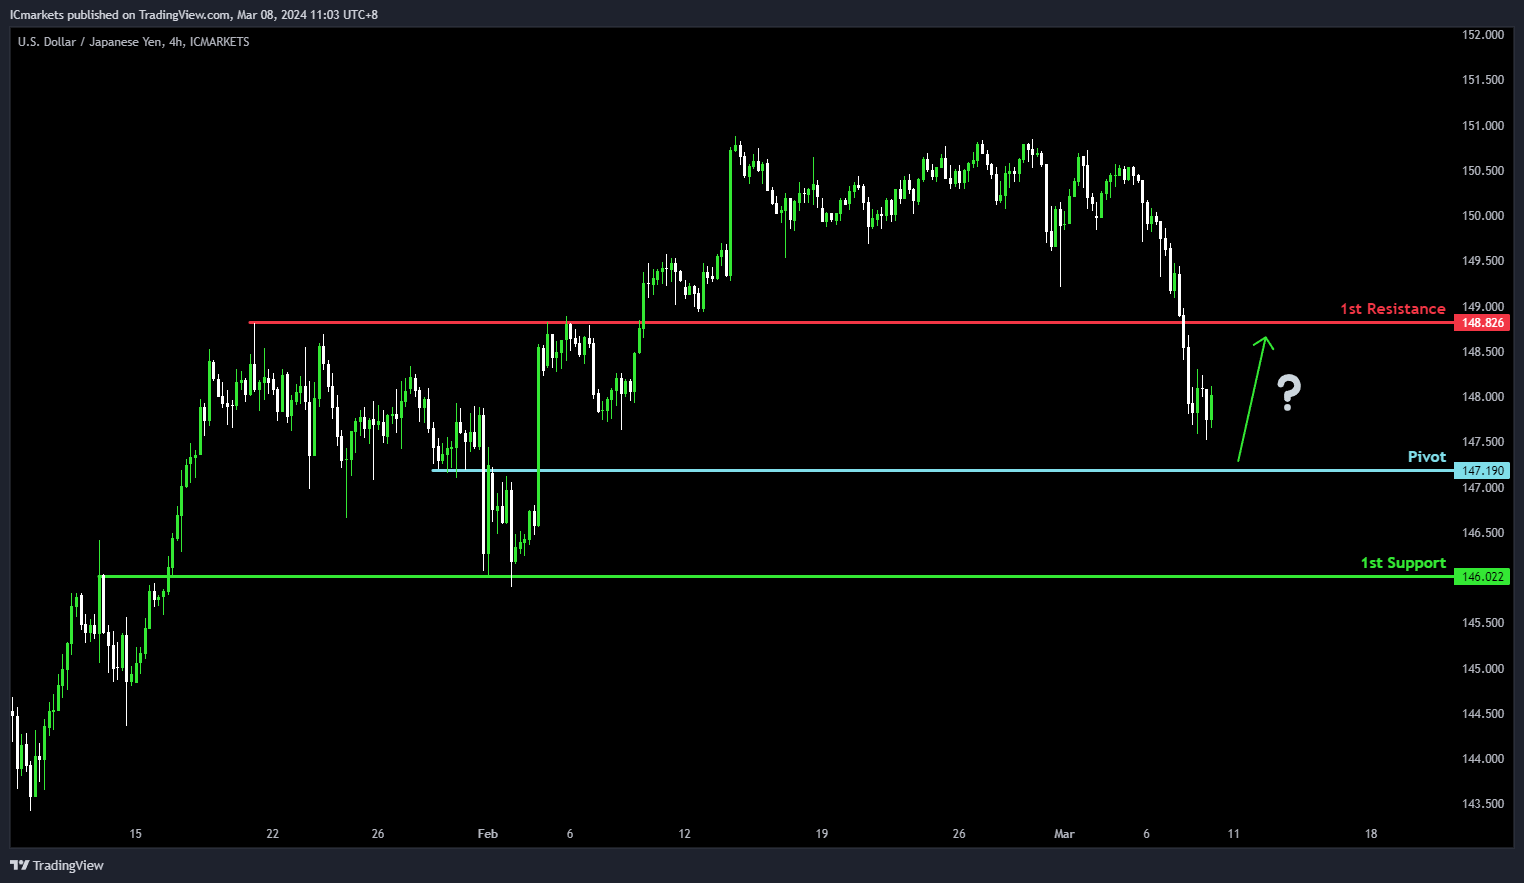
The USD/JPY chart currently displays bullish momentum, indicating a possible scenario where the price may undergo a bullish rebound upon reaching the pivot level and subsequently advance towards the 1st resistance.
The pivot point at 147.19 is recognized as a significant level of pullback support, suggesting its potential role as a level where buyers could intervene to support the price, facilitating a bullish rebound. Additionally, the 1st support level at 146.02 is identified as an overlap support, further bolstering its significance as a historical area where buying interest has been notable.
On the resistance side, the 1st resistance level at 148.82 is noted as a pullback resistance. This suggests its historical importance as a level where selling pressure may intensify, potentially limiting further upward movement in the price.
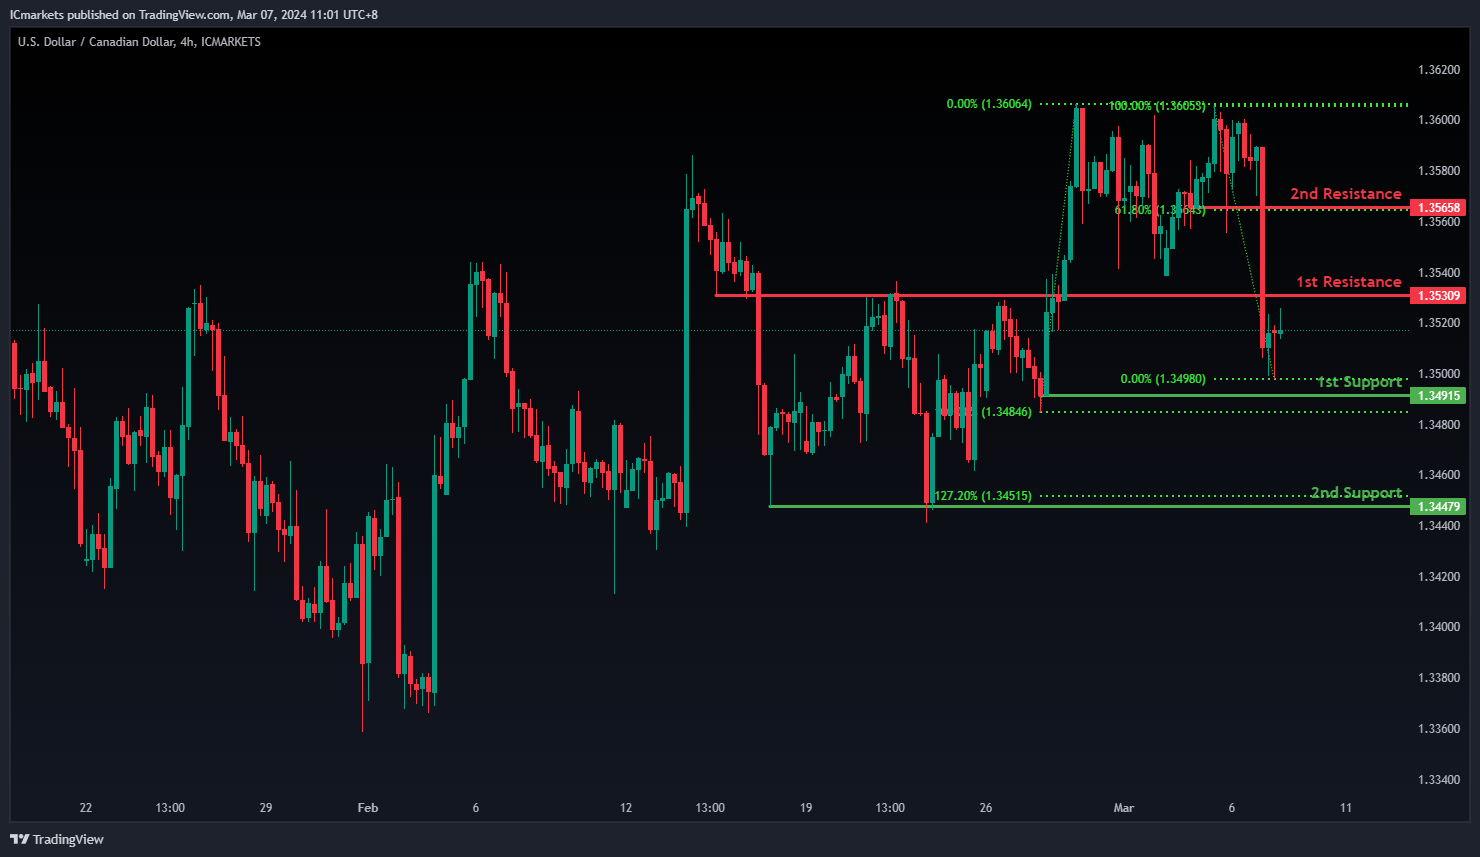
USD/CAD:
The USD/CAD chart currently exhibits an overall bearish momentum. In this context, there is a potential scenario for price to fall towards the 1st support.
The 1st support level at 1.3491 is identified as a pullback support. Further below, the 2nd support level at 1.3447 is also marked as a pullback support that aligns close to the 127.20% Fibonacci Extension level, reinforcing its significance as a key support level.
To the upside, the 1st resistance level at 1.3530 is identified as an overlap resistance. Higher up, the 2nd resistance level at 1.3565 is marked as a pullback resistance that aligns with the 61.80% Fibonacci retracement level, further highlighting its importance as a potential resistance zone.
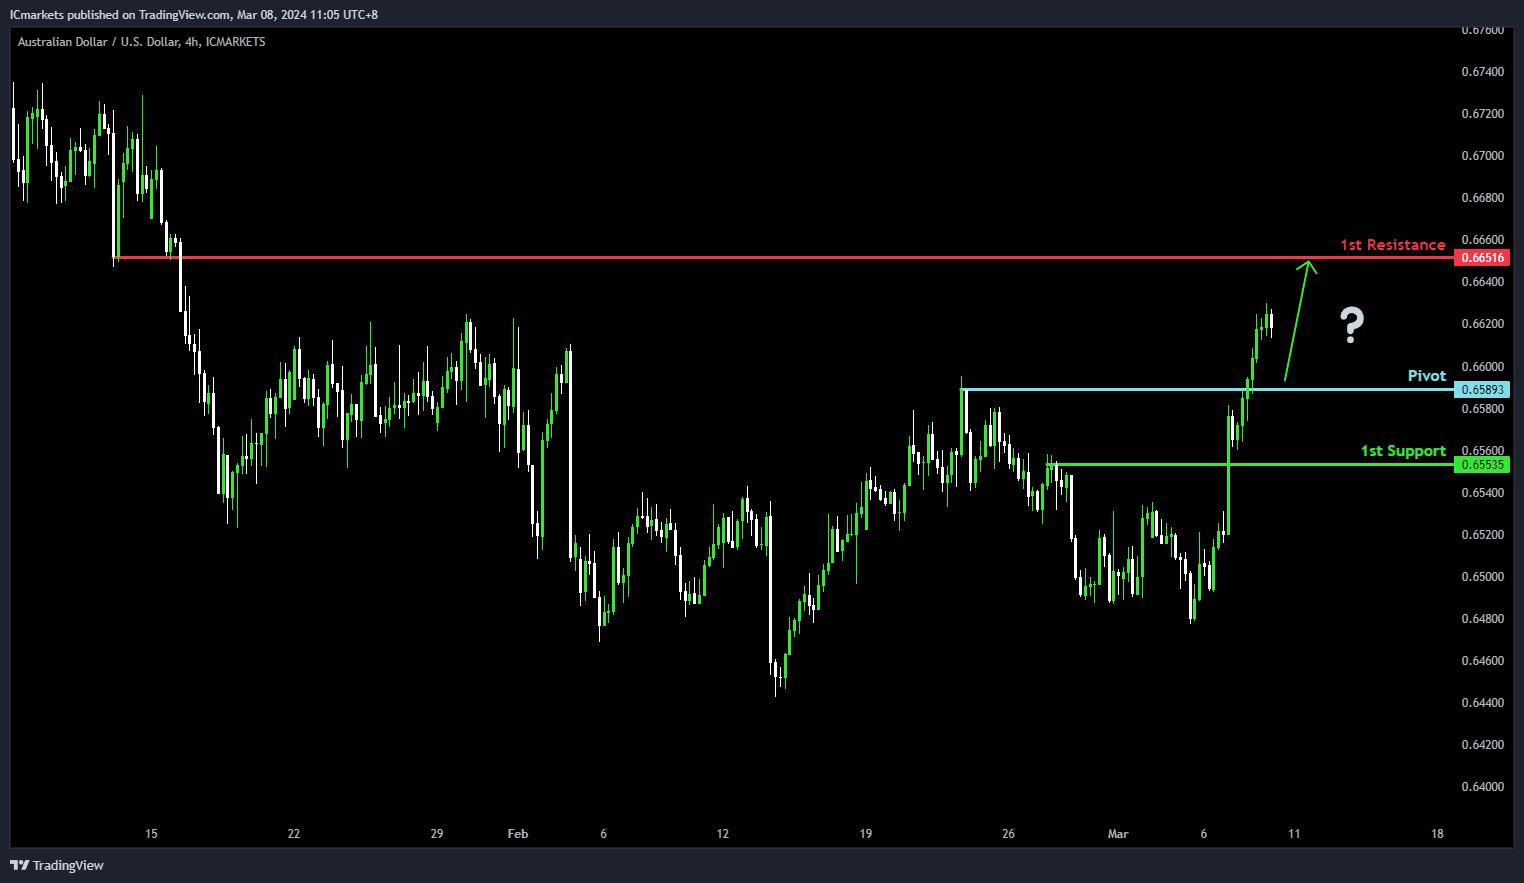
AUD/USD:
The AUD/USD chart currently demonstrates bullish momentum, suggesting a potential scenario where the price could experience a bullish rebound upon reaching the pivot level and subsequently advance towards the 1st resistance.
The pivot point at 0.6589 is identified as a significant level of pullback support, indicating its potential role as a level where buyers may intervene to support the price, potentially leading to a bullish bounce. Additionally, the 1st support level at 0.6553 is recognized as a pullback support, further reinforcing its significance as a historical area where buying interest has been notable.
On the resistance side, the 1st resistance level at 0.6651 is noted as a pullback resistance area. This level suggests a potential barrier where selling pressure may increase, potentially limiting further upward movement in the price.
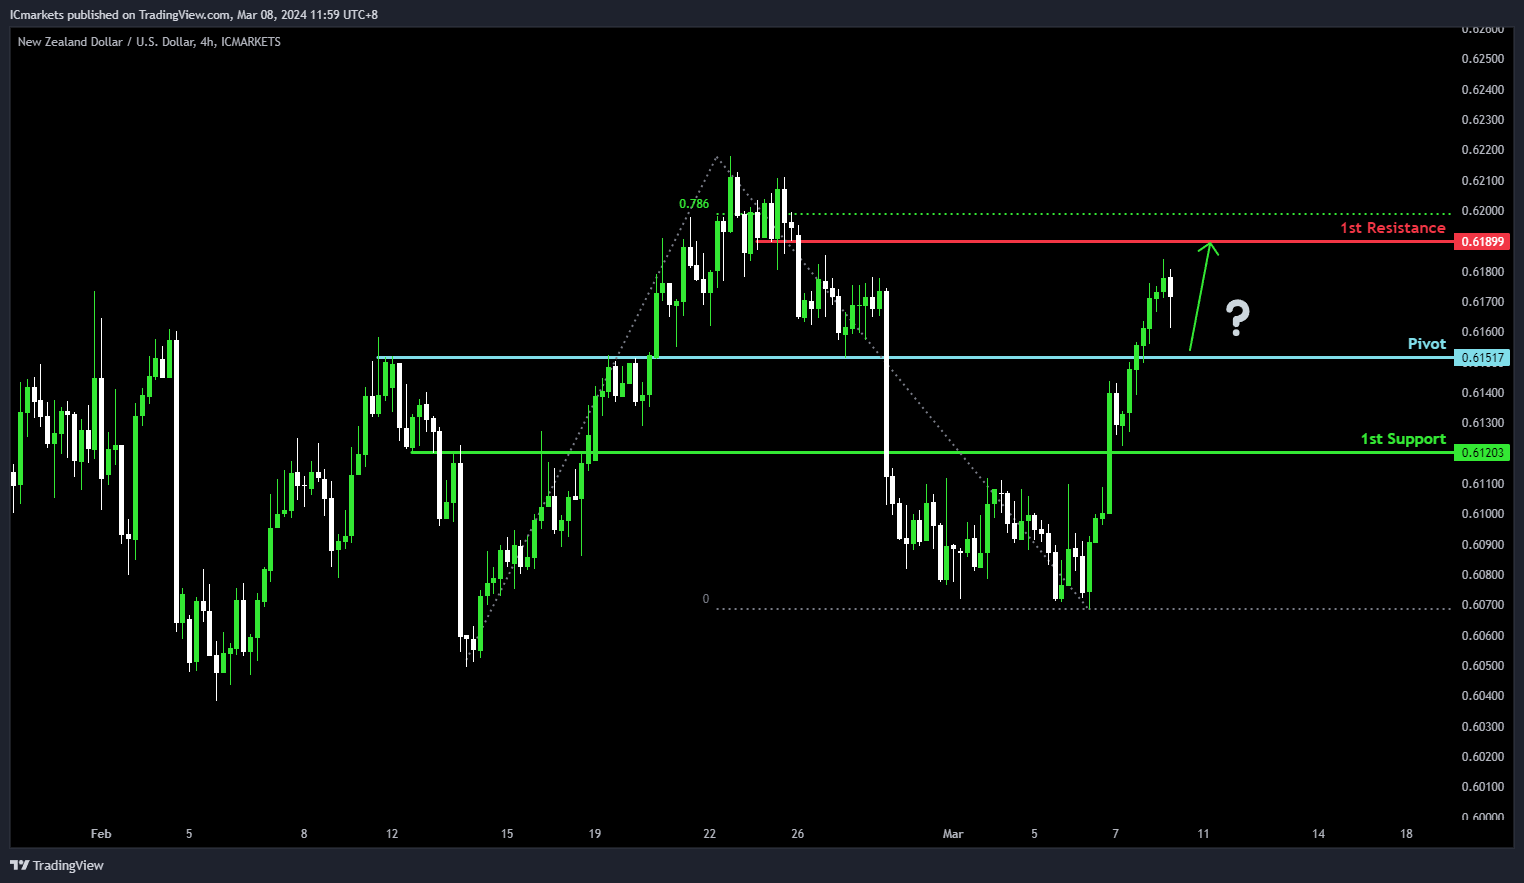
NZD/USD
The NZD/USD chart currently shows bullish momentum, indicating a potential scenario where the price could experience a bullish rebound upon reaching the pivot level and subsequently move towards the 1st resistance.
The pivot point at 0.6151 is identified as a significant level of pullback support, suggesting its potential role as a level where buyers might intervene to support the price, potentially leading to a bullish bounce. Additionally, the 1st support level at 0.6120 is recognized as an overlap support, further reinforcing its significance as a historical area where buying interest has been observed.
On the resistance side, the 1st resistance level at 0.6189 is noted as an overlap resistance area. This level may act as a barrier where selling pressure could increase, potentially limiting further upward movement in the price.
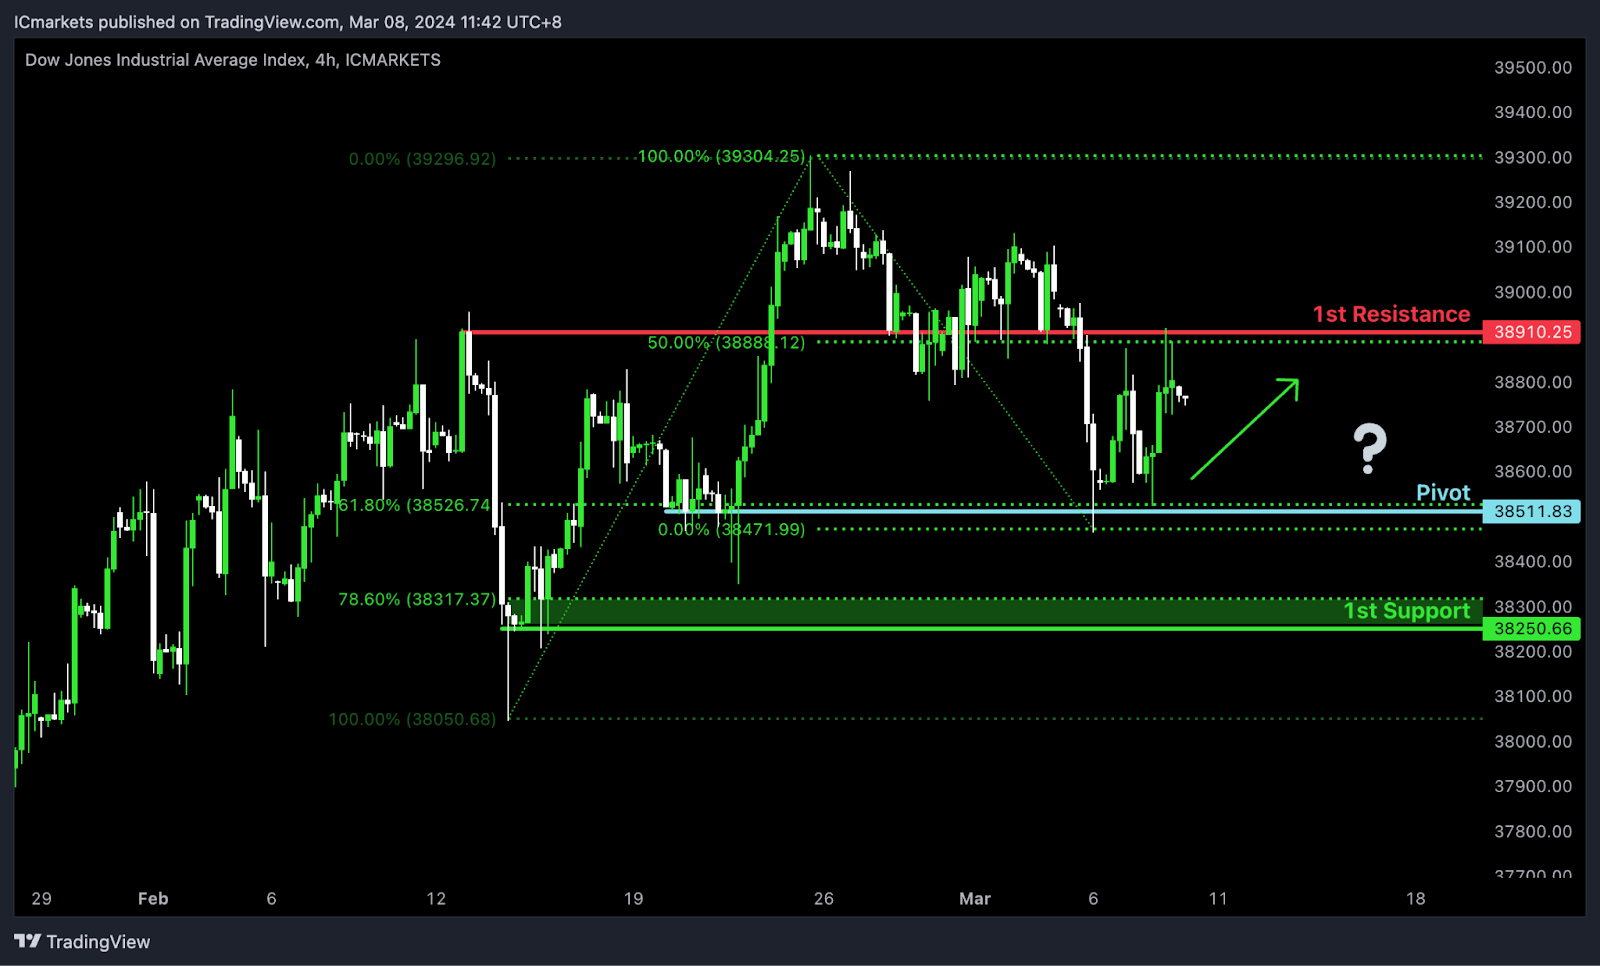
DJ30:
The DJ30 chart currently maintains a bullish momentum, indicating a potential continuation of the upward trend. Several key levels suggest the possibility of a bullish movement towards the 1st resistance.
The Pivot level at 38511.83 serves as a swing low support and coincides with the 61.80% Fibonacci Retracement, highlighting its significance as a historical level where buying interest could emerge. Additionally, the 1st support at 38250.66 aligns with another swing low support and the 78.60% Fibonacci Retracement, further reinforcing its importance as a potential area of support.
On the resistance side, the 1st resistance level at 38910.25 is identified as a pullback resistance, suggesting a historical barrier to further upward movement. The confluence with the 50% Fibonacci Retracement adds to its significance as a potential barrier.
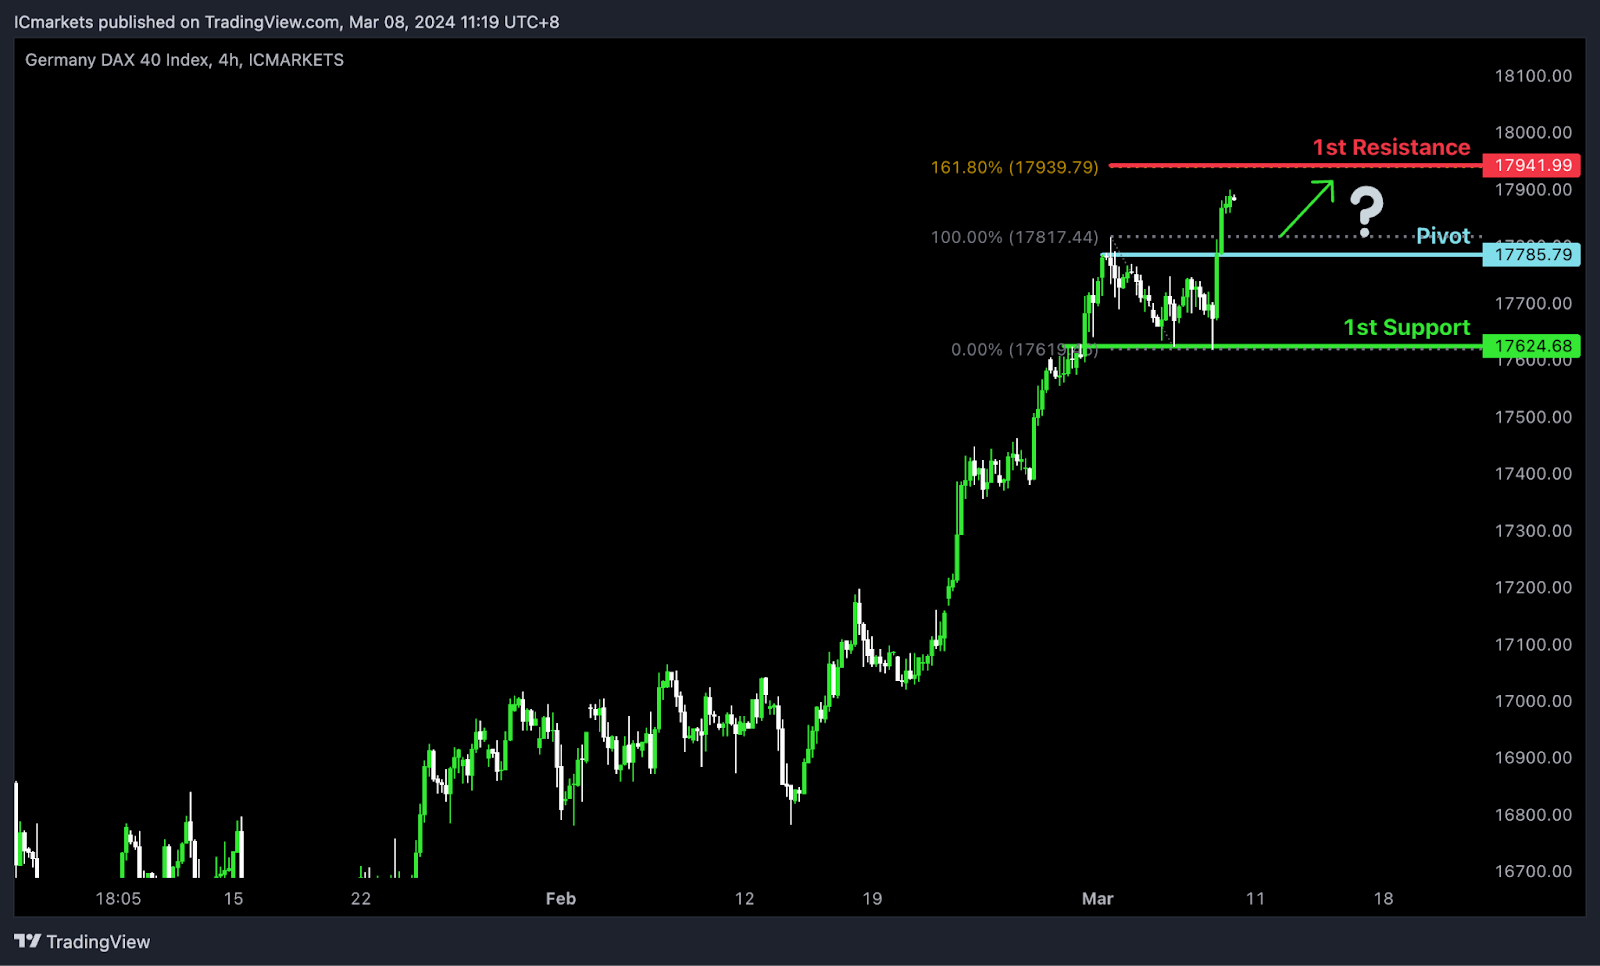
GER40:
The GER40 chart currently exhibits a bullish momentum, indicating a potential continuation of the upward trend. Several factors contribute to this momentum, supporting the possibility of a bullish movement towards the 1st resistance.
The Pivot level at 17785.78 serves as a pullback support, suggesting a significant historical level where buying interest might emerge. Furthermore, the 1st support at 17624.68 aligns with a swing low support, reinforcing its importance as a potential area of support.
On the resistance side, the 1st resistance level at 17941.99 corresponds to the 161.80% Fibonacci Extension, indicating a potential target for bullish continuation.
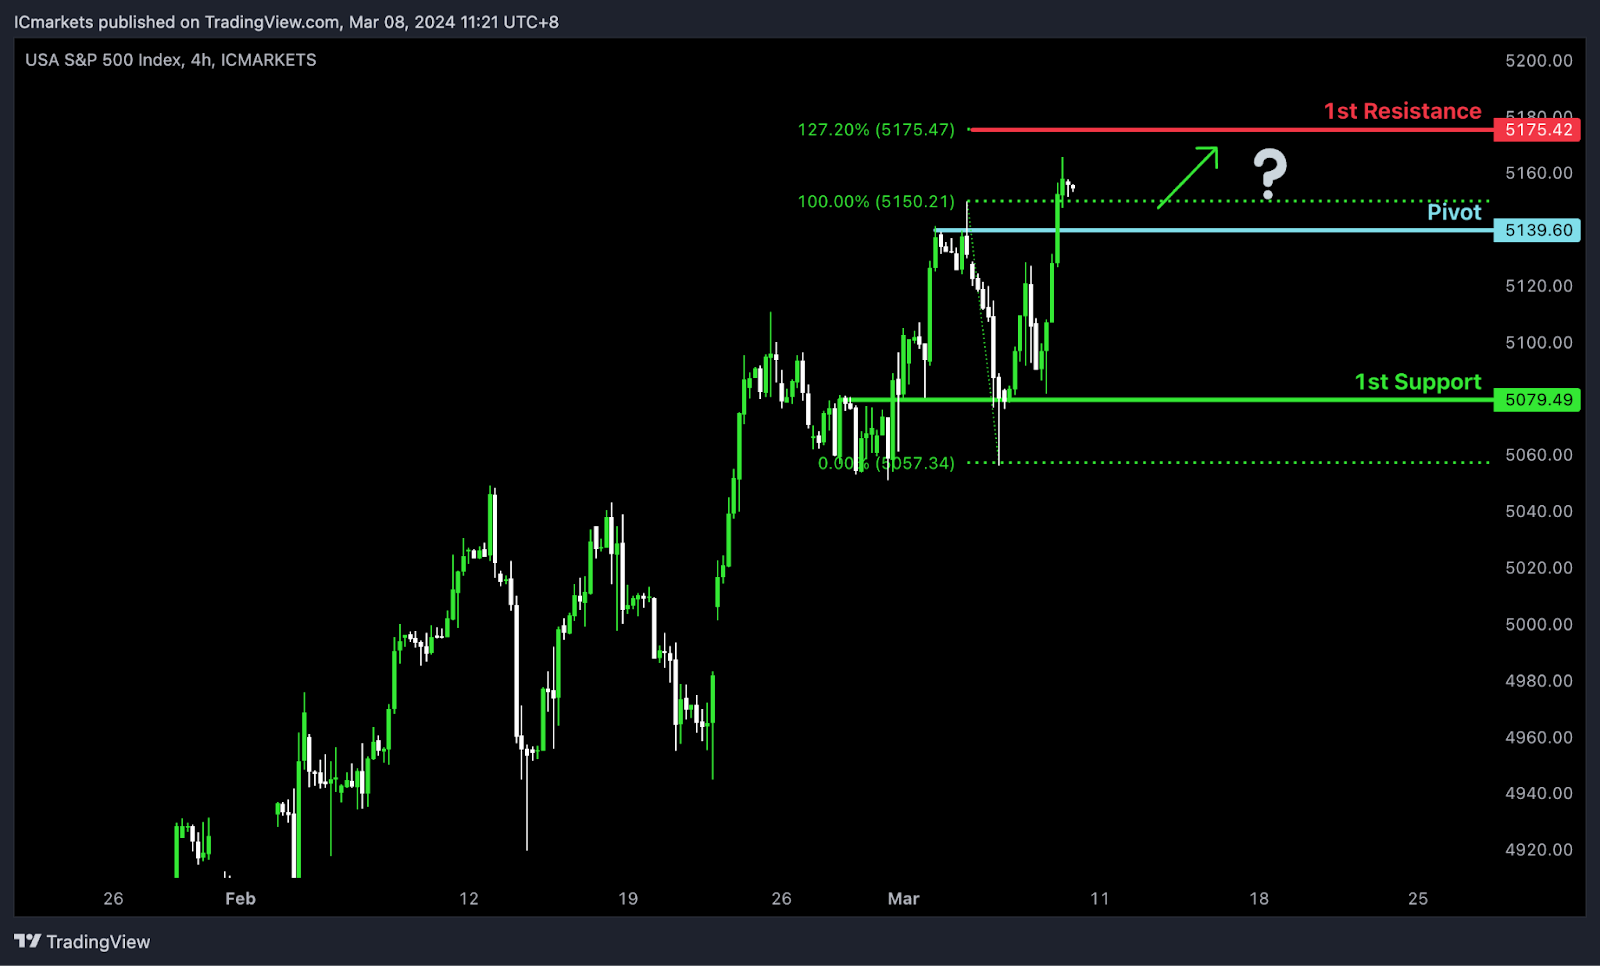
US500:
The US500 chart currently indicates bullish momentum, suggesting a potential continuation of the upward trend. There are indications that price might experience a bullish bounce off the 1st support level, heading towards the 1st resistance.
The Pivot level at 5139.60 serves as a pullback support, indicating a significant historical level where buying interest could emerge. Additionally, the 1st support at 5079.49 aligns with an overlap support, further reinforcing its significance as a potential area of support.
On the resistance side, the 1st resistance level at 5175.42 corresponds to the 127.20% Fibonacci Extension, suggesting a potential target for bullish movement.
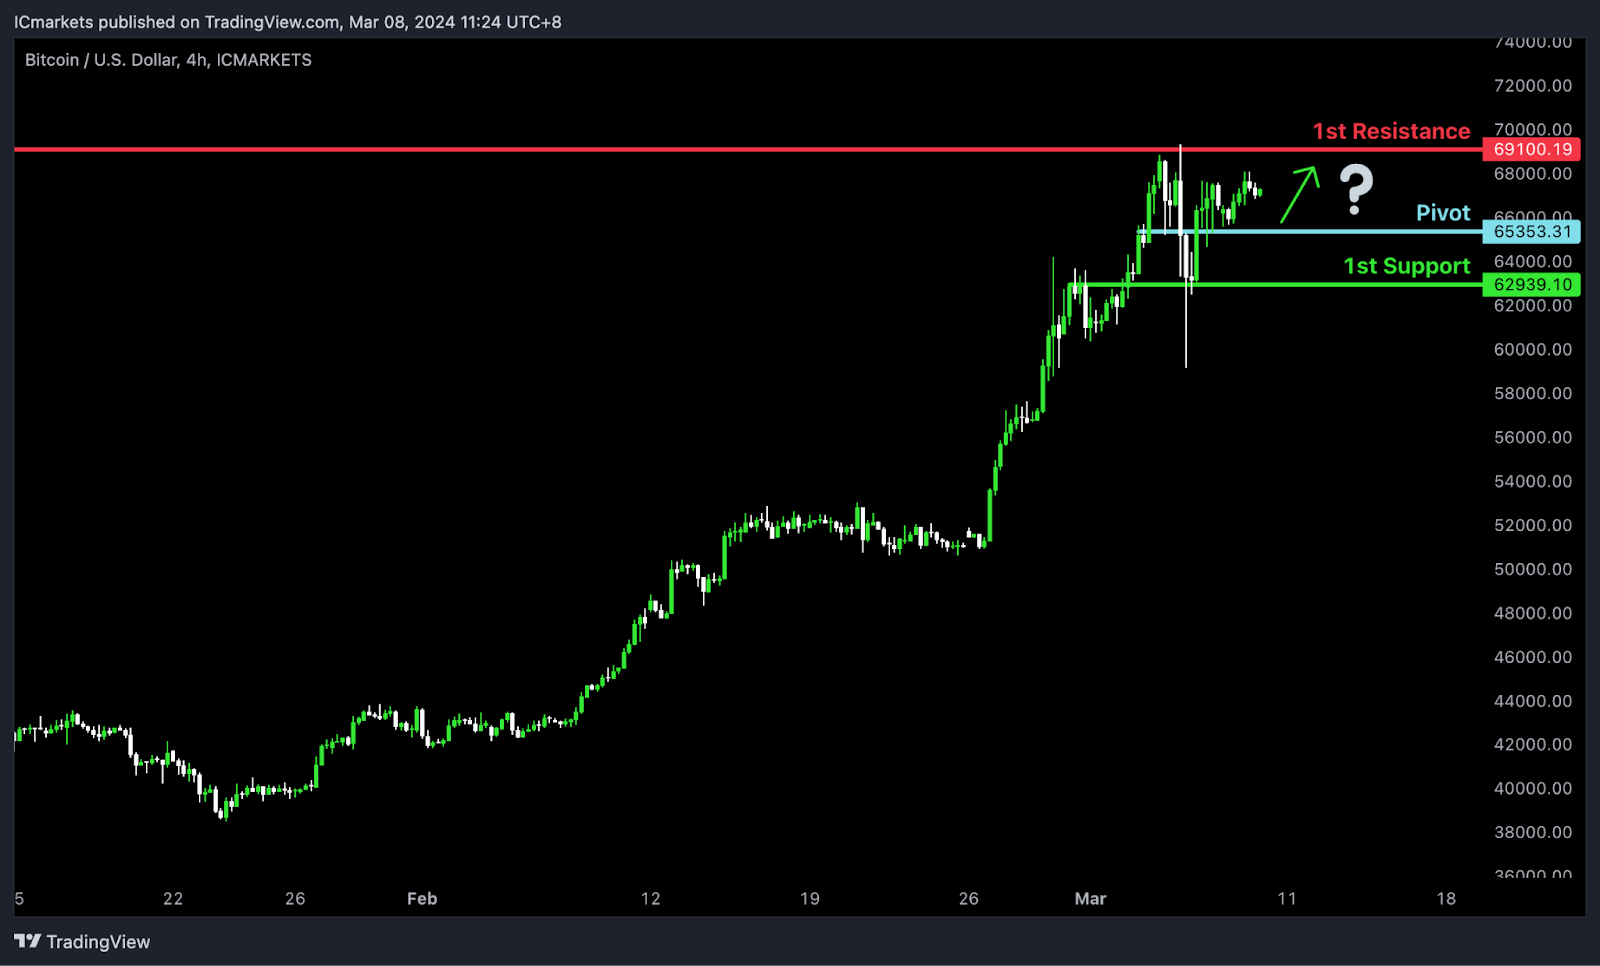
BTC/USD:
The BTC/USD chart currently demonstrates bullish momentum, suggesting a potential continuation of the upward trend. There are indications that price could potentially make a bullish continuation towards the 1st resistance level.
The Pivot level at 65353.31 serves as a pullback support, indicating a significant historical level where buying interest may emerge. Additionally, the 1st support at 62939.10 aligns with an overlap support, further reinforcing its significance as a potential area of support.
On the resistance side, the 1st resistance level at 69100.19 is identified as a swing high resistance, suggesting a historical barrier to upward movement.
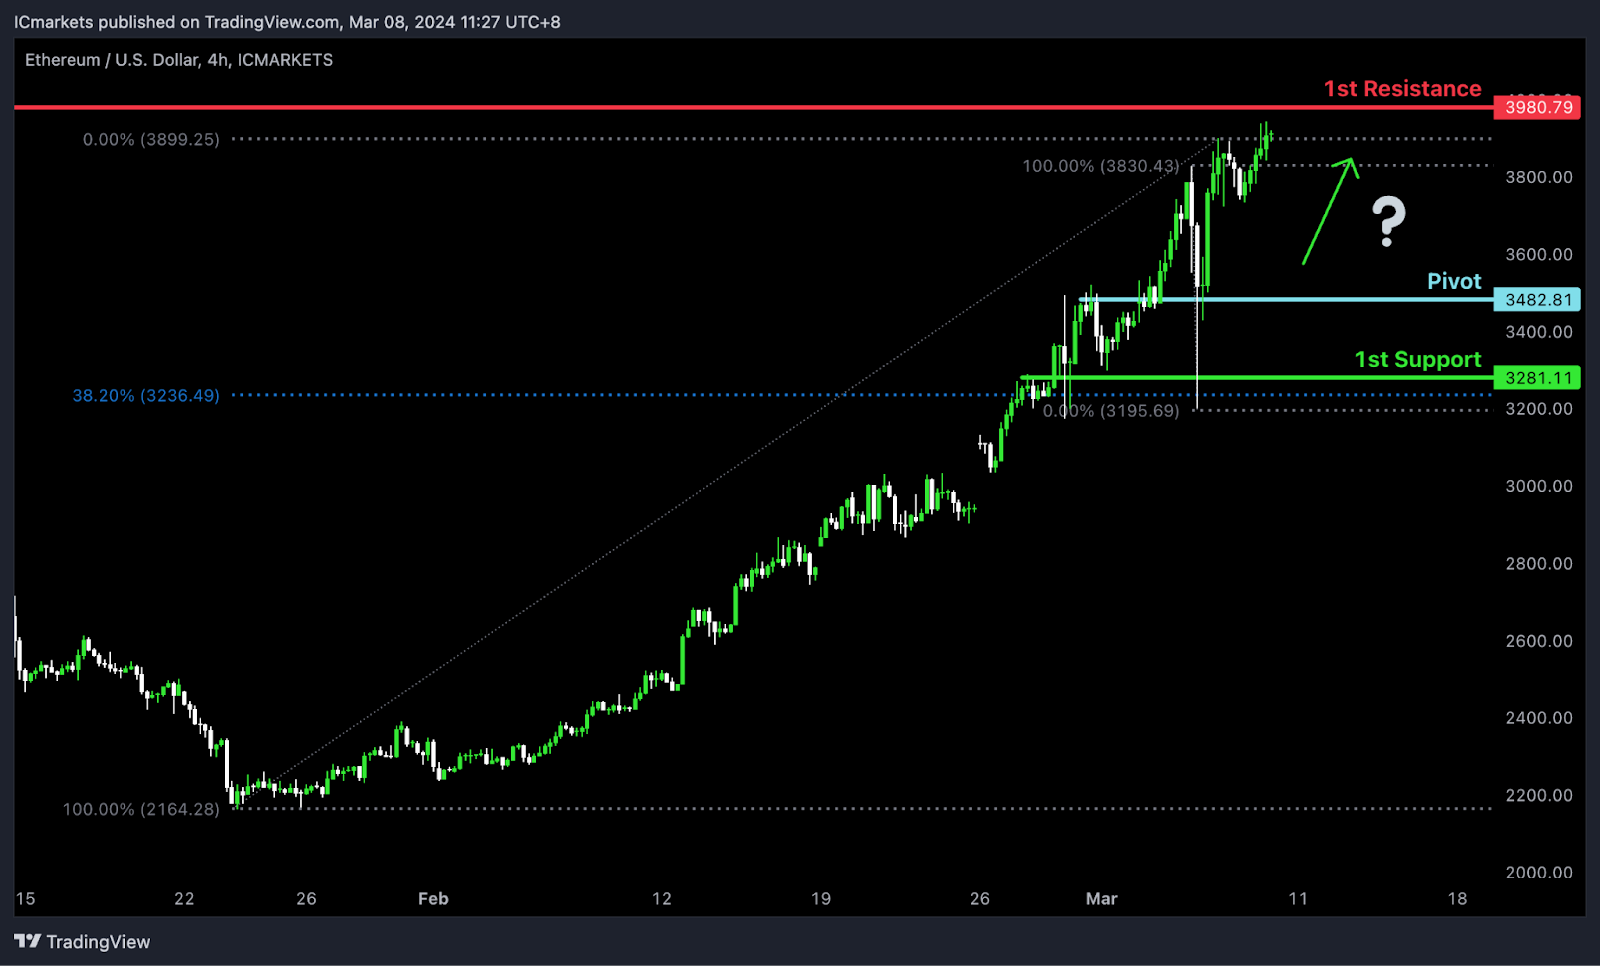
ETH/USD:
The ETH/USD chart currently exhibits bullish momentum, with several factors contributing to this outlook. There are indications that price could potentially make a bullish continuation towards the 1st resistance level.
The Pivot level at 3482.81 serves as an overlap support, indicating a significant historical level where buying interest is likely present. Additionally, the 1st support at 3281.11 aligns with another overlap support and coincides with the 38.20% Fibonacci Retracement level, further reinforcing its significance as a potential area of support.
On the resistance side, the 1st resistance level at 3980.79 is identified as an overlap resistance, suggesting a historical barrier to upward movement.
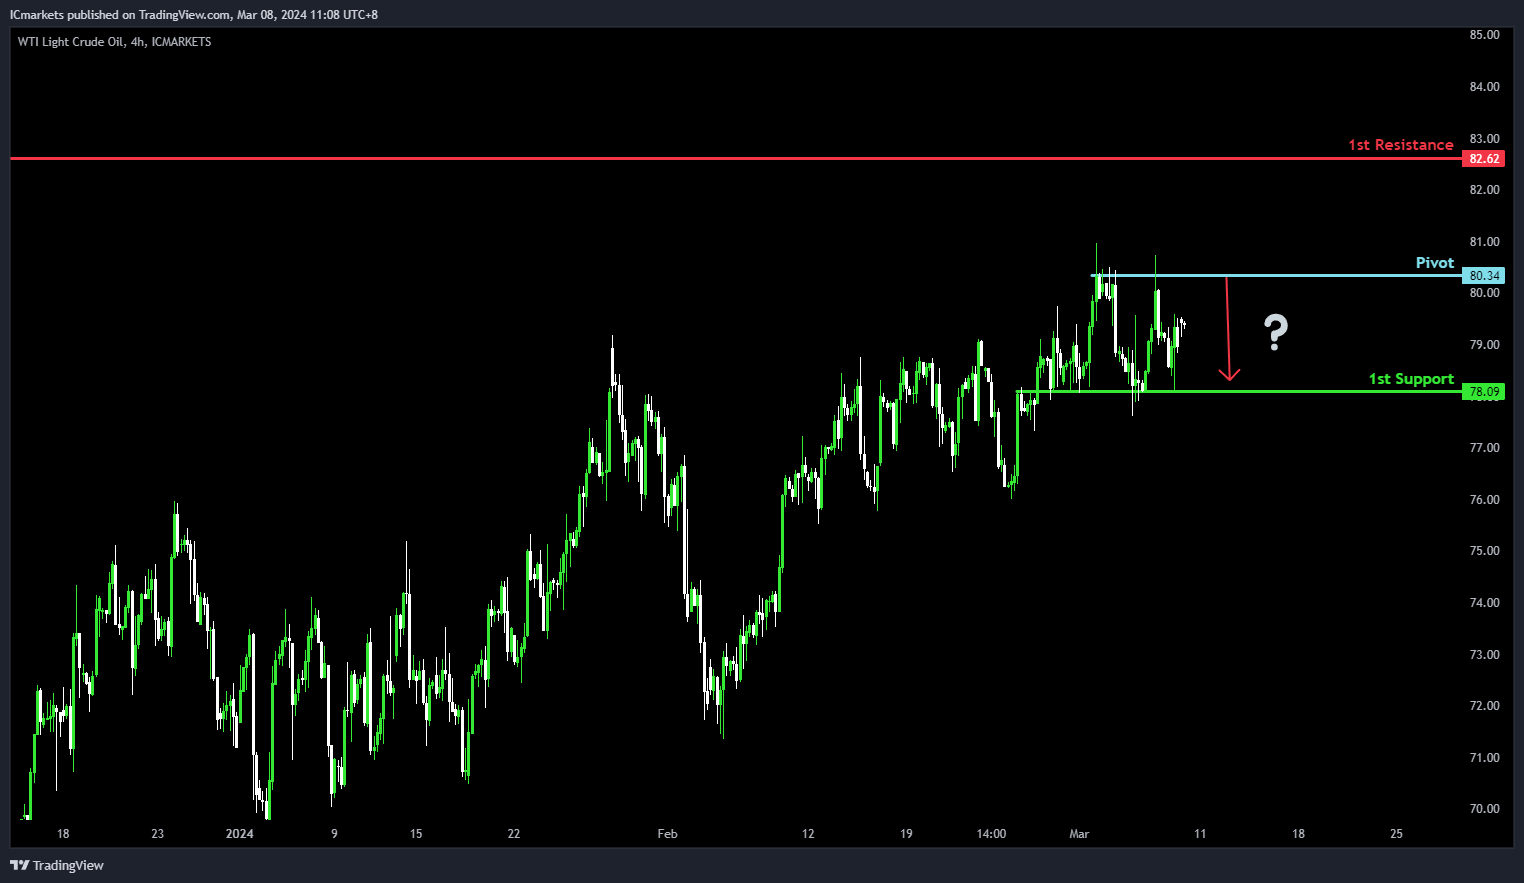
WTI/USD:
The WTI (West Texas Intermediate) chart currently demonstrates bearish momentum, suggesting a possible scenario where the price might experience a bearish reaction upon reaching the pivot level and subsequently decline towards the 1st support.
The pivot point at 80.34 is recognized as a significant level of multi-swing high resistance. This suggests its importance as a potential barrier where selling pressure may intensify, potentially leading to a bearish reaction in the price.
On the downside, the 1st support level at 78.09 is identified as an overlap support, indicating its historical significance as a level where buying interest has emerged, potentially offering support for the price during a decline.
Conversely, the 1st resistance level at 82.62 is noted as a pullback resistance, suggesting its historical importance as a barrier where selling pressure may increase, potentially limiting upward movement in the short term.
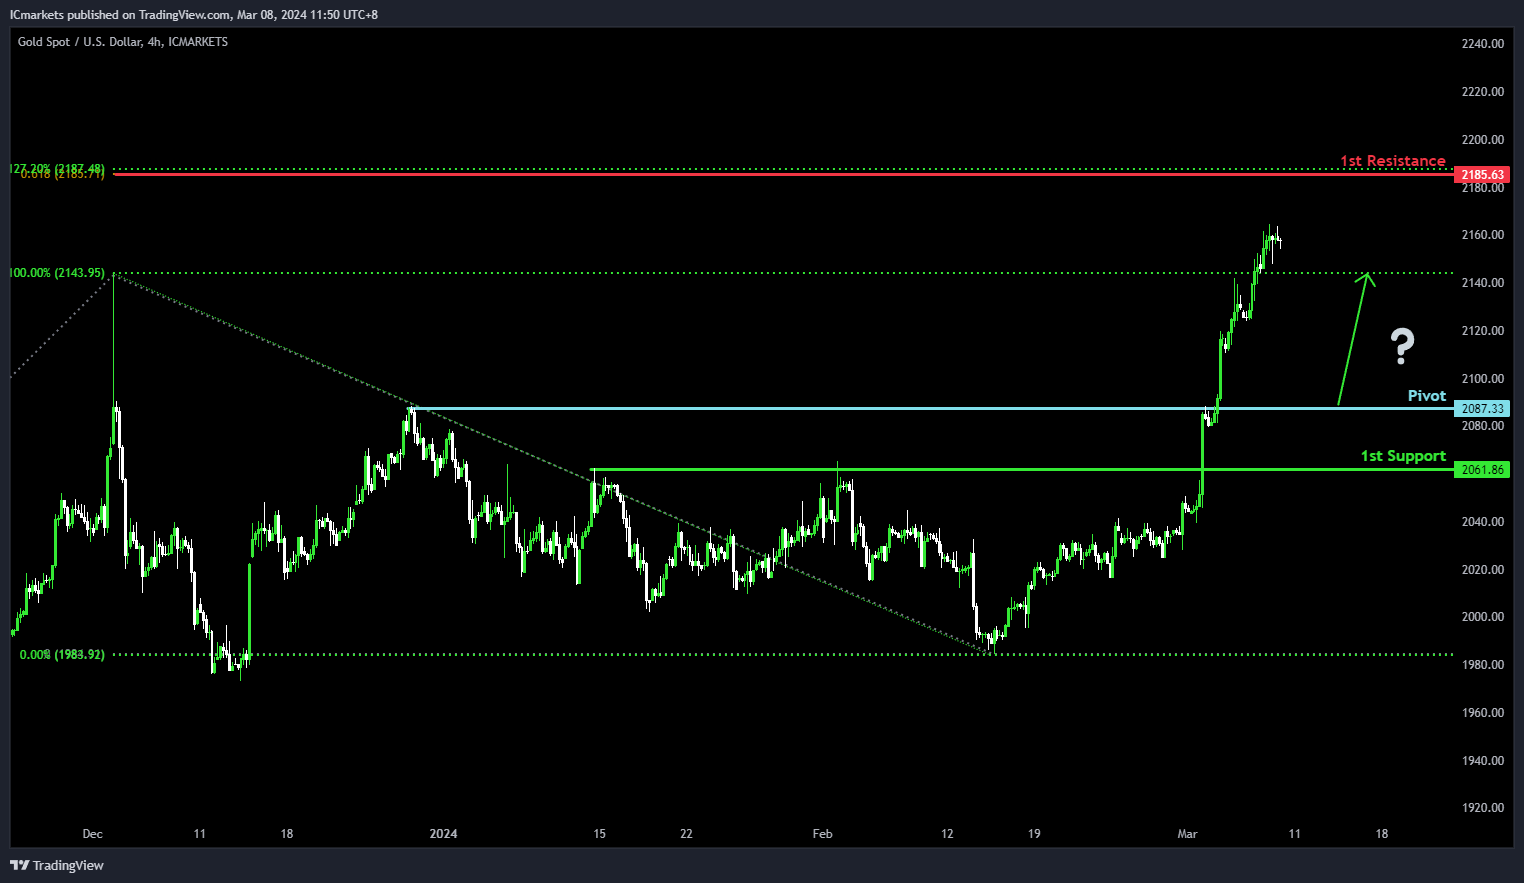
XAU/USD (GOLD):
The XAUUSD chart currently exhibits bullish momentum, suggesting a potential scenario where the price could experience a bullish rebound upon reaching the pivot level and subsequently advance towards the 1st resistance.
The pivot point at 2087.33 is identified as a significant level of pullback support, indicating its potential role as a level where buyers may intervene to support the price, potentially leading to a bullish bounce. Additionally, the 1st support level at 2061.86 is recognized as a pullback support
On the resistance side, the 1st resistance level at 2185.63 is noted as a strong resistance area. This level is reinforced by the confluence of the 127.20% Fibonacci Extension and the 61.80% Fibonacci Projection, indicating a potential barrier where selling pressure may increase, potentially limiting further upward movement in the price.
The accuracy, completeness and timeliness of the information contained on this site cannot be guaranteed. IC Markets does not warranty, guarantee or make any representations, or assume any liability regarding financial results based on the use of the information in the site.
News, views, opinions, recommendations and other information obtained from sources outside of www.icmarkets.com, used in this site are believed to be reliable, but we cannot guarantee their accuracy or completeness. All such information is subject to change at any time without notice. IC Markets assumes no responsibility for the content of any linked site.
The fact that such links may exist does not indicate approval or endorsement of any material contained on any linked site. IC Markets is not liable for any harm caused by the transmission, through accessing the services or information on this site, of a computer virus, or other computer code or programming device that might be used to access, delete, damage, disable, disrupt or otherwise impede in any manner, the operation of the site or of any user’s software, hardware, data or property.


