
EUR/USD:
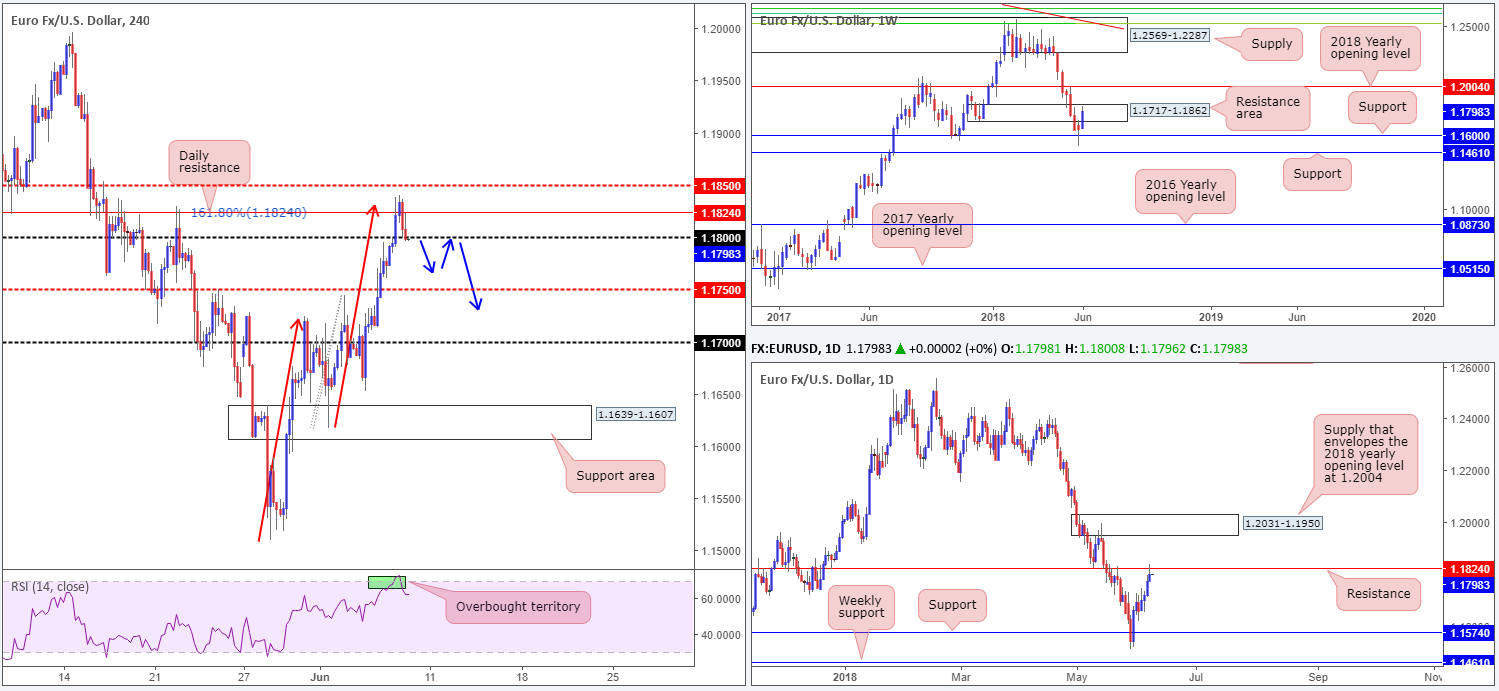
As is evident from the charts this morning the shared currency maintained its upward bias on Thursday, supported by a somewhat waning USD. In consequence to this, H4 action crunched its way through the 1.18 handle and reached highs of 1.1839 as we entered into US hours. As you can see, though, the pair met selling pressure and did manage to chalk in a mild retreat from the mentioned high, marginally closing beyond the nearby 1.18 handle into the close.
Despite the clear bullish tone present in this market, there’s multiple resistances to make allowance for:
- Over on the weekly timeframe, price is currently seen trading within the upper limit of a resistance area coming in at 1.1717-1.1862.
- In addition to this, daily movement recently checked in with a resistance level priced at 1.1824 (seen within the current weekly resistance zone).
- And let’s also bear in mind that H4 action recently closed slightly beneath 1.18 after a modest selloff from the 161.8% H4 Fib ext. point at 1.1824 (essentially the same value as the aforementioned daily resistance level).
- Further to that, we can also see a point of exhaustion on the H4 scale via a H4 ABCD completion (see red arrows) taken from the low 1.1510.
Areas of consideration:
Should the H4 candles work towards lower levels beyond 1.18 today, this could be a sellers’ market, according to the technicals. Put simply, a decisive H4 close lower followed up with a retest of 1.18 as resistance (as per blue arrows) is, in our opinion, a favorable formation to consider selling, with an initial support target placed at 1.1750, followed then by the 1.17 handle.
Today’s data points: Limited.
GBP/USD:
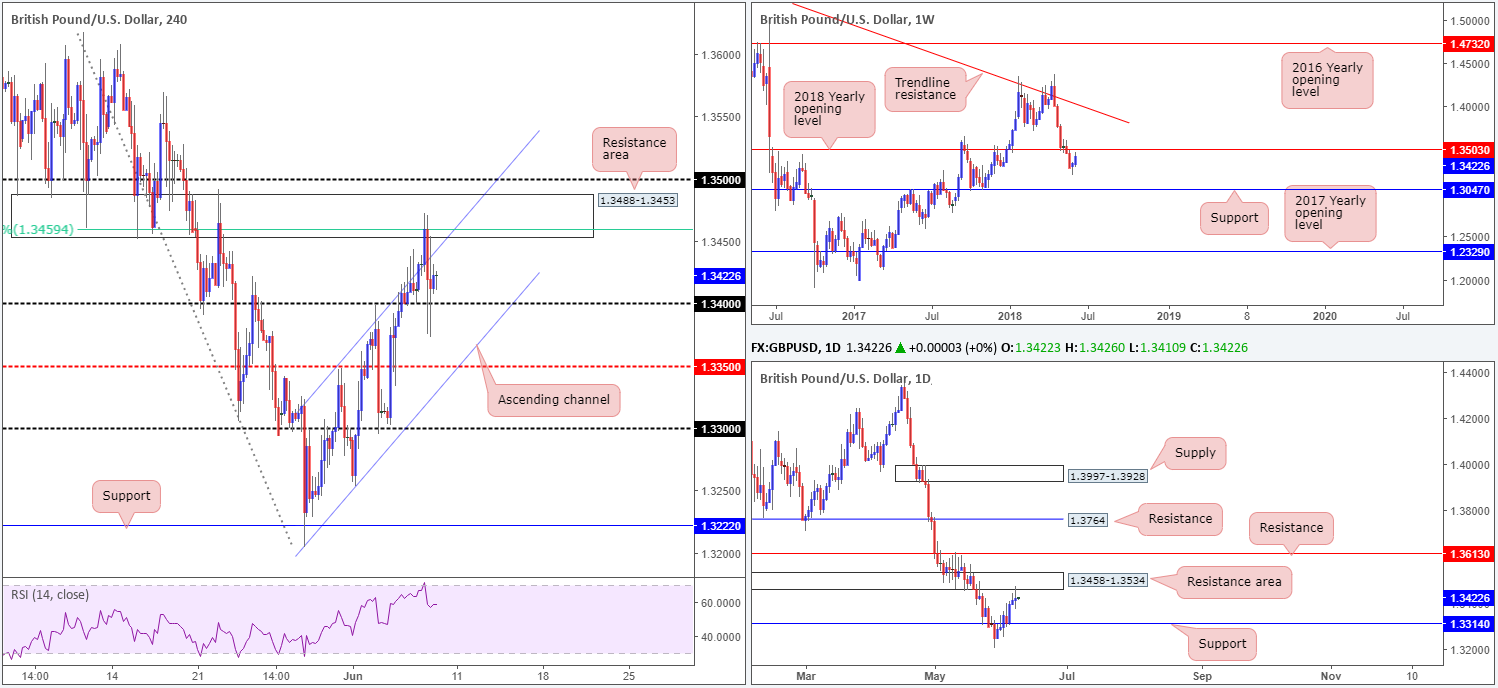
Sterling struggled to take advantage of recent USD weakness on Thursday, though doggedly remained above 1.34, perhaps reinforced by the better-than-expected home prices data. While Brexit news flow whipsawed the currency, strong selling pressure entered the market out of a H4 resistance area drawn from 1.3488-1.3453, which happens to converge with a 61.8% H4 resistance value at 1.3459 (green level). Traders may have also noticed that the H4 candles re-entered the H4 ascending channel formation taken from 1.3204/1.3347, as a result of this move.
Providing additional resistance to the market currently is a daily resistance zone formed at 1.3458-1.3534, which also intersects nicely with the 2018 yearly opening level at 1.3503 seen on the weekly timeframe.
Areas of consideration:
Well done to those who managed to grab a sell out of the aforementioned H4 resistance area yesterday as this was a noted sell zone in Thursday’s report.
Moving forward, the team has eyes on levels below the 1.34 handle for potential shorting opportunities. If H4 price can CLOSE below 1.34 and retest the underside of this number as resistance, before reaching 1.3350, intraday shorts are potentially possible to at least 1.3350/H4 channel support taken from the low 1.3204.
Today’s data points: UK consumer inflation expectations.
AUD/USD:
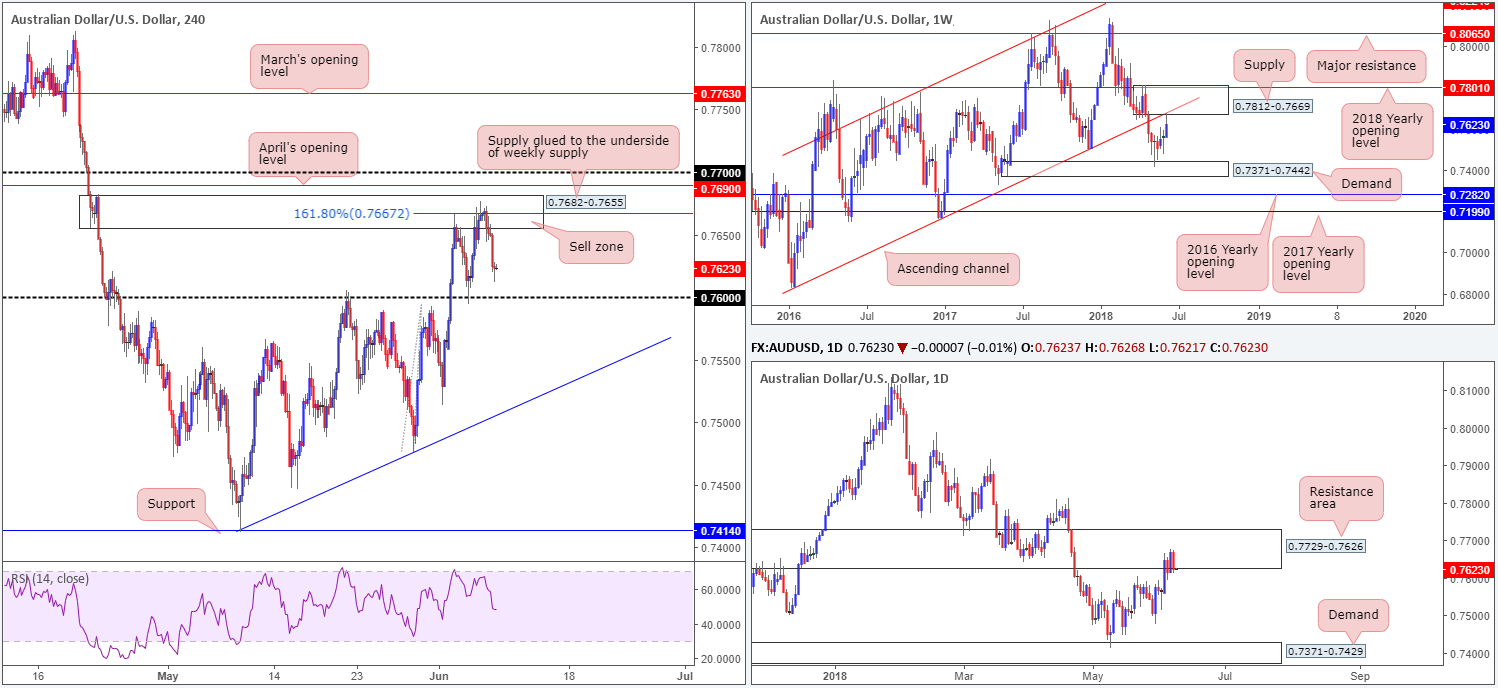
Weak Australian trade data released in the early hours of Thursday’s session evidently set the tone for the day, as the AUD/USD plunged lower. Another reason for yesterday’s selloff is likely due to where the market is currently positioned technically.
For those who read Thursday’s report, the team highlighted the H4 supply at 0.7682-0.7655 as a potential area to consider shorting. The reason behind favoring this zone came down to the following points:
- Houses a 161.8% H4 Fib ext. point at 0.7667.
- Benefits from being sited within a daily resistance area drawn from 0.7729-0.7626.
- Glued to the underside of a weekly supply at 0.7812-0.7669 and its intersecting weekly channel support-turned resistance (extended from the low 0.6827).
Well done to any of our readers who managed to jump aboard this move. Risk should already be reduced to breakeven, with the first take-profit target eyed around the 0.76ish region.
Areas of consideration:
Apart from the recent call to short, there is really not very much else to hang our hat on at this time unless, of course, H4 price closes beneath 0.76. Not only would this be fantastic news for those currently short, it will also offer a potential selling opportunity on any retest to the underside of this number, targeting 1.1750/H4 trendline support etched from the low 0.7412.
Today’s data points: China trade balance.
USD/JPY:
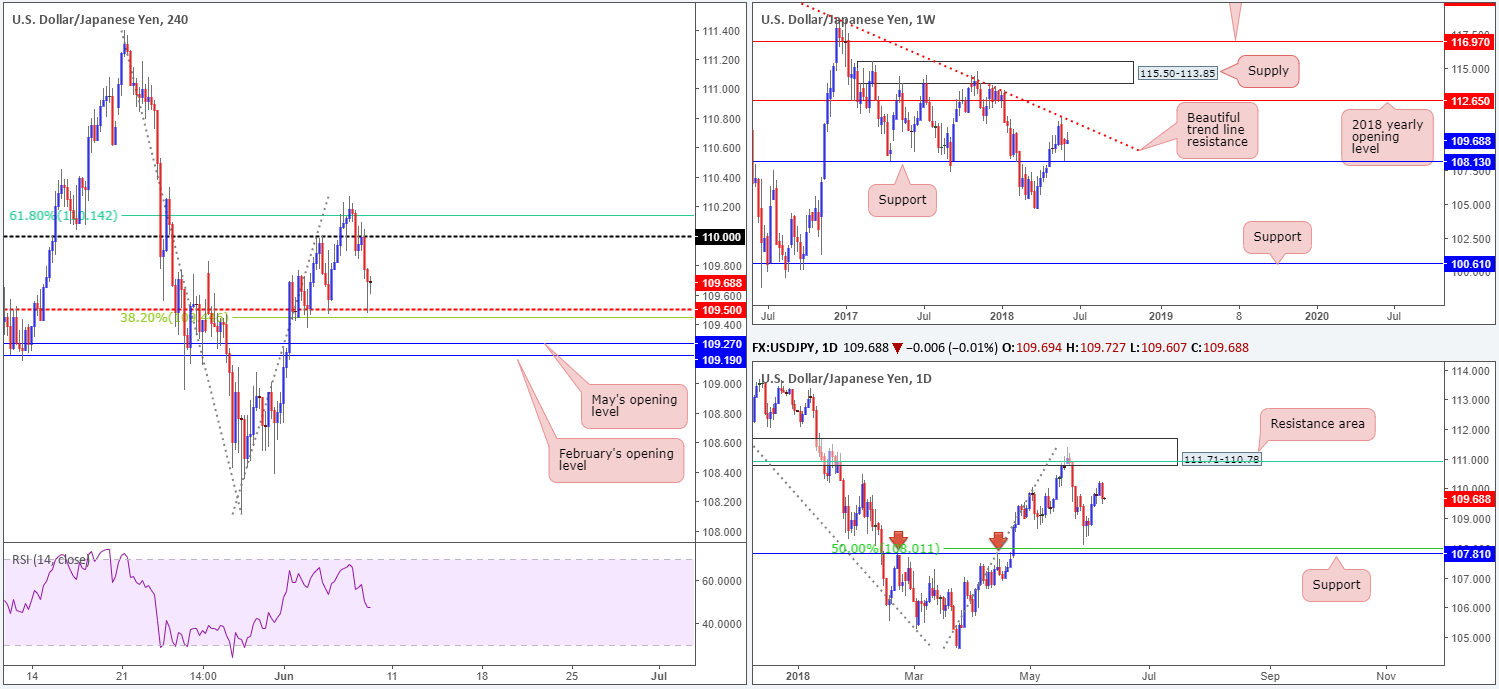
After topping at highs of 110.26, a dash above the 61.8% H4 Fib resistance value at 110.14, the USD/JPY took to lower levels in recent trade. A bout of risk contributed to the downside, brought on by a wave of selling in EMFX, consequently forcing H4 price to break below 110. A bounce, however, was seen to the upside from the H4 mid-level support 109.50 in late trade amid headlines from Japan PM Abe, who pledged the Japanese would invest more in the US.
Both weekly and daily structure offer similar interpretations today. Weekly flow remains sandwiched between a long-term weekly trend line resistance extended from the high 123.67 and a weekly support registered at 108.13. Similarly, daily movement is seen hovering amid a daily resistance zone pictured at 111.71-110.78 that converges with a 61.8% daily Fib resistance value at 110.91 (green line), and a daily support line seen at 107.81, which also happens to untie closely with a 50.0% support value at 108.01.
Areas of consideration:
Seeing as the pair lacks higher-timeframe structure at this time, focus remains on intraday levels on the H4 scale.
Battle lines to be aware of in today’s sessions are as follows:
- The mid-level support at 109.50.
- 38.2% Fib support value at 109.45.
- 68.1% Fib resistance value at 110.14.
- The 110 handle.
- February’s opening level at 109.19.
- May’s opening level at 109.27.
Today’s data points: Limited.
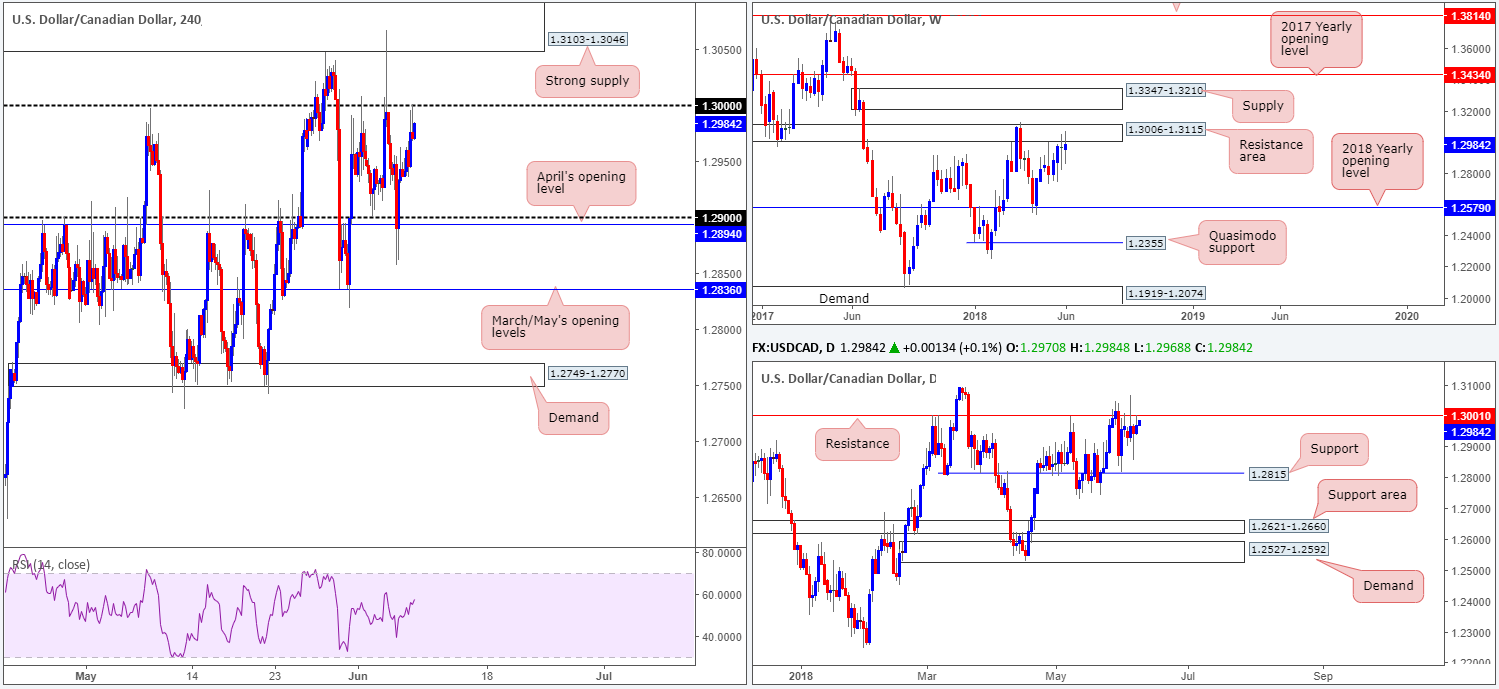
USD/CAD:
In recent trade, H4 price extended its bounce from lows made beneath 1.29 at 1.2854, bringing the pair into contact with the key figure 1.30, which, as you can see, is positioned just south of a strong H4 supply zone at 1.3103-1.3046.
Despite the Bank of Canada releasing its financial system review, along with comments from BoC Gov. Poloz on Thursday, USD/CAD movement struggled to find direction beneath 1.30 (see H1 for a clearer picture). In terms of higher-timeframe structure, nevertheless, weekly flow continues to present an indecisive tone around the underside of a resistance area seen at 1.3006-1.3115. In conjunction with weekly structure, the daily candles are also seen interacting with resistance coming in at 1.3001.
Areas of consideration:
Having noted that both weekly and daily price show potential to selloff, 1.30 is an area of interest this morning, targeting 1.29 as the initial take-profit target. However, on taking trades off 1.30 traders need to remain cognizant of the possibility that price could fake above 1.30 to test H4 supply seen at 1.3103-1.3046, which happens to be sited within the walls of the noted weekly resistance area.
Today’s data points: Canadian job’s figures.
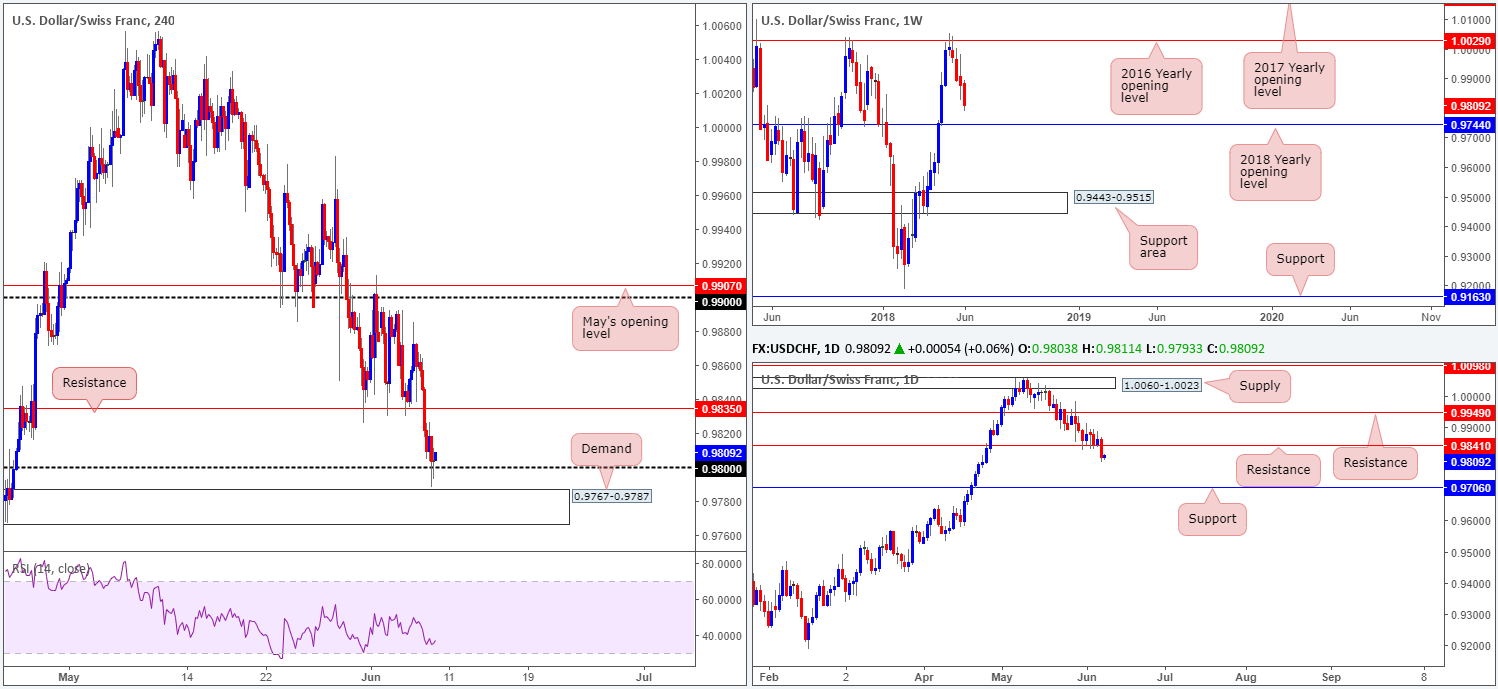
USD/CHF:
Following several attempts to pare losses off H4 support at 0.9835, USD/CHF bulls lost traction as we entered into the early hours of Europe on Thursday. As you can see, the pair violently plunged through 0.9835 and concluded the segment whipsawing through the 0.98 handle, which happens to be positioned just north of a H4 demand area coming in at 0.9767-0.9787.
A move lower, according to weekly structure, was to be expected. After shaking hands with the 2016 yearly opening level seen at 1.0029, there’s really not very much support seen in view until the unit reaches the 2018 yearly opening level marked at 0.9744. In terms of daily structure, however, support at 0.9841 was engulfed in recent trade, potentially setting the stage for a test of daily support drawn from 0.9706.
Areas of consideration:
Through the lens of a simple technical trader, entering long from 0.98 is not a move we would label high probability. Why? Well, upside is currently swamped by a number of competing themes: weekly and daily directional flow, as well as nearby H4 support-turned resistance at 0.9835.
Under usual circumstances, we’d recommend waiting for H4 price to engulf the current H4 demand zone for shorts. However, in this case you’ll have less than 25 pips of room to play with given the 2018 yearly opening level is located at 0.9744!
On account of the above, opting to remain on the sidelines may be the better path to take at this time.
Today’s data points: Limited.
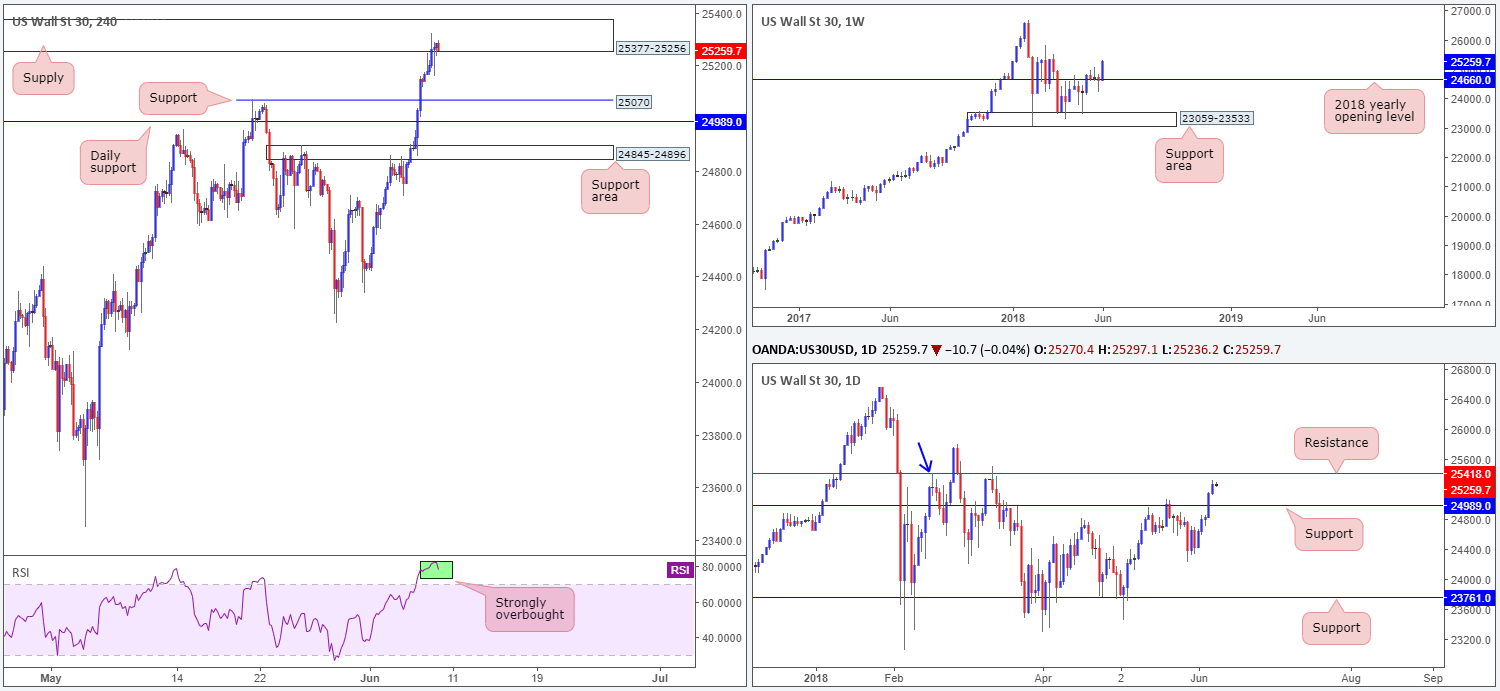
Dow Jones Industrial Average:
US equities ended the day higher on Thursday, recording its fifth consecutive daily gain. This has, as shown on the chart, brought the H4 candles up to supply noted at 25377-25256, which happens to be accompanied by a strong overbought reading on the H4 RSI indicator.
The recent advance, as can be clearly seen on the weekly timeframe, has placed the DJIA firmly above its 2018 yearly opening level at 24660. What’s also accomplished is the positioning of daily price within striking distance of a daily resistance plotted at 25418. Do note that this level also represents a Quasimodo resistance taken from the high 25415 (blue arrow).
Areas of consideration:
Upside momentum on the H4 timeframe has certainly diminished in recent movement. This is likely due to possible selling interest emanating from the current H4 supply. Should you consider a sell from this zone, do remain cognizant of stop-loss placement since daily resistance is sited just above it at 25418. This has ‘fakeout’ written all over it.
The next support target (potential take-profit zone) to be aware of on the H4 scale falls in at 25070, followed closely by daily support at 24989.
Today’s data points: Limited.
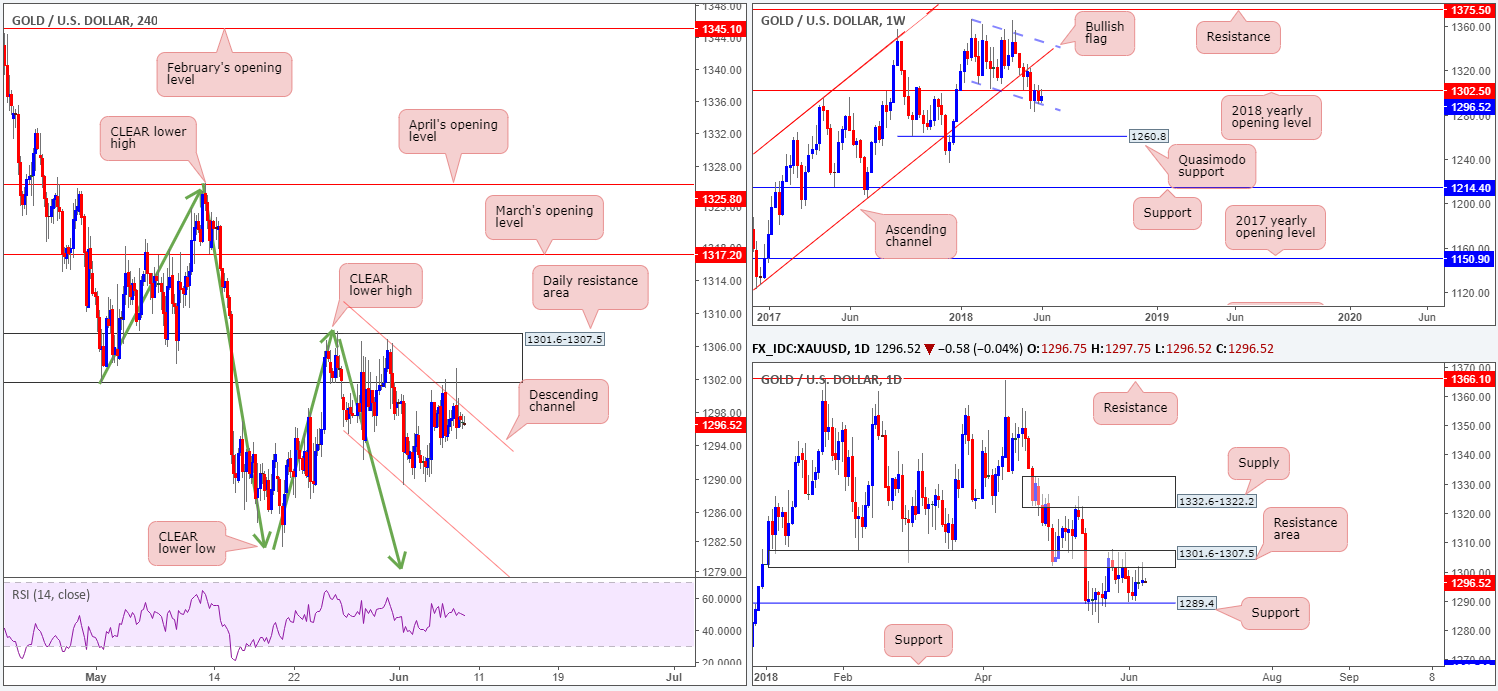
XAU/USD (Gold)
On the whole, gold prices are effectively unchanged this morning. And as such, much of the following report will echo thoughts put forward in yesterday’s analysis…
H4 candle action continues to surf the H4 channel resistance extended from the high 1306.8, which closely intersects with a daily resistance area coming in at 1301.6-1307.5. From this point, the team remains supportive of a lower low taking place on the H4 scale (a break of the swing low 1285.8). This expectation will only be discounted on a H4 close above the clear lower high seen on the H4 timeframe at 1307.7.
Casting our lines a little higher, we are able to see that daily movement remains sandwiched between the aforementioned daily resistance area and a daily support level drawn in from 1289.4. In similar fashion, weekly movement is also seen tightly confined between the 2018 yearly opening level at 1302.5 and the lower edge of a weekly bullish flag formation taken from the low 1346.1. Anyone get the feeling that this market is about ready to burst?
Areas of consideration:
As the expectation is for a lower low to form on the H4 timeframe, we feel shorts at current price is still a consideration, with stop-loss orders placed above the clear lower high on the H4 timeframe at 1307.7.
Reducing risk to breakeven and taking partial profits off the table once, or indeed if, H4 flow tests lows of 1281.8 is recommended.
The use of the site is agreement that the site is for informational and educational purposes only and does not constitute advice in any form in the furtherance of any trade or trading decisions.
The accuracy, completeness and timeliness of the information contained on this site cannot be guaranteed. IC Markets does not warranty, guarantee or make any representations, or assume any liability with regard to financial results based on the use of the information in the site.
News, views, opinions, recommendations and other information obtained from sources outside of www.icmarkets.com.au, used in this site are believed to be reliable, but we cannot guarantee their accuracy or completeness. All such information is subject to change at any time without notice. IC Markets assumes no responsibility for the content of any linked site. The fact that such links may exist does not indicate approval or endorsement of any material contained on any linked site.
IC Markets is not liable for any harm caused by the transmission, through accessing the services or information on this site, of a computer virus, or other computer code or programming device that might be used to access, delete, damage, disable, disrupt or otherwise impede in any manner, the operation of the site or of any user’s software, hardware, data or property.


