
A note on lower timeframe confirming price action…
Waiting for lower timeframe confirmation is our main tool to confirm strength within higher timeframe zones, and has really been the key to our trading success. It takes a little time to understand the subtle nuances, however, as each trade is never the same, but once you master the rhythm so to speak, you will be saved from countless unnecessary losing trades. The following is a list of what we look for:
- A break/retest of supply or demand dependent on which way you’re trading.
- A trendline break/retest.
- Buying/selling tails/wicks – essentially we look for a cluster of very obvious spikes off of lower timeframe support and resistance levels within the higher timeframe zone.
- Candlestick patterns. We tend to only stick with pin bars and engulfing bars as these have proven to be the most effective.
We search for lower timeframe confirmation between the M15 the H1 timeframes, since most of our higher-timeframe areas begin with the H4. Stops are usually placed 5-10 pips beyond confirming structures.
EUR/USD:
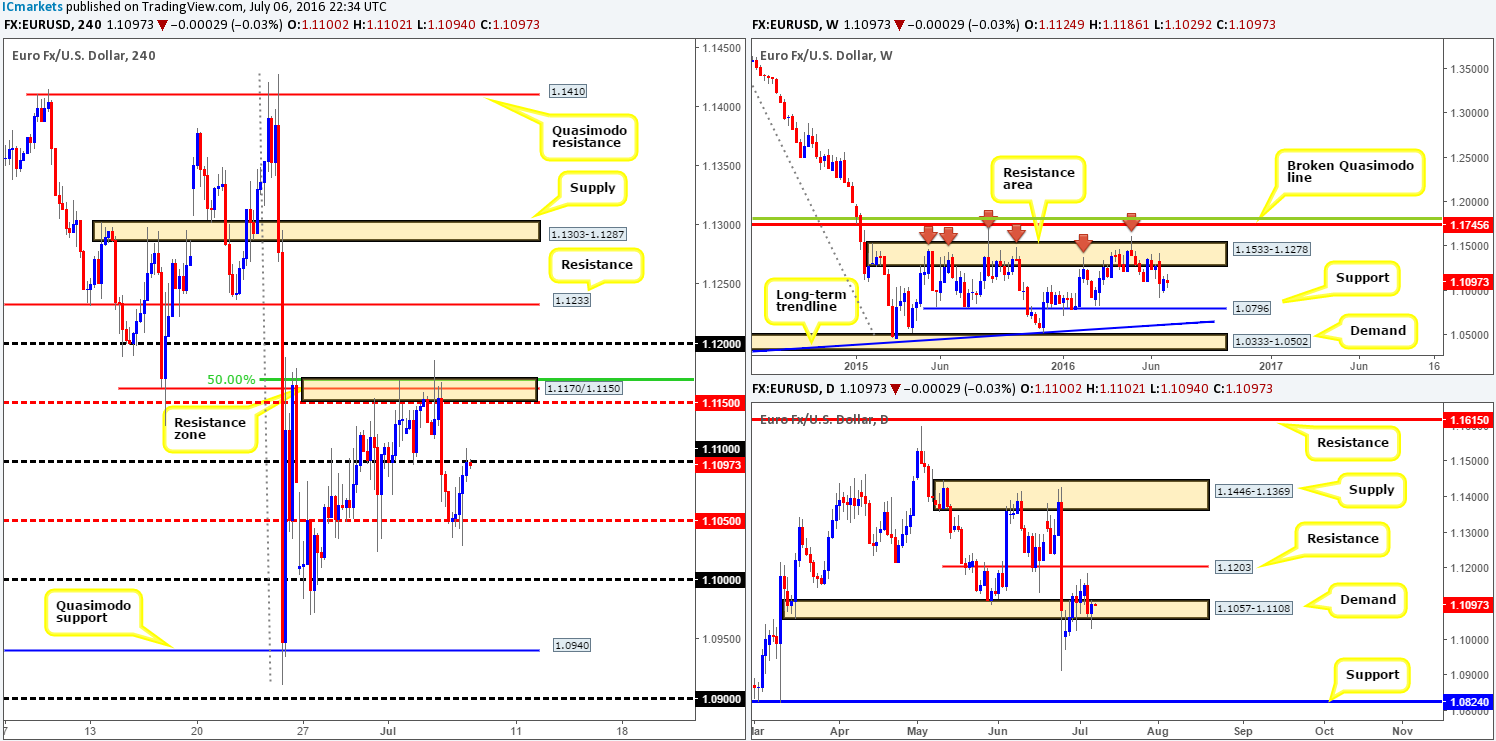
The EUR/USD settled just ahead of the H4 mid-way point 1.1050 yesterday, following a modest sell-off from the 1.11 handle. Given the light docket ahead of today’s mighty non-farm payrolls release, it is possible that we may see price remain fixed between the above said round numbers before the big number is released. With yesterday’s US ADP employment print coming in hotter than expected (a general precursor to NFP), there is a chance we may also see a positive employment report today.
Technically however, the single currency is now seen flirting with the lower edge of daily demand at 1.1057-1.1108. Should this barrier give way (other than the referendum low 1.0911) there is little support seen stopping price from reaching daily support chalked in at 1.0824. Looking up to the weekly chart, the EUR appears to be floating mid-range between a long-term weekly resistance area coming in at 1.1533-1.1278, and a long-term weekly support line seen at 1.0796. On account of this structure price could effectively move either way.
Our suggestions: In light of the expected volatility today, we’ll be watching the following barriers for possible action:
- The 1.1000 handle. This number is a key figure and will likely be of interest to the market. It has, as far as we see, little higher timeframe convergence but is still worth keeping an eye on for a bounce long today.
- The H4 Quasimodo support at 1.0940. This barrier also has little higher timeframe connection but did hold prices higher during the ‘Brexit’ fallout, giving it a relatively good reputation as solid support.
- We like the 1.1200 handle for shorts seeing as how it blends nicely with daily resistance at 1.1203, and is bolstered by a relatively solid H4 resistance above at 1.1233.
- H4 supply at 1.1303-1.1287 is also interesting for sells. Not only does this area house the 1.1300 handle, but it is glued to the underside of the weekly resistance area mentioned above at 1.1533-1.1278.
Levels to watch/live orders:
- Buys: 1.1000 region [Tentative – confirmation required] (Stop loss: dependent on where one confirms this area). 1.0940 region [Tentative – confirmation required] (Stop loss: dependent on where one confirms this area).
- Sells: 1.1200 region [Tentative – confirmation required] (Stop loss: dependent on where one confirms this area). 1.1303-1.1287 [Tentative – confirmation required] (Stop loss: dependent on where one confirms this area).
GBP/USD:
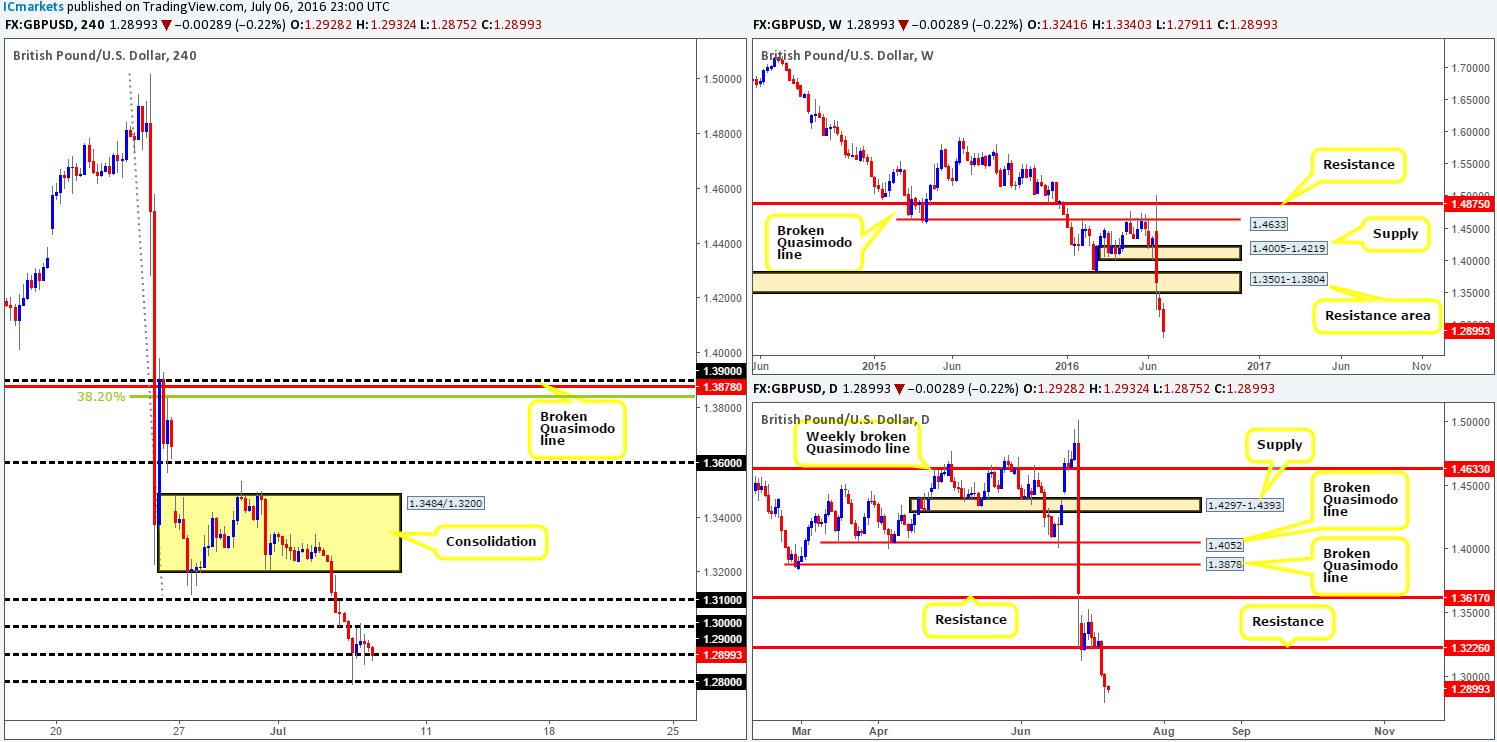
As can be seen from the H4 chart price ended the day slightly lower yesterday, consequently forcing cable to engage with the 1.29 handle for the third time this week. In addition to this, we can see that daily action chalked up a relatively strong-looking selling wick which could potentially indicate further selling is on the horizon.
In our last few reports we mentioned that out team remains relatively blind on the higher timeframes, as price continues to trade around 31-year lows with very little local higher timeframe structures present. Looking at historical data right back to 1986 we can see some demand around the 1.20 mark, but as you can see, there’s a lot of ground to cover before this barrier is brought into view.
Our suggestions: Today’s non-farm payrolls report will undoubtedly cause some ripples in this market. This – coupled with both the UK’s political turmoil and the technical picture giving us very little to play with at the moment, we are going to trade flat today and reassess next week.
Levels to watch/live orders:
- Buys: Flat (Stop loss: N/A).
- Sells: Flat (Stop loss: N/A).
AUD/USD:
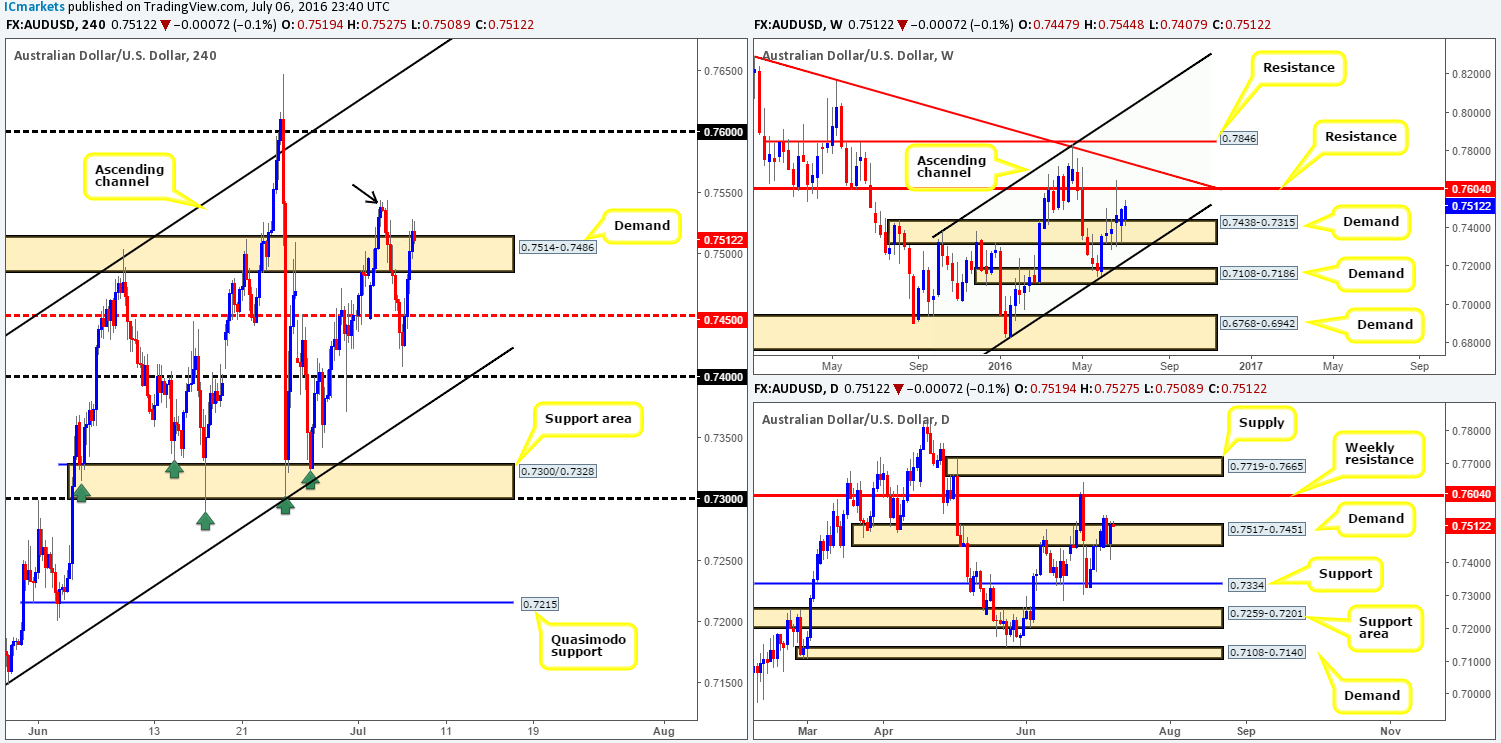
Starting from the top this morning, the Aussie currency continues to remain afloat above the weekly demand base drawn from 0.7438-0.7315. The next upside target from this area is seen at 0.7604 – a battle-tested weekly resistance barrier. Sliding down into the daily chart, however, one can see that price has spent the week fluctuating around daily demand painted at 0.7517-0.7451. Just like the weekly timeframe, the next upside target from this daily zone is also the aforementioned weekly resistance line, whilst to the downside, daily support at 0.7334 would likely be the next target to reach.
Over on the H4 chart, we can see that the pair dove lower from H4 supply at 0.7544-0.7534, consequently closing the day around 0.7477. Right now, the only area that tickles our fancy is the 0.74 handle. It merges beautifully with a H4 Fib support line at 0.7407 and also a H4 channel support line extended from the low 0.7148 (green circle). This area also sits within the above said weekly demand and just below the current daily demand.
Our suggestions: We would, given the confluence seen around 0.74, usually look to enter at market from here. However, given that volatility is likely to increase later on today as the NFP takes the stage, we would only consider this buy area valid with the backing of a lower timeframe buy signal. This could be in the form of an engulf through supply followed by a retest, a trendline break/retest or simply a collection of well-define buying tails around the 0.74 region. Stops are usually placed 5-10 pips beyond confirming structures.
Levels to watch/live orders:
- Buys: 0.74 region [Tentative – confirmation required] (Stop loss: dependent on where one confirms this area).
- Sells: Flat (Stop loss: N/A).
USD/JPY:
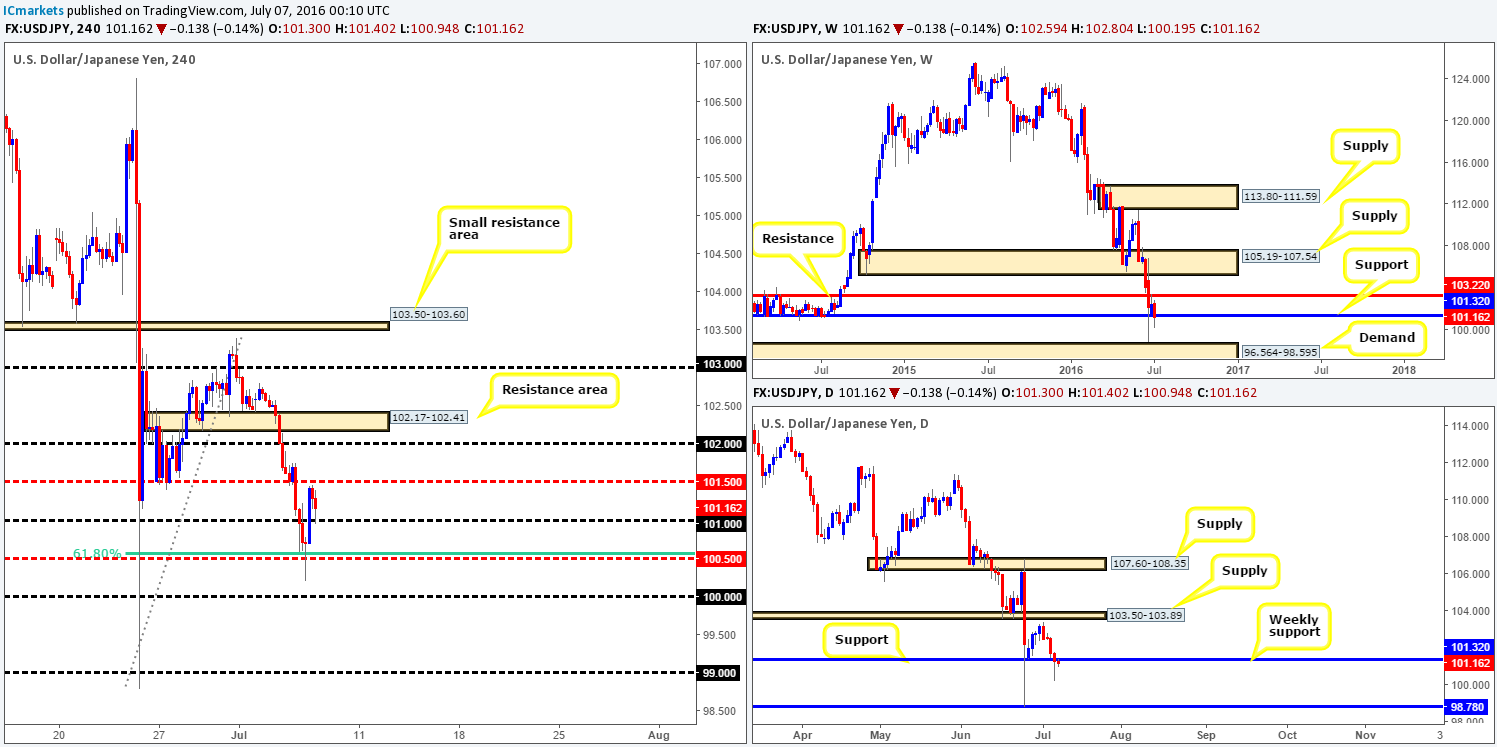
Other than the 101 handle giving way yesterday and price closing just ahead of a H4mid-way support at 100.50, very little else was seen. Given the fact that the non-farm payrolls report is lurking just around the corner, here is what our team has jotted down for today’s upcoming trade:
- A strong NFP number would likely see the US dollar appreciate and this could potentially save the current weekly support line at 101.32 from destruction. Regarding buying this market we see two potential levels. The first being the 100.50 boundary since it already proved itself during yesterday’s sessions and fuses nicely with a H4 61.8% Fib support at 100.56. The second would only come into view following a break above and the 101 handle which could shortly after be retested as support to buy. Both levels, at least for us, require lower timeframe confirmation as fakeouts are highly possible during big news events (see the top of this report for lower timeframe entry techniques).
- A weak NFP number, however, could see investors/traders rush in to buy the safe-haven Yen, thus pushing the US dollar lower. Technically, the daily chart supports lower prices down to 98.78 – a daily support, whereas, as we have already mentioned, weekly support at 101.32 is still seen in the picture. That being the case, our approach to this market, should the numbers come in negative, is to wait and see if price closes below the key figure 100.00 and retests the underside as resistance. Followed by a lower timeframe sell signal here (see the top of this report for lower timeframe entry techniques), this would, as far as we can see, be a beautiful short trade which could run all the way down to the 0.99 handle (sits just above the daily support line at 98.78).
Levels to watch/live orders:
- Buys: 100.50 region [Tentative – confirmation required] (Stop loss: dependent on where one confirms this area). Watch for price to consume the 101 handle and look to trade any retest seen thereafter (lower timeframe confirmation required).
- Sells: Watch for price to consume the 100.00 handle and look to trade any retest seen thereafter (lower timeframe confirmation required).
USD/CAD:
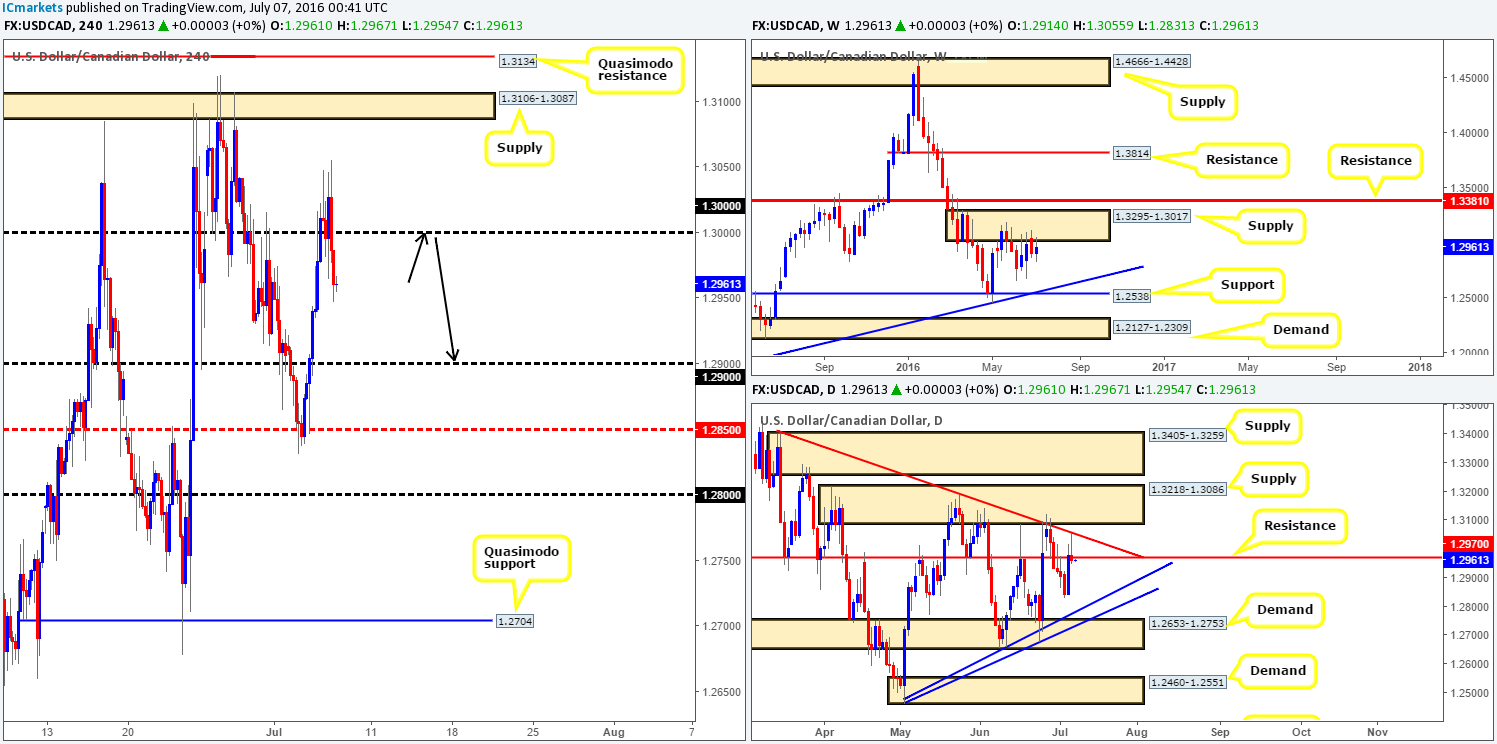
Following the release of crude oil inventory data the oil market took a hit late in yesterday’s sessions, thereby pushing the price of the USD/CAD over 100 pips higher from the 1.29 handle back up to the key figure 1.30. This has, as you can see by looking at the daily chart, placed the loonie in a relatively tight spot. The daily trendline resistance taken from the high 1.3401 is seen just overhead, whilst daily support is lodged just below at 1.2970. Over on the weekly chart, however, this unit remains kissing the underside of weekly supply drawn from 1.3295-1.3017, which could eventually force the candles lower to test the weekly trendline support extended from the high 1.1278.
Technically, the above picture suggests a sell-off may be seen from 1.30 today, potentially pushing this market back down to 1.29. Nevertheless, with the almighty NFP report set to rear its head later on today, technicals will likely take a back seat.
Our suggestions: For those still interested in shorting from 1.30, we would strongly advise waiting for a H4 close beyond the current daily support at 1.2970 followed by a confirmed retest at this line. In spite of the weekly picture suggesting selling might be the best path to take, one can never be sure if there are active buyers waiting at this daily support level.
Levels to watch/live orders:
- Buys: Flat (Stop loss: N/A).
- Sells: 1.30 region [Tentative – confirmation required] (Stop loss: dependent on where one confirms this area).
USD/CHF:
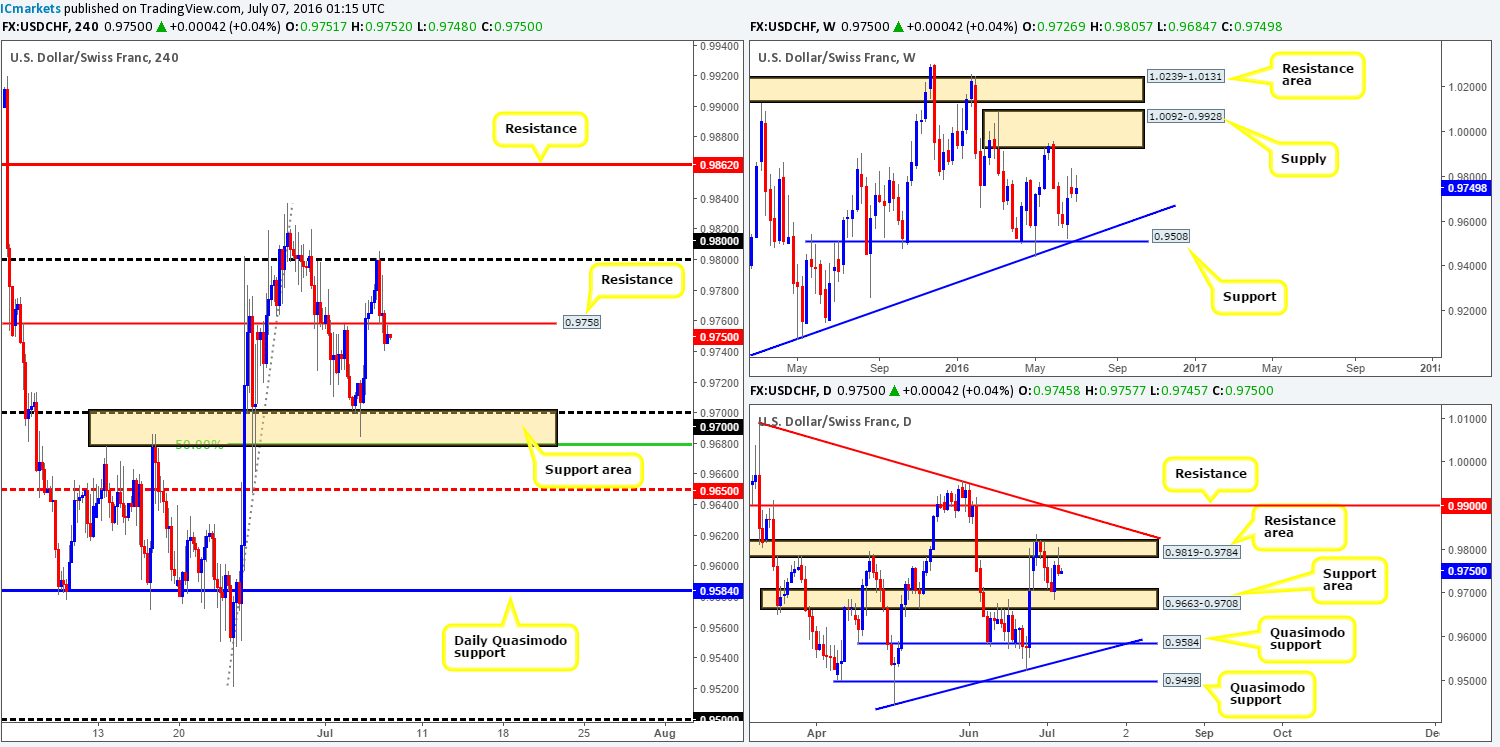
H4 resistance at 0.9758, as can be seen from the chart, failed to hold the Swissy lower going into the European session yesterday. Consequent to this, not too long after price retested this boundary as support and managed to reach highs of 0.9792 by the day’s end. Just ahead of current price is the 0.98 handle, which has done an absolutely sterling job in holding this market lower over the past few weeks. Given that this number is also bolstered by a daily resistance area at 0.9819-0.9784, it should not really come as much of a surprise.
Since there is room for this market to move lower on both the weekly (down to the weekly trendline support extended from the low 0.8703) and daily (down to the daily support area at 0.9663-0.9708) charts right now, our team favors shorts for the time being!
Our suggestions: Watch for lower timeframe sell trades around the 0.98 barrier today. The reason for not entering here with a pending order is simply because weekly action shows no concrete resistance at current prices, psychological boundaries such as these are prone to fakeouts and lastly let’s not forget that it is NFP day today where technicals usually don’t do too well in that environment.
Levels to watch/live orders:
- Buys: Flat (Stop loss: N/A).
- Sells: 0.98 region [Tentative – confirmation required] (Stop loss: dependent on where one confirms this area).
DOW 30:
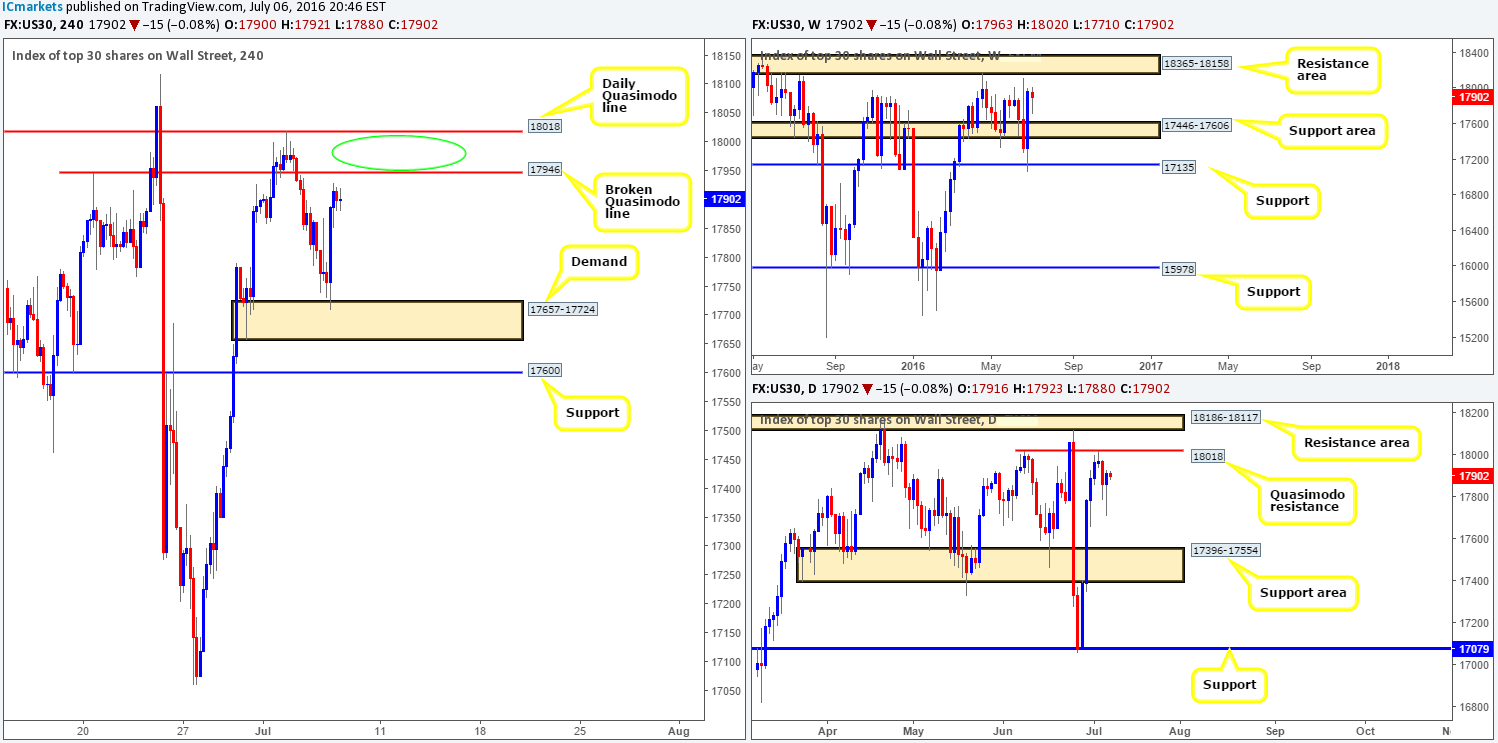
For those who read our previous report on the DOW (see link below) you may recall us mentioning that our team was interested in selling from in between the daily Quasimodo resistance line penciled in at 18018 and a H4 broken Quasimodo line at 17946 (green circle). As you can see from the chart, price did indeed sell-off quite nicely from here, but unfortunately we missed this move since we were unable to pin down a lower timeframe entry. Well done to any of our readers who did though!
Going forward, things are a little difficult. Not only has one got to contend with the prospect of violent moves being seen at NFP later on, but now we feel offers are likely drained between 18018/17946. Adding to this, the weekly path looks clear up to a weekly resistance area at 18365-18158.
Our suggestions: Despite the weekly timeframe showing room to advance and the possibility of weakened sellers around 18018/17946, entering long at current prices might not be the best path to take. The safest, and in our opinion, most logical route to look for trades today is on a break above the aforementioned daily Quasimodo resistance line. We can then, following a confirmed retest of this daily line as support on the H4 (see the top of this report for confirmation techniques), look to target the daily resistance area at 18186-18117, followed by the underside of the weekly resistance zone coming in at 18158.
http://www.icmarkets.com/blog/thursday-7th-july-daily-technical-outlook-and-review/
Levels to watch/live orders:
- Buys: Watch for price to consume the daily Quasimodo resistance level at 18018 and look to trade any retest seen thereafter (lower timeframe confirmation required).
- Sells: Flat (Stop loss: N/A).
Gold:
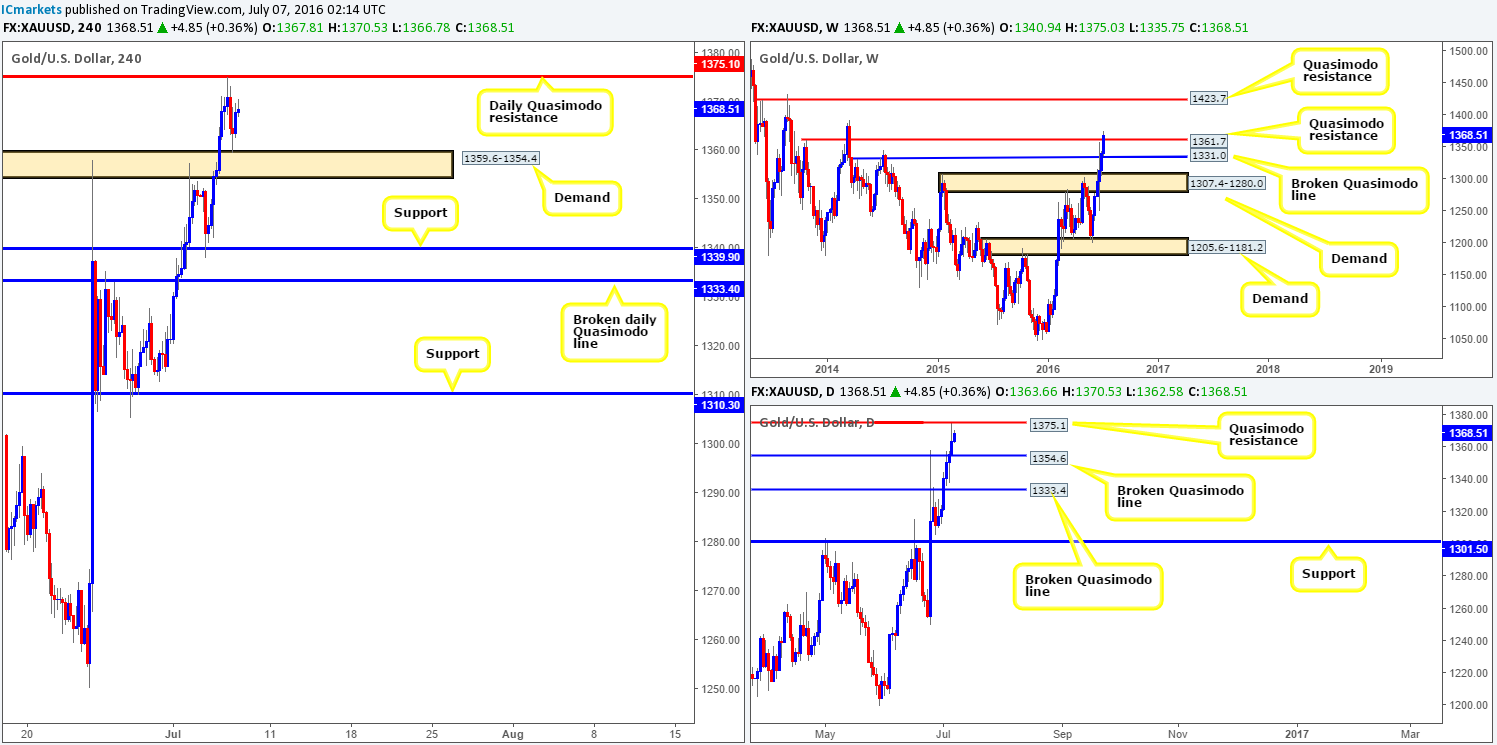
Recent action shows that the yellow metal extended its bounce lower from the daily Quasimodo resistance line at 1375.1, forcing price deep into the jaws of a H4 demand base at 1359.6-1354.4. Not only is price now trading within a H4 zone, it is also crossing swords with a broken daily Quasimodo line at 1354.6! As bullish as these two connected areas may appear, traders need to be mindful to the fact that weekly price shows room to drive down to 1331.0 – a broken weekly Quasimodo line.
This is definitely not to say that buying from the current H4 and daily barriers is not legit, as we believe it is. Just one would need to be extra careful here and adhere to strict trade management rules set out prior to pulling the trigger!
Our suggestions: Keep an eye on the lower timeframe action around the current H4 demand base for potential buying opportunities. We would not advise entering at market here since, as we just explained above, weekly price has the potential to continue driving much lower yet.
Levels to watch/live orders:
- Buys: 1359.6-1354.4 [Tentative – confirmation required] (Stop loss: dependent on where one confirms this area).
- Sells: Flat (Stop loss: N/A).


