
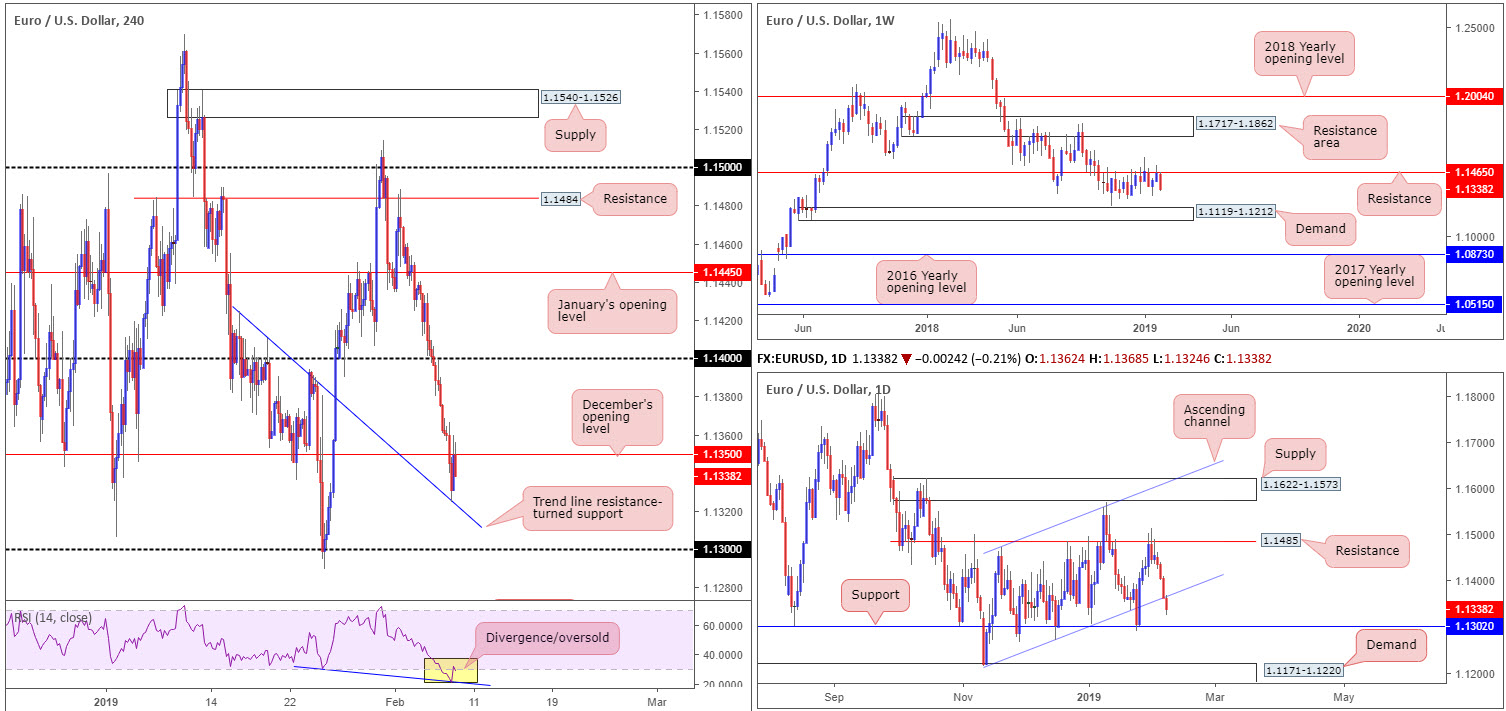
EUR/USD:
The single currency relinquished further ground to its US counterpart Thursday, down approximately 1.00% on the week thus far. Despite this, the H4 candles established a floor of support amid London’s morning session off lows at 1.1324: a trend line resistance-turned support (extended from the high 1.1424). This wiped away a slice of the day’s losses and hauled the pair back up to December’s opening level at 1.1350, which, as you can see, is holding firm as we write. It might also be worth underlining the RSI indicator is currently displaying an oversold/divergence reading.
As you might expect on a timeframe as large as the weekly, little has changed in terms of structure. Since late October of 2018, the pair has clung to the underside of resistance coming in at 1.1465, with the next support target in view at demand drawn from 1.1119-1.1212. Daily movement, on the other hand, dethroned ascending channel support (taken from the low 1.1215) and is poised to shake hands with nearby support plotted at 1.1302. Beyond here, the team’s crosshairs rest at demand drawn from 1.1171-1.1220 (glued to the top edge of the current weekly demand area).
Areas of consideration:
Having observed both weekly and daily flow eyeing lower levels, a sell from the underside of December’s opening level at 1.1350 could be an option today. In the event the current H4 candle closes as is (a bearish structure on its lows), a short at the close is certainly something to consider with stop-loss orders fixed a couple of pips above its respective wick. Regarding downside targets on the H4 timeframe, the research team has eyes on the 1.13 handle, which boasts additional support out of the daily timeframe at support from 1.1302. Reducing risk to breakeven upon striking 1.13 and liquidating 70% of the position is an idea, with the remaining portion of the position left in play for a possible run towards daily demand mentioned above at 1.1171-1.1220.
Today’s data points: Limited.
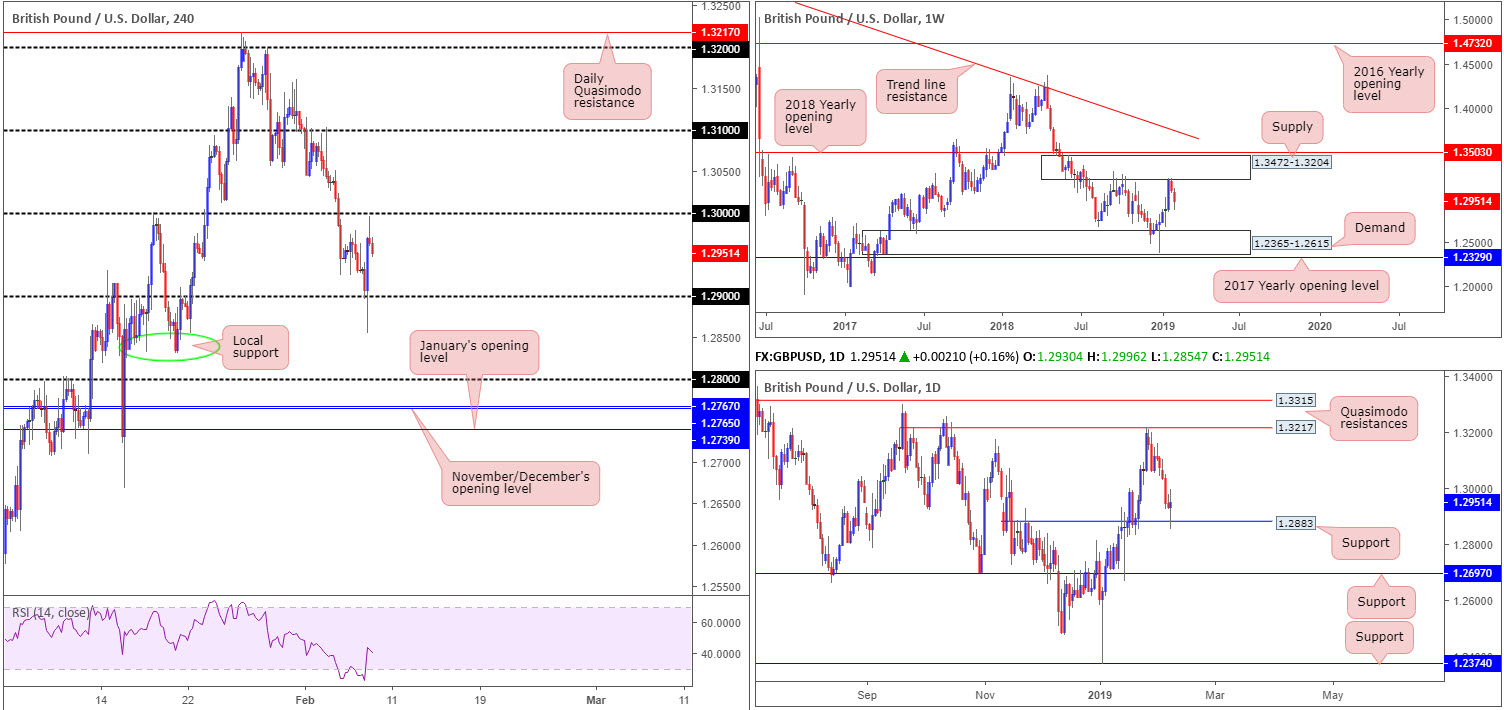
GBP/USD:
Employing a top-down approach this morning, weekly structure suggests vulnerability in this market. Having seen weekly price extend its downside presence from supply at 1.3472-1.3204 (with room seen to press as far south as demand coming in at 1.2365-1.2615), down virtually 1.00% on the week thus far, sellers on this scale appear firmly in the driving seat at the moment. The next area of concern on this scale is visible around demand drawn from 1.2365-1.2615.
Contrary to the outlook on the weekly timeframe, daily flow witnessed support at 1.2883 elbow its way into the spotlight (this was a Quasimodo resistance-turned support). A violation of this level, nonetheless, opens the gates to further selling on the daily timeframe in the direction of support at 1.2697.
The story on the H4 timeframe reveals price established support off 1.29, despite an aggressive whipsaw to session lows at 1.2854 mid-ways through London Thursday, post BoE announcement. As expected, the central bank opted to stand pat on rates at 0.75% with a 9-0 vote in doing so. Shortly after, BoE Governor Carney struck a more balanced and non-committal tone in the press conference, providing much-needed impetus and pulling cable all the way back up to highs just south of key figure 1.30.
Areas of consideration:
Observing H4 price form a bearish pin-bar formation just south of the key figure 1.30, sellers appear willing to explore lower ground. This, as we already know, falls in line with our weekly timeframe assessment, though against daily structure that currently emphasises support. With that being the case, the pendulum, according to our technical studies, looks to be swinging toward more of a decline today, targeting 1.29/a retest of daily support at 1.2883.
Traders who sold the H4 bearish pin-bar pattern are sitting nicely in the green now. Those who missed the boat, however, may want to consider drilling down to the lower timeframes and searching for a support-turned resistance play to trade.
Today’s data points: Limited.
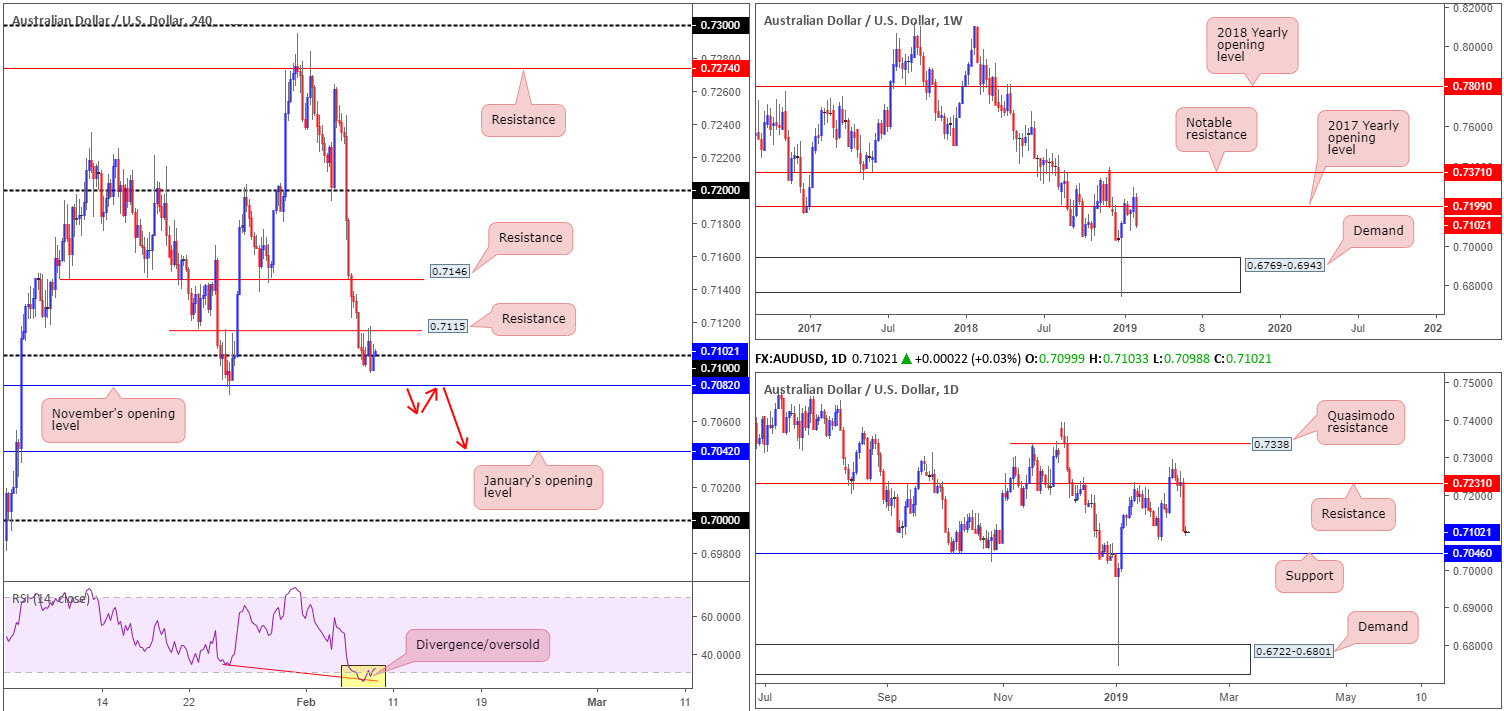
AUD/USD:
Down 0.07% Thursday, AUD/USD prices are little changed this morning following Wednesday’s precipitous decline on the back of central bank movement.
H4 resistance at 0.7115, as expected, proved a troublesome barrier to overcome for buyers fading 0.71. Directly beneath this round number, traders may want to pencil in potential support emerging from November’s opening level at 0.7082. Note this level should not be overlooked, having seen it cap downside in late January. Beyond here, we’re left with January’s opening level at 0.7042. It might also be worth mentioning the H4 RSI indicator is currently offering a divergence/oversold reading.
A number of technical support levels were engulfed as a result of Wednesday’s selloff, most prominent being the 2017 yearly opening level on the weekly timeframe at 0.7199. This move, assuming further downside is seen, could extend as far south as demand plotted at 0.6769-0.6943. Daily flow, as you can probably see, is hovering nearby the 0.7076 January 25 low that’s followed closely by notable support emerging from 0.7046.
Areas of consideration:
Although this may appear a sellers’ market right now from a higher-timeframe perspective, shorting the break of 0.71 lands traders at the helm of November’s opening level carved from 0.7082, which could possibly hamper downside.
A break of 0.7082 to the downside, however, unlocks the door to a possible intraday shorting opportunity in the direction of January’s opening level at 0.7042/daily support mentioned above at 0.7046. In order to secure entry, traders are urged to drill down to the lower timeframes and attempt to pin down a bearish candlestick configuration on any retest seen at 0.7082 (red arrows).
Today’s data points: Limited.
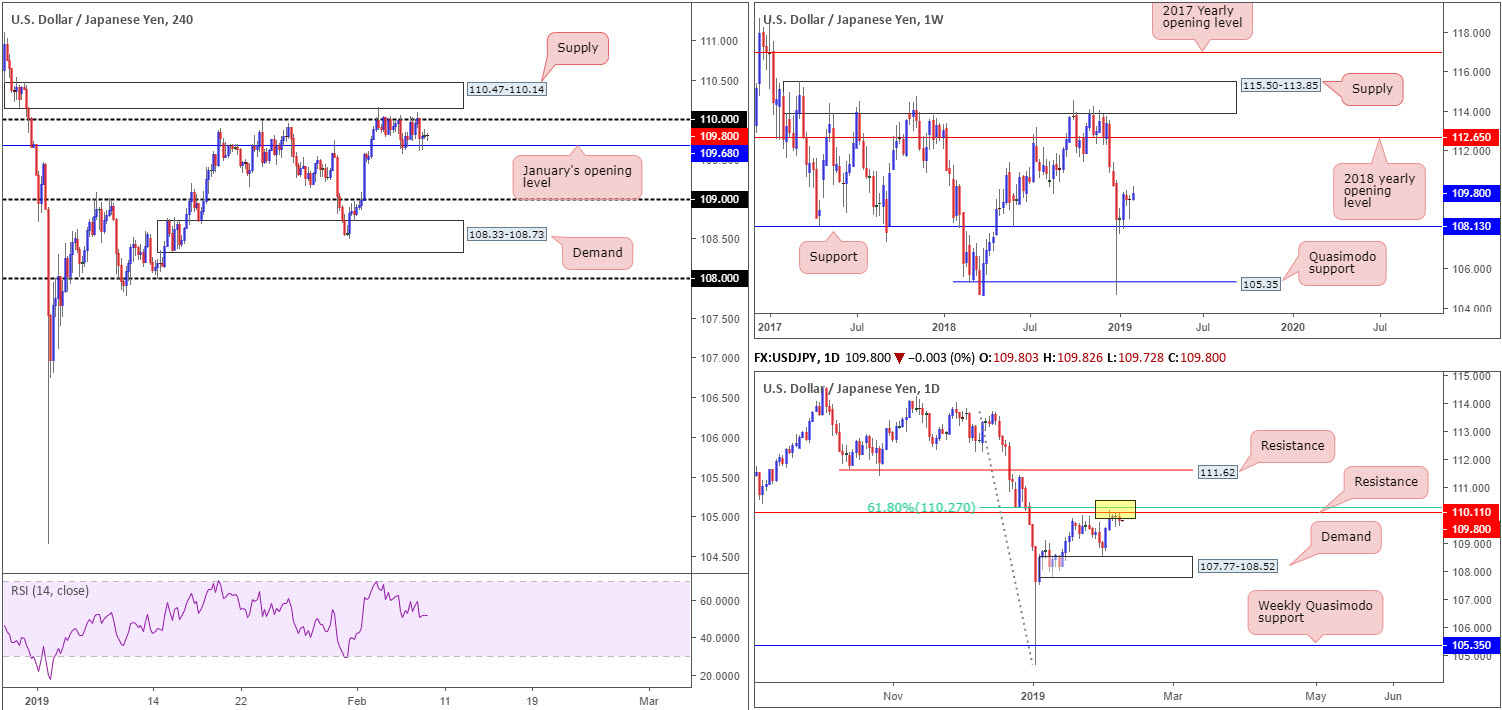
USD/JPY:
H4 candles on the USD/JPY, as you can see, remain sandwiched between the 110 handle and January’s opening level at 109.68, despite the US DOW 30 index exploring lower ground. In fact, the currency pair has barely moved over the week, up only 0.25% thus far.
On account of this somewhat dreary market of late, much of the following report will echo thoughts put forward in Thursday’s briefing.
The 110 handle remains a forceful ceiling in this market. The H4 supply hovering above 110 at 110.47-110.14, though, also remains of interest.
Another push above 110 not only trips stop-loss orders from traders attempting to fade the psychological mark, which, when filled, become buy orders to sell in to, breakout buyers will also likely attempt to join the movement here. This offer of liquidity to sell to, coupled with daily resistance seen plotted at 110.11 (and its nearby 61.8% Fibonacci resistance value at 110.27), will likely offer traders another opportunity to sell the current supply zone.
The only grumble in regard to selling the pair is weekly price trading above support at 108.13 and demonstrating room to press as far north as the 2018 yearly opening level at 112.65.
Areas of consideration:
Traders who believe the H4 supply and daily resistance is enough evidence to draw sellers’ attention will likely short this market at 110.14 with stop-loss orders planted just north of 110.47, should the supply area re-enter the fight. Once, or indeed if, the H4 candles reclaim 109.68 to the downside, this may be a good opportunity to begin thinking about reducing risk to breakeven and taking partial profits off the table.
For conservative traders, threatened by weekly structure exhibiting potential to the upside, waiting for additional candlestick confirmation might be an idea worth exploring before pulling the trigger (entry/stop parameters can be defined according to this structure).
Today’s data points: Limited.
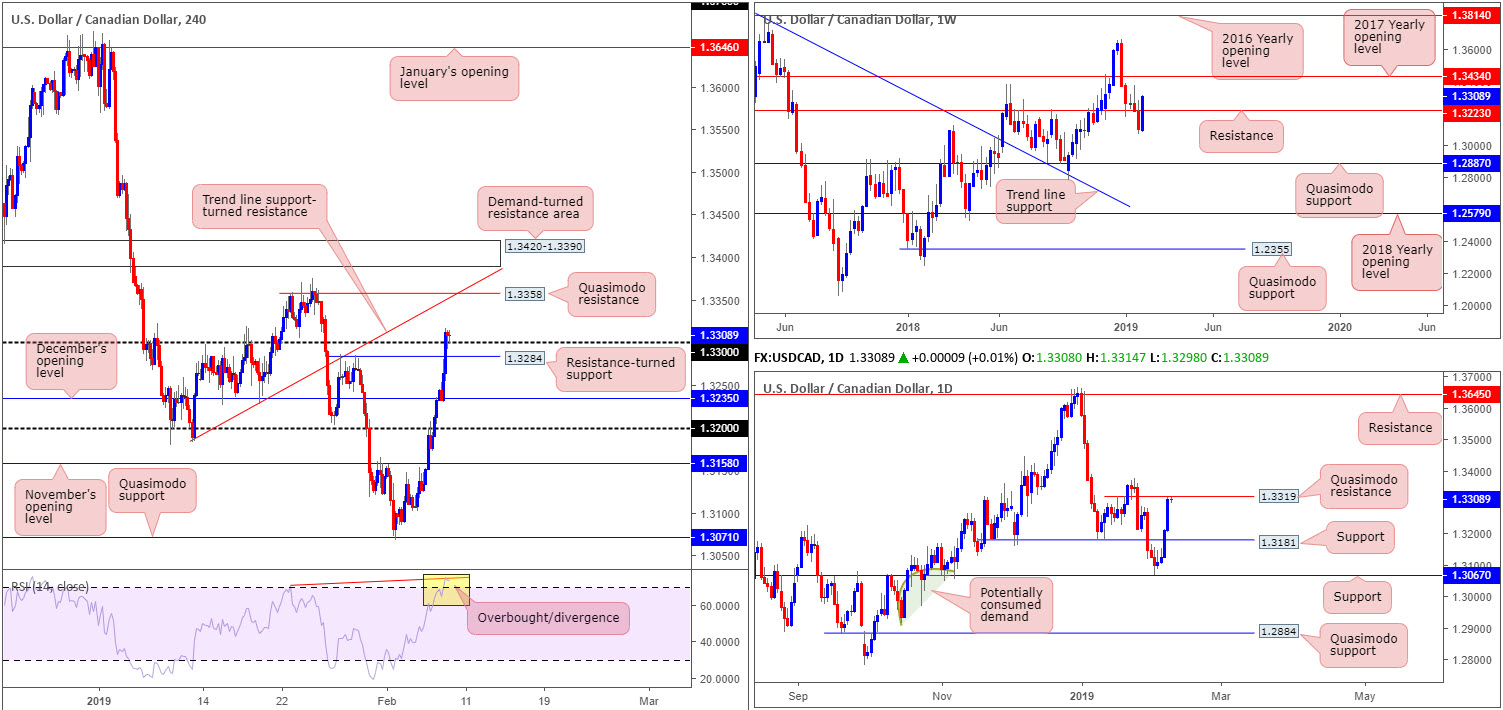
USD/CAD:
Partly on a recoil in oil prices (down 2.39% on the day) and the US dollar index recording its sixth consecutive daily gain, the USD/CAD catapulted itself northbound Thursday and registered its fourth consecutive daily session in the green.
Reclaiming two weeks’ worth of losses and recapturing weekly resistance at 1.3223, this has potentially set the stage for further buying towards the 2017 yearly opening level on the weekly timeframe at 1.3434. While this may be the case on the weekly timeframe, market participants on the daily timeframe are seen testing ground just south of a notable Quasimodo resistance at 1.3319.
Having seen latest movement on the H4 chart pull the candles beyond 1.33 into the close, further upside towards a Quasimodo resistance at 1.3358 that aligns nicely with a trend line support-turned resistance (taken from the low 1.3183) is a possibility. Despite room being seen for an advance, the RSI indicator currently meets the characteristics of a clean overbought/divergence play.
Areas of consideration:
Medium term, this is a particularly challenging market to read.
H4 buyers appear in good form above 1.33, potentially gearing up for a continuation move north. The grumble here, of course, is not the weekly timeframe, which shows room to advance as well, it is the daily timeframe underlining a Quasimodo resistance. For that reason, buying this market is problematic until this level is removed. In saying that, though, once the daily level is consumed, buyers have to contend with possible selling from the current H4 Quasimodo resistance level that merges with a trend line support-turned resistance.
With the above in mind, a long in this market is restricted, though so is the path south. Selling, although in line with daily structure, has possible buying off 1.33 to contend with and another layer of local support seen nearby at 1.3284. For folks considering shorting the H4 Quasimodo, there’s a strong possibility support will swiftly enter the mix off the (at the point it will be) the broken daily Quasimodo resistance-turned possible support.
Today’s data points: Canadian Employment Change and Unemployment Rate.
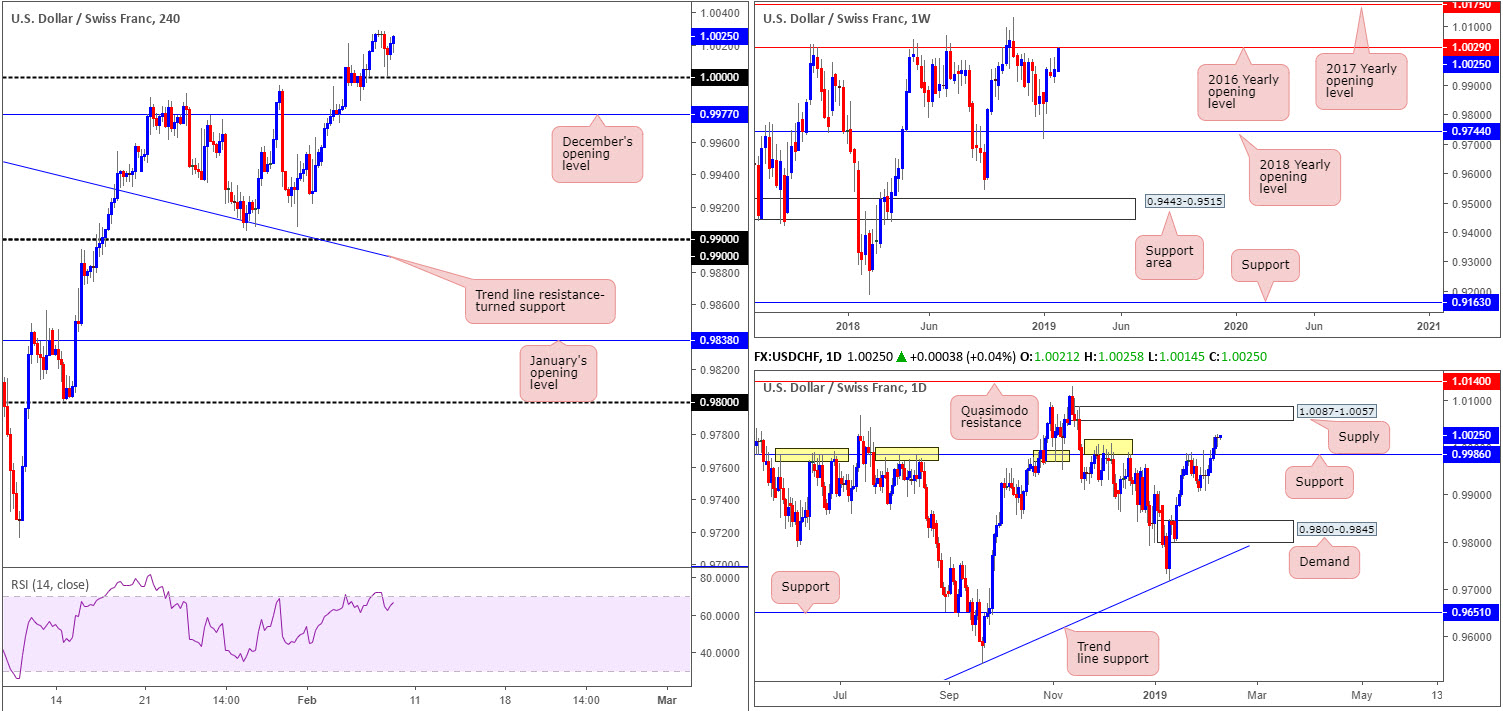
USD/CHF:
From the weekly timeframe, the research team notes the USD/CHF dipping its toe into resistance territory at 1.0029: the 2016 yearly opening level. This is an incredibly strong barrier, with history dating as far back as early 2015.
Although weekly sellers may enter the fray, daily players, after violating resistance at 0.9986 in recent trading, have supply at 1.0087-1.0057 in view as its next upside target. Note this is a fresh area of supply, meaning it has yet to be tested and is likely a strong barrier. It is also worth noting a move to this supply does not negate the weekly resistance at 1.0029. Between 1.0029 and the lower edge of daily supply at 1.0057 is less than thirty pips which is little more than a blip on the weekly scale.
The story over on the H4 candles, however, resembled a perfect buying environment. Amid early US hours Thursday, the pair retested 1.0000 (parity) as support in the shape of a bullish pin-bar formation. This, alongside H4 action exhibiting scope for a move towards resistance at 1.0053 (not seen on the screen), as you can imagine, excited candlestick enthusiasts.
Areas of consideration:
A large number of traders long from the recent bullish pin-bar pattern off 1.0000, although appealing, are likely to feel the sting of weekly selling today/early next week. In saying that, though, should traders who are long this market exercise prudent trade management and liquidate a large portion of their position around the H4 resistance level mentioned above at 1.0053 (essentially representing the underside of daily supply at 1.0057), they will likely profit.
In terms of trading opportunities going forward, according to the research team, the daily supply mentioned above at 1.0087-1.0057 is a logical base to be looking for selling openings into this market. Not only is it positioned a few pips above the current weekly resistance, it is a fresh zone. Therefore, should H4 price strike this area and form a notable bearish candlestick pattern (entry/stop parameters can be defined according to this structure) a sell from here is considered high probability, targeting 1.0000 as the initial support target.
Today’s data points: Limited.
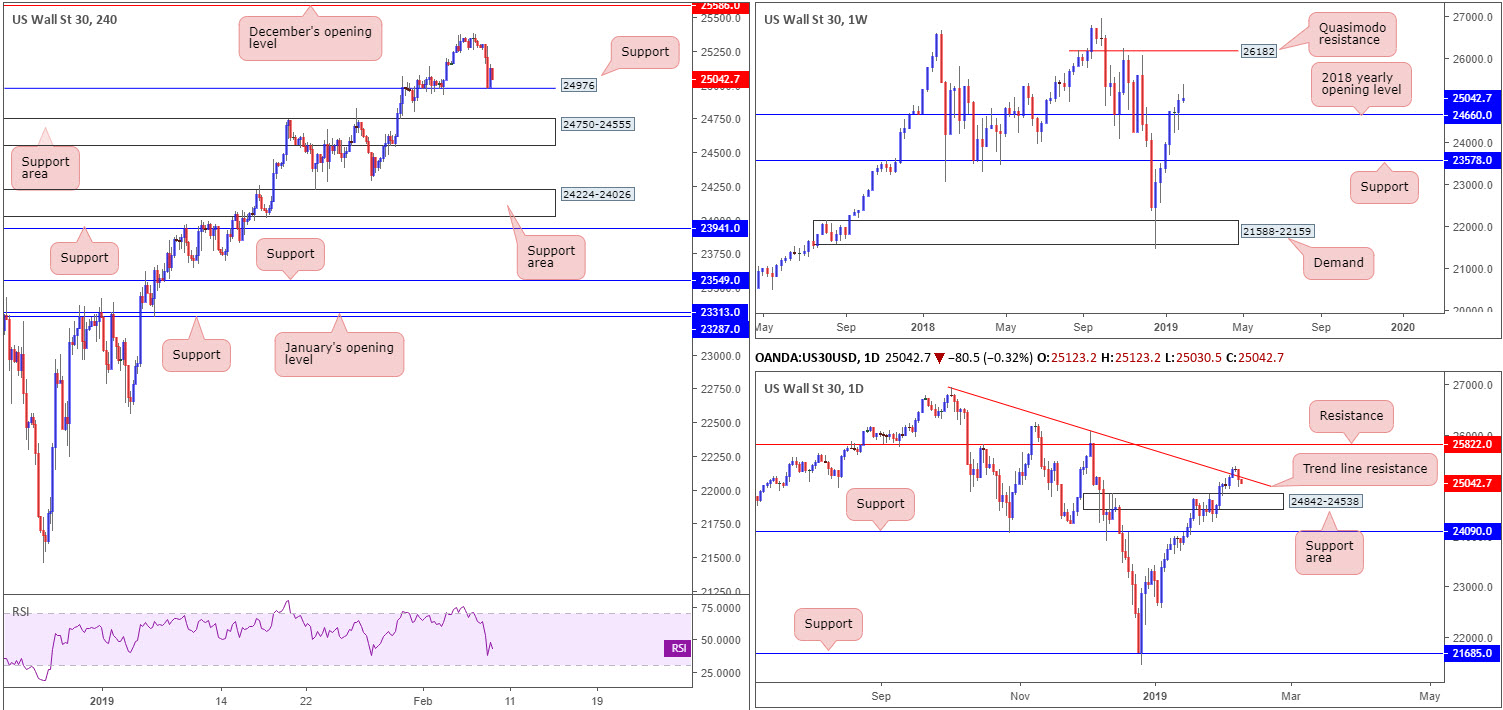
Dow Jones Industrial Average:
Putting an end to the impressive Bull Run of late, US equities concluded Thursday’s segment in negative territory, down 0.79%. Trade concerns between the US and China weighed on risk sentiment, dragging the index south towards H4 support coming in at 24976, which, as you can see, has thus far been responsive. Should buyers continue to defend this barrier, aside from Wednesday’s high 25385, the next upside target on the H4 scale falls in around December’s opening level at 25586.
On a broader perspective, weekly price, although technically displays room to trade as far north as Quasimodo resistance at 26182, is currently chalking up a bearish pin-bar formation. This could, assuming it generates additional sentiment to the downside, set the stage for a potential retest play off the nearby 2018 yearly opening level at 24660. The story on the daily timeframe, nonetheless, dipped its toe back beneath trend line resistance (extended from the high 26939) yesterday, currently trading just north of a support area at 24842-24538.
Areas of consideration:
A long from the H4 support mentioned above at 24976 is, of course, an option today, though judging the current weekly candle, and daily price trading beneath trend line resistance, the odds of strong buyers entering the fold are likely against traders here.
The H4 support area seen beneath the aforementioned H4 support level at 24750-24555 is noteworthy. Housed within this area is the weekly support at 24660, along with a connection to the current daily support area at 24842-24538, thus the H4 support zone has a high probability of responding should it be brought into the mix.
Traders can either enter long at the top edge of the H4 zone at 24750, positioning stops a few points beneath its edge, or, on a more conservative approach, wait for a bullish candlestick signal to form and trade based on the pattern’s rules of engagement. Ultimately, the first area of concern from this zone is 24976, therefore traders will want to see this level consumed before reducing risk to breakeven.
Today’s data points: Limited.
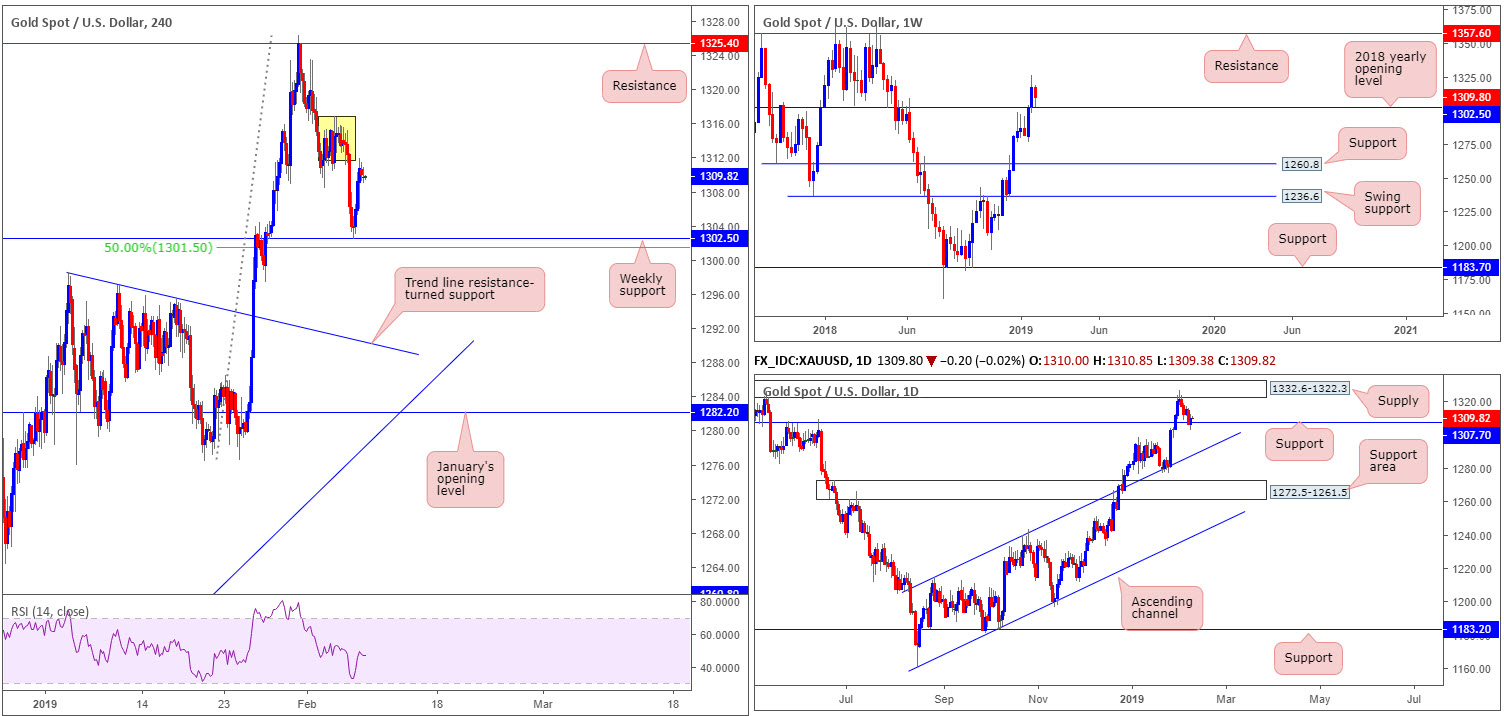
XAU/USD (GOLD):
Sited a few pips north of a 50.0% support value on the H4 timeframe at 1301.5, weekly support at 1302.5, as you can see, provided the market a platform for traders to base longs off of. This, along with daily support at 1307.7, is an area noted in previous reports as being somewhere active buyers likely inhabited. Well done to any of our readers who managed to jump aboard yesterday’s move.
Although we have some H4 supply lurking nearby around 1316.7/1311.5 (yellow), the daily supply at 1332.6-1322.3 (houses the H4 resistance seen at 1325.4 within) is likely a the initial target for buyers off weekly support.
Areas of consideration:
For folks long this market, it might be an idea to consider reducing risk to breakeven at this point, incase H4 sellers enter the fold from the noted yellow supply and retest weekly support. Overall, though, as highlighted above, the initial upside objective is daily supply at 1332.6-1322.3. An ultimate take-profit target rests around weekly resistance priced in at 1357.6.
In the event we do retest the weekly support today, this could, preferably on the back of a H4 bullish candlestick signal (entry/stop parameters can be defined according to this structure) be a good opportunity to enter long.
The use of the site is agreement that the site is for informational and educational purposes only and does not constitute advice in any form in the furtherance of any trade or trading decisions.
The accuracy, completeness and timeliness of the information contained on this site cannot be guaranteed. IC Markets does not warranty, guarantee or make any representations, or assume any liability with regard to financial results based on the use of the information in the site.
News, views, opinions, recommendations and other information obtained from sources outside of www.icmarkets.com.au, used in this site are believed to be reliable, but we cannot guarantee their accuracy or completeness. All such information is subject to change at any time without notice. IC Markets assumes no responsibility for the content of any linked site. The fact that such links may exist does not indicate approval or endorsement of any material contained on any linked site.
IC Markets is not liable for any harm caused by the transmission, through accessing the services or information on this site, of a computer virus, or other computer code or programming device that might be used to access, delete, damage, disable, disrupt or otherwise impede in any manner, the operation of the site or of any user’s software, hardware, data or property.


