EUR/USD:
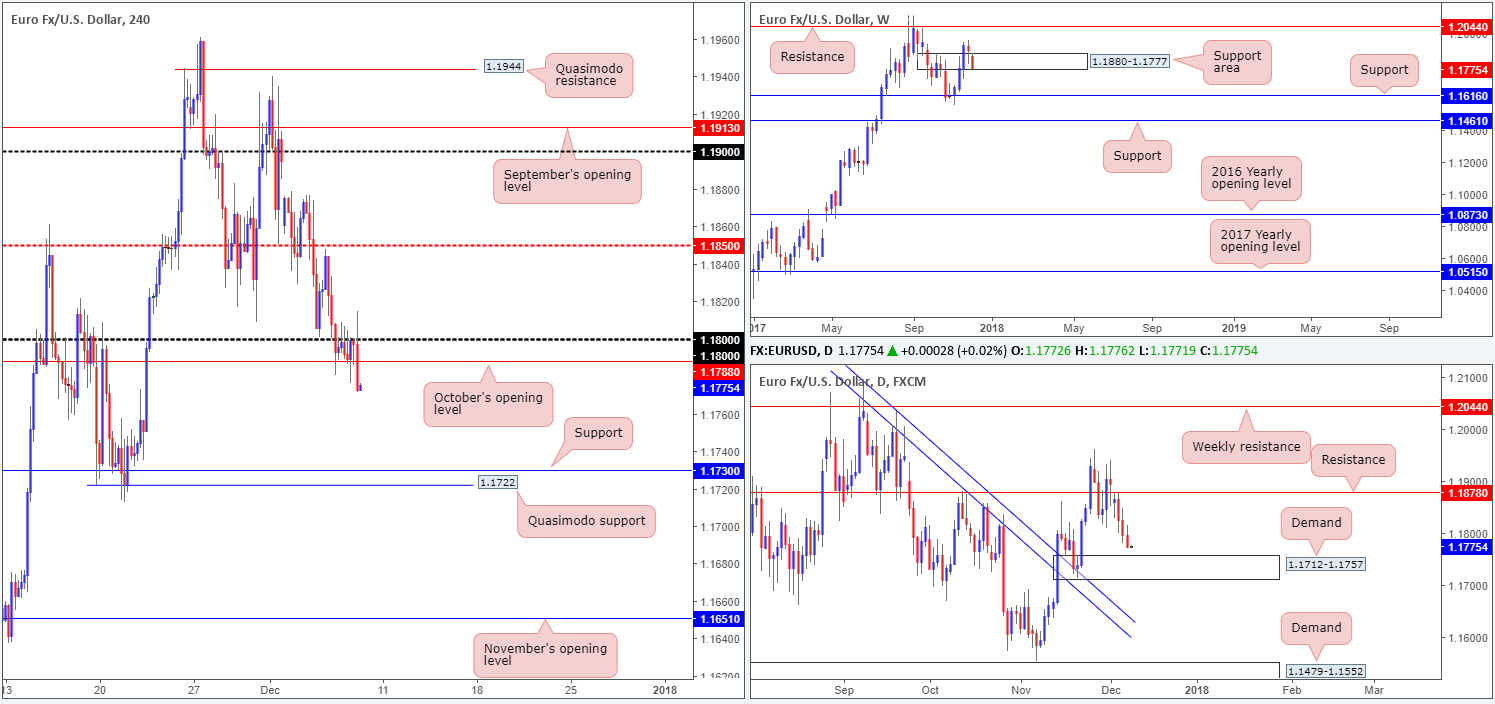
The single currency sustained further losses on Thursday, down 23 pips on the day. The H4 candles, as you can see, spent the majority of the day fluctuating within a narrow range between October’s opening level at 1.1788 and the 1.18 handle. It was only in the later hours of the US session did price dip lower.
According to the H4 scale, recent selling has potentially unlocked up the trail south down to as far as the H4 support at 1.1730, followed closely by the H4 Quasimodo support plotted at 1.1722. At the same time though, this move brought daily action closer to the top edge of a daily demand area at 1.1712-1.1757. Another important thing to note is that weekly price is currently pressuring the lower edge of a weekly support zone coming in at 1.1880-1.1777. In fact, at current prices, the major is seen trading marginally beneath the barrier! A continued move to the downside from here would likely bring weekly support at 1.1616 onto the radar.
Direction:
Long: A buy at current market price is challenging, due to the lack of support seen on the H4 picture. The better place for longs, technically speaking, might be the H4 support mentioned above at 1.1730. Not only is the line positioned within the walls of the aforesaid daily demand, it is also located just above a nice-looking H4 Quasimodo support at 1.1722. However, do keep in mind that you may have to contend with potential weekly selling at that point.
Short: While a short looks appealing below October’s opening level on the H4 timeframe, remain aware that you’d effectively be selling directly into a daily demand! Furthermore, it is difficult to judge weekly direction as weekly price is likely filling stops below the current weekly support zone as we write, which could lead to a rotation back to the upside!
Data points to consider: US employment figures at 1.30pm; US prelim UoM consumer sentiment at 3pm GMT.
Areas worthy of attention:
Supports: 1.1730; 1.1722; 1.1880-1.1777; 1.1712-1.1757.
Resistances: 1.1788; 1.18 handle.
GBP/USD:
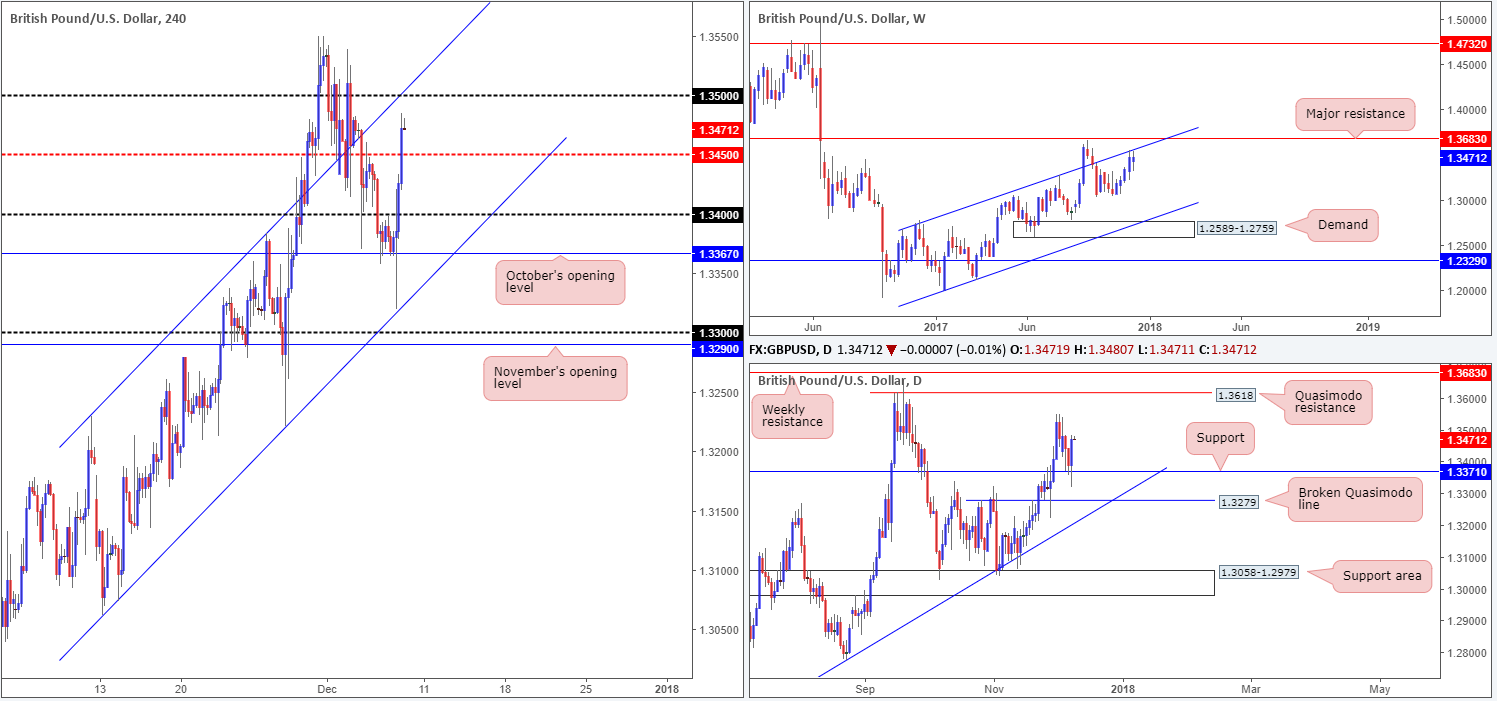
The British pound delivered a strong performance on Thursday on the back of recent developments surrounding the ‘Brexit’ situation. According to Reuters, Britain and Ireland are very close to reaching a border deal after the British PM delivered an updated offer in a bid to solve the current border dispute.
Several H4 tech resistances were consumed as a result of yesterday’s rally. The latest resistance to feel the chop was the H4 mid-level point at 1.3450, which, as you can see, placed the 1.35 handle back in the spotlight along with the H4 channel resistance extended from the high 1.3229. The move higher was also likely bolstered by daily support at 1.3371. Traders may also want to note that on this timeframe, the recent move higher chalked up a nice-looking daily bullish engulfing candle which shows room to extend up to as far north as the daily Quasimodo resistance at 1.3618. The flip side to this, of course, is that weekly price is seen digging lower after shaking hands with a weekly channel resistance taken from the high 1.2673.
Direction:
Long: Buying is appealing on the daily timeframe, but chancy on both H4 and weekly timeframes as you would effectively be entering long into a weekly channel resistance and a round number (H4) that boasts convergence from a H4 channel resistance. Not really the best of odds!
Short: A sell, according to structure, seems most logical. Selling 1.35 with stops planted above the 30th November high 1.3540 (H4) could be something to consider. This would give the trade room to breathe should H4 price decide to fake above 1.35 to collect stop-loss orders. The first take-profit target from this region could be the 1.3450 neighborhood.
Data points to consider: UK manufacturing production m/m and Goods trade balance at 9.30am; US employment figures at 1.30pm; US prelim UoM consumer sentiment at 3pm GMT.
Areas worthy of attention:
Supports: 1.3450; 1.3371.
Resistances: 1.35 handle; H4 channel resistance etched from the high 1.3229; weekly channel resistance taken from the high 1.2673.
AUD/USD:
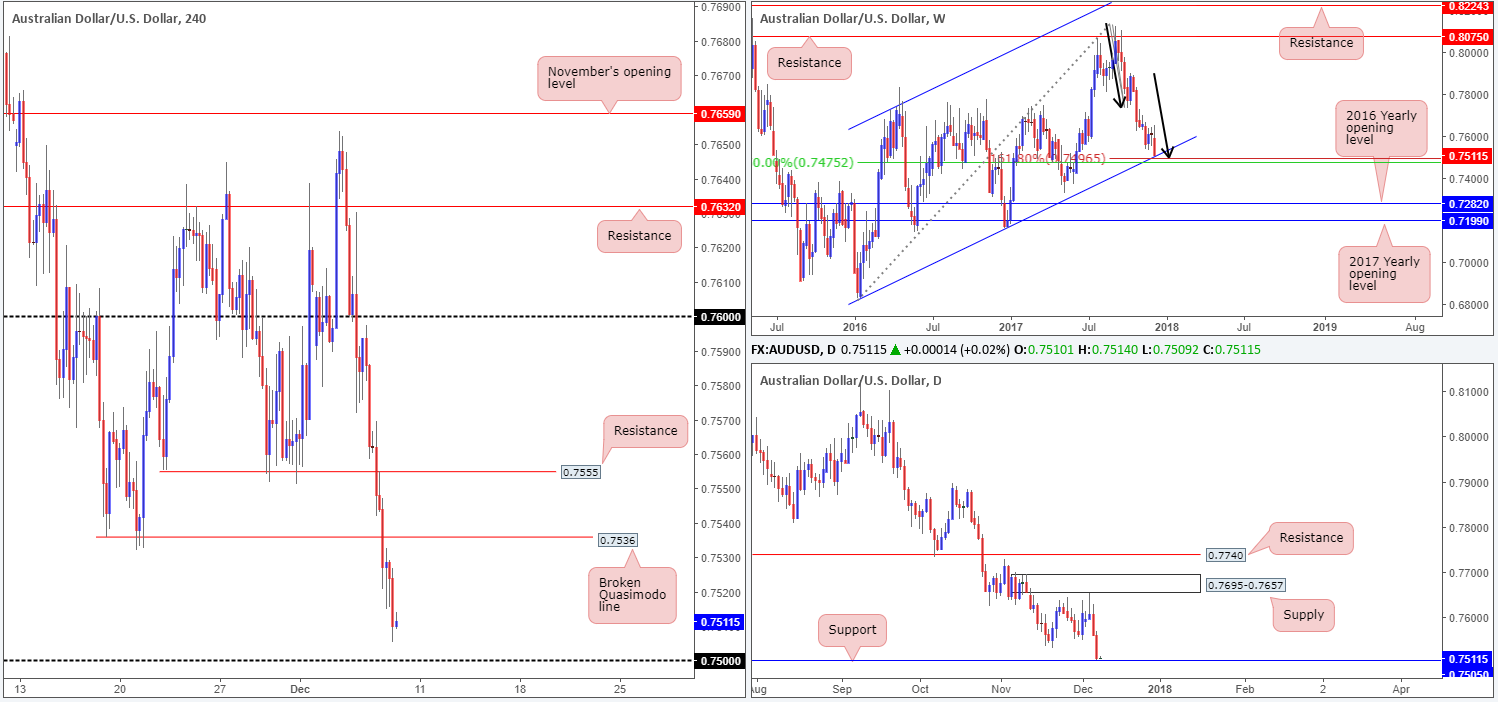
The AUD/USD suffered further losses on Thursday amid a strong dollar across the board. As can be seen from the H4 timeframe, the pair is currently lurking a few pips ahead of the 0.75 handle. As highlighted in previous reports, the 0.75 handle is an area that continues to stand out. Here’s why:
On the weekly timeframe, the weekly channel support extended from the low 0.6827 is interesting as it merges with a weekly 50.0% value at 0.7475 taken from the high 0.8125 and a nice-looking weekly AB=CD see black arrows 161.8% Fib ext. point situated at 0.7496.
Down on the daily timeframe, the next OBVIOUS base of support does not come into view until 0.7505. The history this level boasts is incredible!
Direction:
Long: The 0.75 handle is considered a strong buy zone given the higher-timeframe confluence surrounding the line. In order to avoid any whipsaw that may be seen through 0.75 and considering that there are likely higher-timeframe players involved here, a larger-than-usual stop may be required. Beyond the 0.7457 low seen back on the 06/06/17 (H4 timeframe) could be an option for stop-loss placement.
Short: It’d be very risky to short into current structure, despite the downtrend in play right now!
Data points to consider: Au. home loans m/m at 12.30am; Chinese trade balance at 2am; US employment figures at 1.30pm; US prelim UoM consumer sentiment at 3pm GMT.
Areas worthy of attention:
Supports: 0.75 handle; weekly channel support extended from the low 0.6827; 07505; 0.7475; weekly AB=CD 161.8% Fib ext. point situated at 0.7496.
Resistances: 0.7555; 0.7536.
USD/JPY:
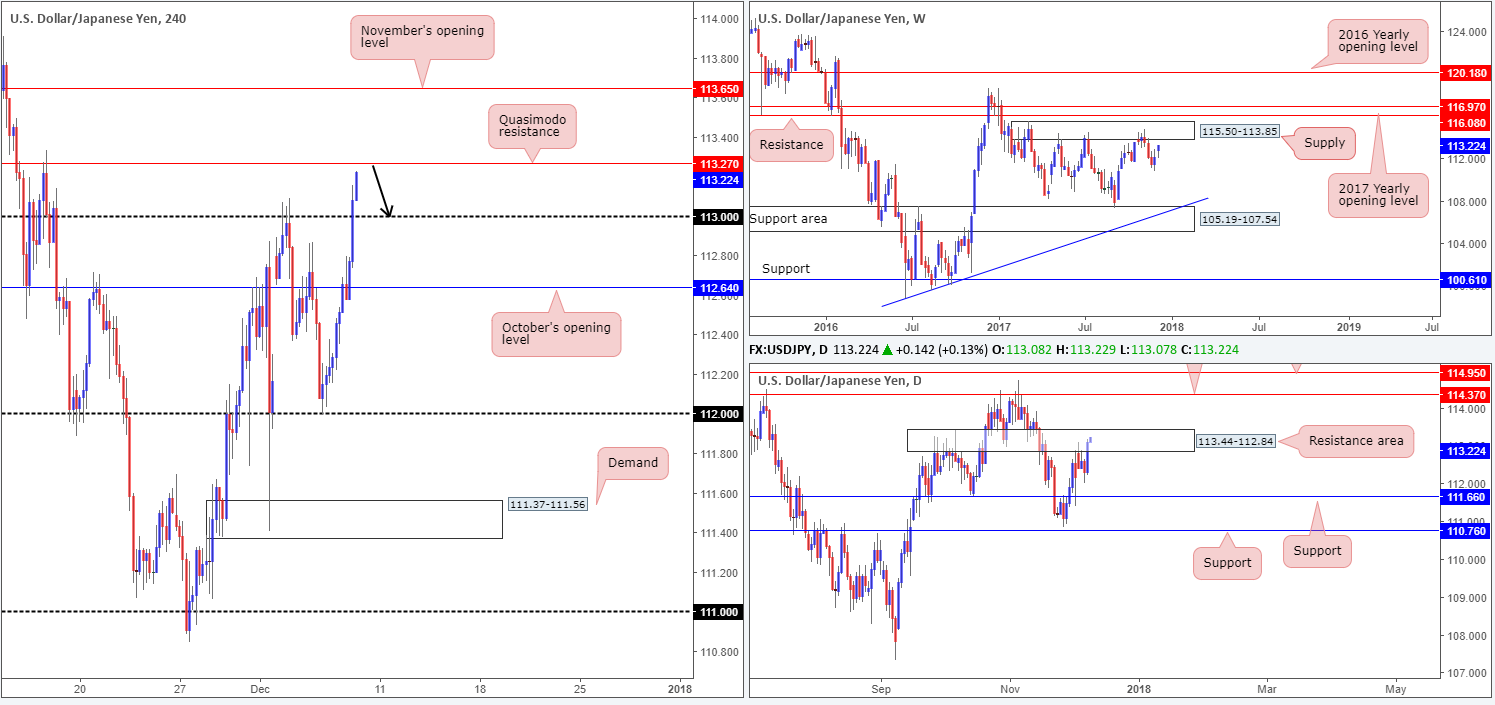
Recent action shows that the USD/JPY extended its bounce from the 112 handle on Thursday, lifting H4 price beyond both October’s opening level at 112.64 and the 113 handle. However, this far from a buyers’ market! Directly up ahead is a mini H4 Quasimodo resistance at 113.27 that’s positioned within the walls of a daily resistance area plotted at 113.44-112.84.
Direction:
Long: Buying this market at current price is not a high-probability move, according to the technicals.
Short: A sell from 113.27 is attractive given its connection to the daily timeframe. Stop-loss orders can be tightly placed above the daily resistance area at 113.46 (19 pips). The first take-profit target may want to be positioned at 113 (27 pips) – over one times your risk.
Data points to consider: US employment figures at 1.30pm; US prelim UoM consumer sentiment at 3pm GMT.
Areas worthy of attention:
Supports: 113 handle.
Resistances: 113.27; 113.44-112.84.
USD/CAD:
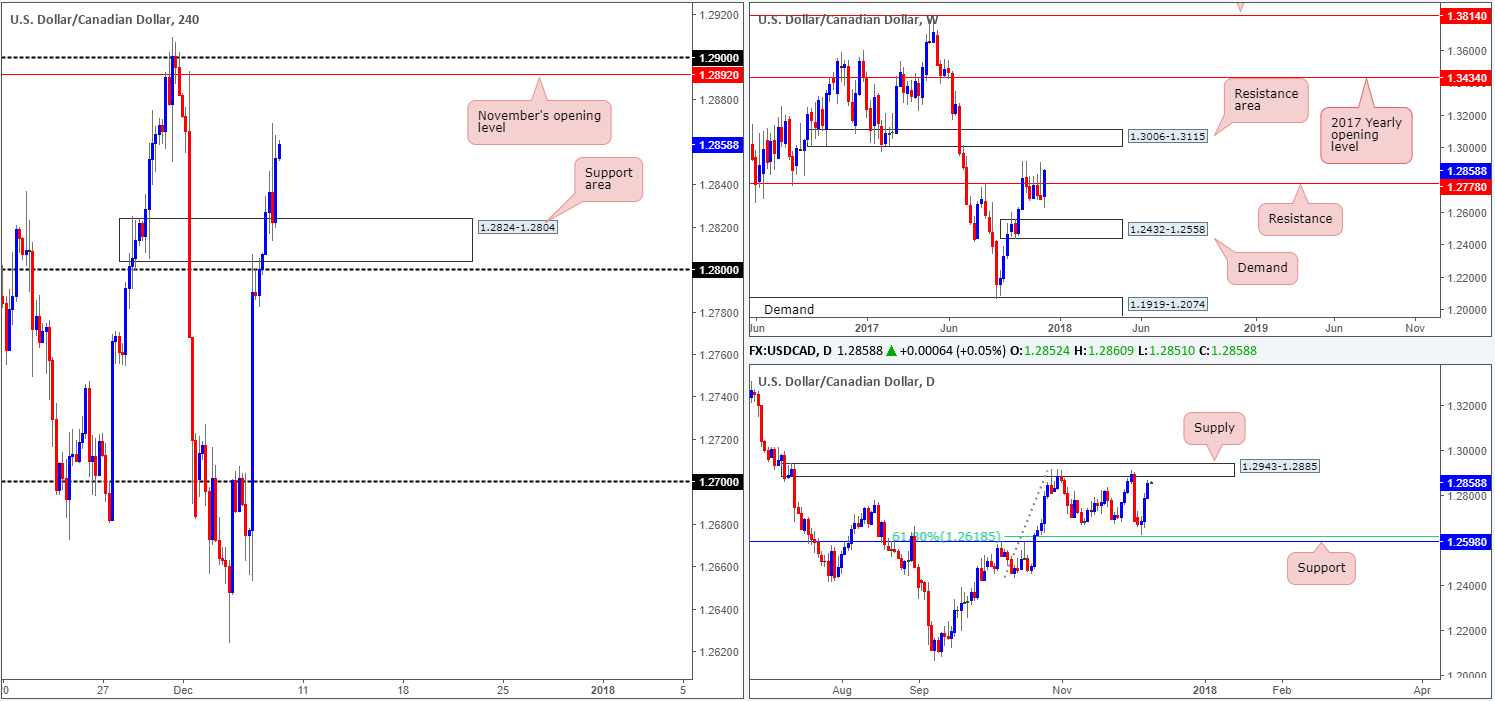
Early Asian hours saw the USDCAD continue to push higher, eventually outmuscling bears around the 1.28 handle. The H4 resistance area seen directly above at 1.2824-1.2804 put up little fight once 1.28 was consumed. However, as you can see, this area was later used as a platform of support to record fresh highs of 1.2868. The next upside target on the H4 scale can be seen at 1.29/1.2892: round number/November’s opening level.
What makes these two levels interesting is the fact that both are encapsulated within the confines of a daily supply area at 1.2943-1.2885, which has capped upside since late October. On the other side of the coin, however, weekly price is seen trading strong above a weekly resistance at 1.2778. A close above this line this week could trigger further buying up to the weekly resistance area plotted at 1.3006-1.3115.
Direction:
Long: With 1.29/1.2892 lurking nearby as well as the underside of the noted daily supply, entering long right now might not be the best path to take, despite weekly strength.
Short: A sell from 1.29/1.2892 is appealing due to its connection to the daily timeframe. Selling from here, therefore, is a possibility with stops placed above the current daily supply zone. Nevertheless, traders need to accept that there is a risk of further upside here in light of what the weekly timeframe is telling us at the moment!
Data points to consider: US employment figures at 1.30pm; US prelim UoM consumer sentiment at 3pm GMT.
Areas worthy of attention:
Supports: 1.2824-1.2804; 1.28 handle.
Resistances: 1.29 handle; 1.2892; 1.2943-1.2885; 1.3006-1.3115.
USD/CHF:
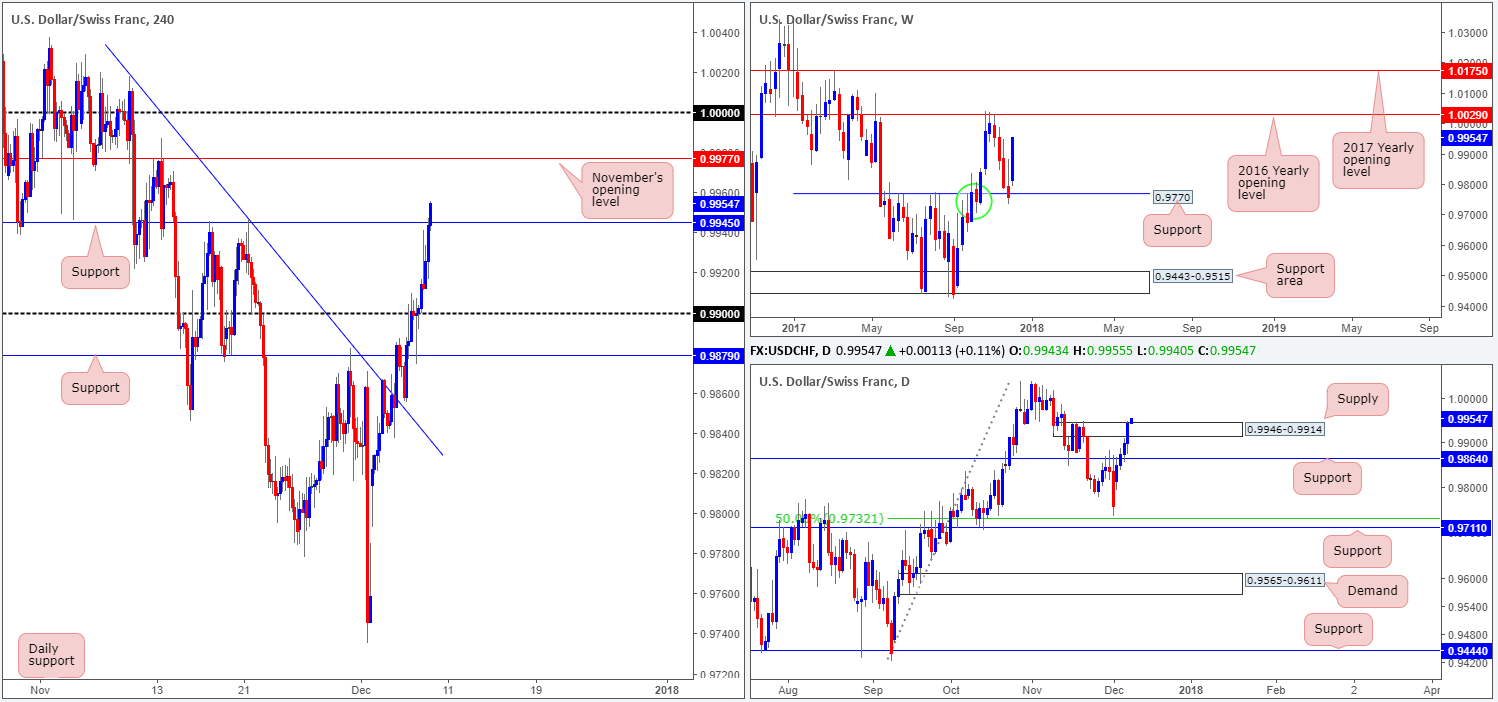
The US dollar continued to make ground against its Swiss counterpart on Thursday, reaching highs of 0.9946 on the day. In recent hours, nonetheless, further upside has been seen, consequently taking out the H4 resistance level at 0.9945 and (now acting support) the top edge of the daily supply zone noted at 0.9946-0.9914.
This has firmly placed November’s opening line seen on the H4 timeframe at 0.9977 in the spotlight, shadowed closely by parity (1.0000). What’s also interesting is that the current weekly candle shows little resistance on the horizon until we reach the 2016 yearly opening level seen on the weekly timeframe at 1.0029.
Direction:
Long: While both daily and weekly price show room to extend gains, buying this unit at current price would place one in awkward position as active sellers are likely lurking around November’s opening level and parity!
Short: Between the 2016 yearly opening level at 1.0029 and parity is, technically speaking, a high-probability reversal zone in this market.
Data points to consider: US employment figures at 1.30pm; US prelim UoM consumer sentiment at 3pm GMT.
Areas worthy of attention:
Supports: 0.9945.
Resistances: 0.9770; 1.0000; 1.0029.
DOW 30:
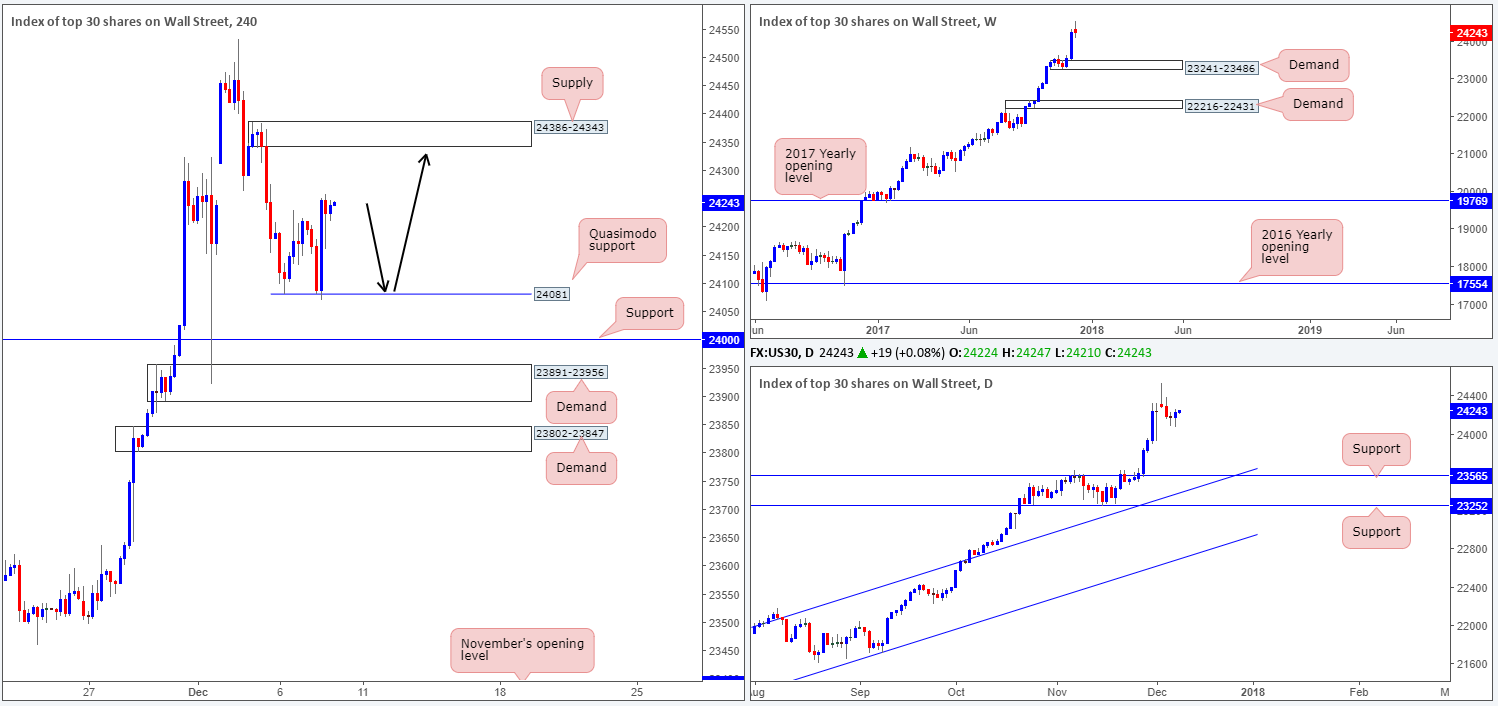
US equities ended the day in the green on Thursday on improved market sentiment. H4 buyers rallied from lows of 24069 and tapped a high of 24257, consequently forming a H4 Quasimodo support level marked at 24081. In the event that the H4 bulls continue to gain, the next area on the horizon is a H4 supply at 24386-24343. Beyond this base, we do not see much structure stopping the unit from clocking fresh record highs.
Direction:
Long: Should the H4 candles pullback and challenge the aforesaid H4 Quasimodo support level today then this could be a level of interest to buyers. In saying that though, traders will need to be prepared for the possibility of a fakeout here as the 24k round number is sited just beneath this level. A decisive bounce from 24081, however, could drag the H4 candles as far north as the H4 supply mentioned above at 24386-24343 and, given the strength of the underlying trend, quite possibly beyond.
Short: Although some investors say this is an overextended market right now (and to a point we would agree), we believe this to be a buyers’ market. There’s limited evidence, technically speaking, that there are serious sellers involved at this time.
Data points to consider: US employment figures at 1.30pm; US prelim UoM consumer sentiment at 3pm GMT.
Areas worthy of attention:
Supports: 24081; 24000.
Resistances: 24386-24343.
GOLD:
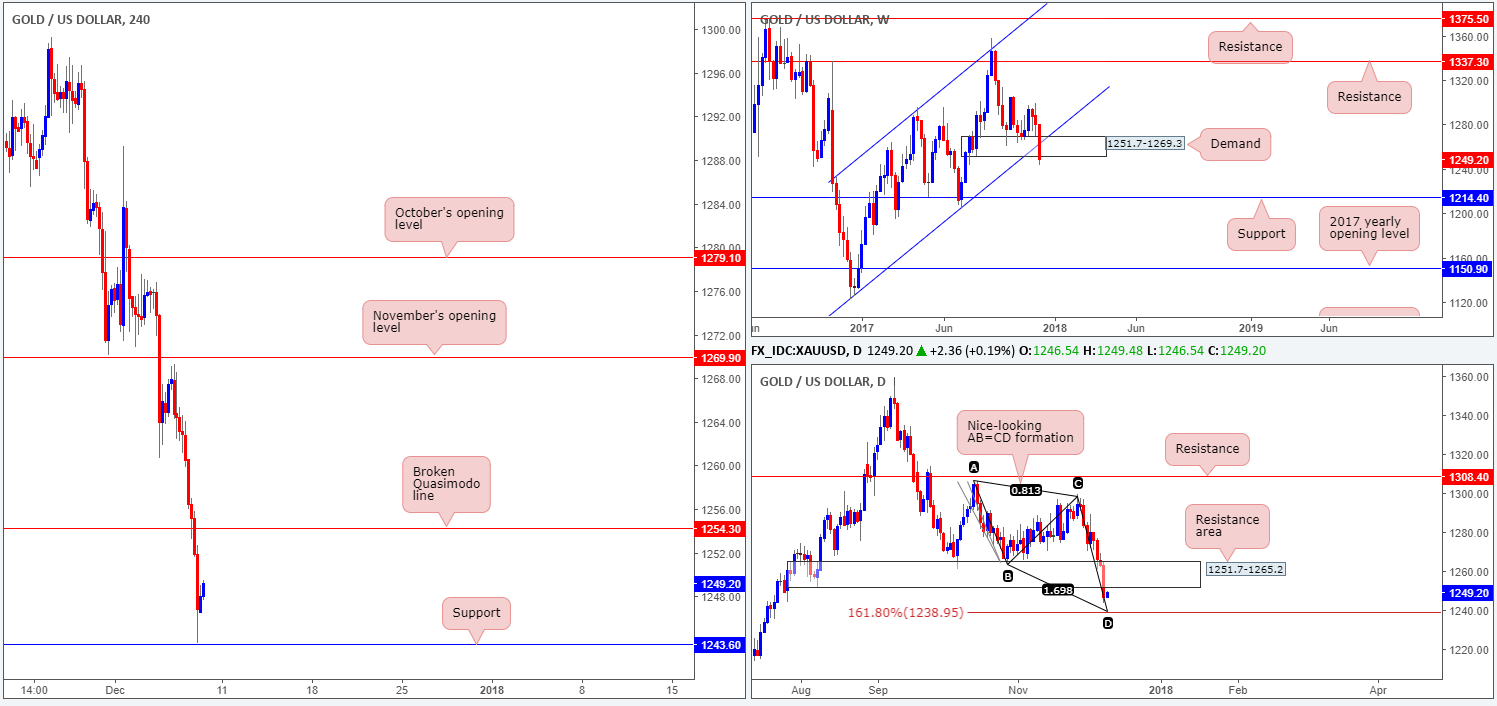
Kicking this morning’s report off with a look at the weekly timeframe, we can see that price recently engulfed both the weekly demand base at 1251.7-1269.3 and its intersecting weekly channel support etched from the low 1122.8. Assuming that the bears remain in the driving seat here, the next weekly downside target to have on the radar is the support level coming in at 1214.4.
The daily candles also drove beneath the daily demand base drawn from 1251.7-1265.2 in recent trade, which, at current price, is close to being retested as a resistance area. Also of particular interest on this timeframe is the daily AB=CD 161.8% bullish completion point at 1238.9.
Bouncing across to the H4 timeframe, it is clear to see that the H4 candles caught a fresh bid just ahead of a H4 support level at 1243.6. Continued buying from this point could lead to a retest of the recently broken H4 Quasimodo line at 1254.3.
Direction:
Long: Buying this market after such a dominant push below significant structure is chancy, as a lot of traders will be looking to sell this momentum on pullbacks.
Short: A sell from the broken H4 Quasimodo line at 1254.3 is certainly an option today. This barrier carries weight due to its position on the higher timeframes: the underside of the broken weekly/daily demands at 1251.7.
Areas worthy of attention:
Supports: 1243.6; 1238.9; 1214.4.
Resistances: 1254.3; 1251.7-1265.2.