
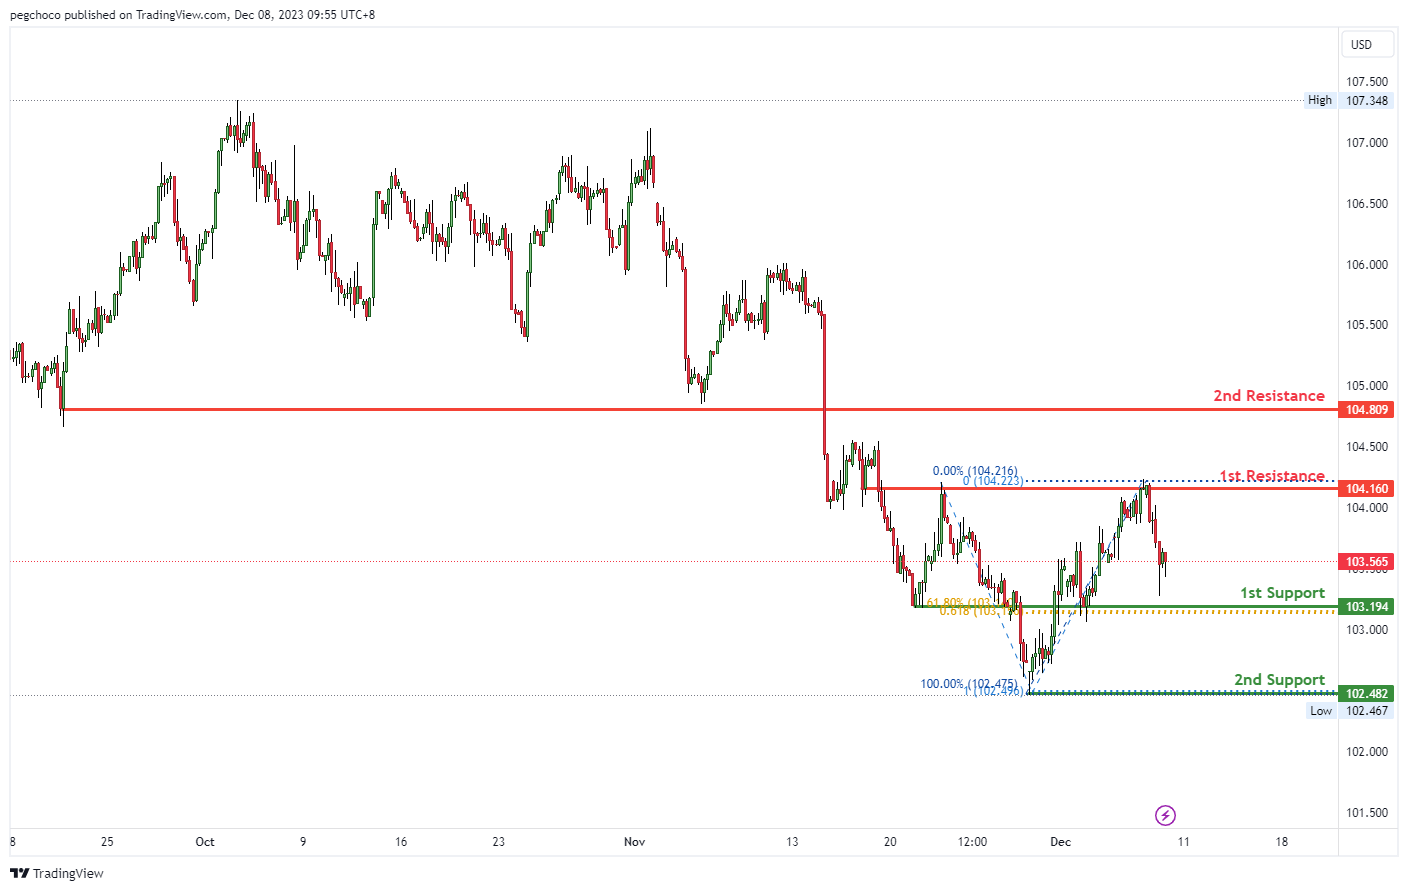
DXY:
The DXY chart currently shows a bearish overall momentum, indicating a potential for a bearish continuation in the price action.
The 1st support level at 103.19 is considered an overlap support. This level holds significance as it aligns with both the 61.80% Fibonacci Retracement and the 61.80% Fibonacci Projection, indicating a Fibonacci confluence. This confluence suggests that 103.19 could be a strong support level where buyers may step in.
The 2nd support at 102.48 is identified as a swing low support. Swing lows often serve as areas of potential buying interest, and this level reinforces the significance of 102.48 as a potential support zone.
On the resistance side, the 1st resistance at 104.16 is classified as an overlap resistance. Overlap resistances are historical levels where selling interest may intensify, potentially limiting upward price movements.
The 2nd resistance at 104.81 is categorized as a pullback resistance. This suggests that it is a level where selling pressure could increase, making it a potential barrier to further bullish movements.
EUR/USD:
The EUR/USD chart currently exhibits a bearish overall momentum, suggesting a potential bearish reaction off the 1st resistance level.
The 1st support at 1.0767 is categorized as a pullback support and is also associated with the 161.80% Fibonacci Extension level. This confluence of technical factors suggests that 1.0767 could be a significant support level where buyers might step in, potentially providing support for the EUR/USD pair.
The 2nd support at 1.0663 is identified as an overlap support. Overlap supports are historical levels where buying interest may emerge, reinforcing the significance of this support level.
On the resistance side, the 1st resistance at 1.0836 is noted as an overlap resistance. Overlap resistances are historical levels where selling interest may intensify, potentially leading to a bearish reaction from this level.
The 2nd resistance at 1.0960 is categorized as a pullback resistance, indicating that it could be a level where selling pressure may increase, potentially limiting bullish movements.

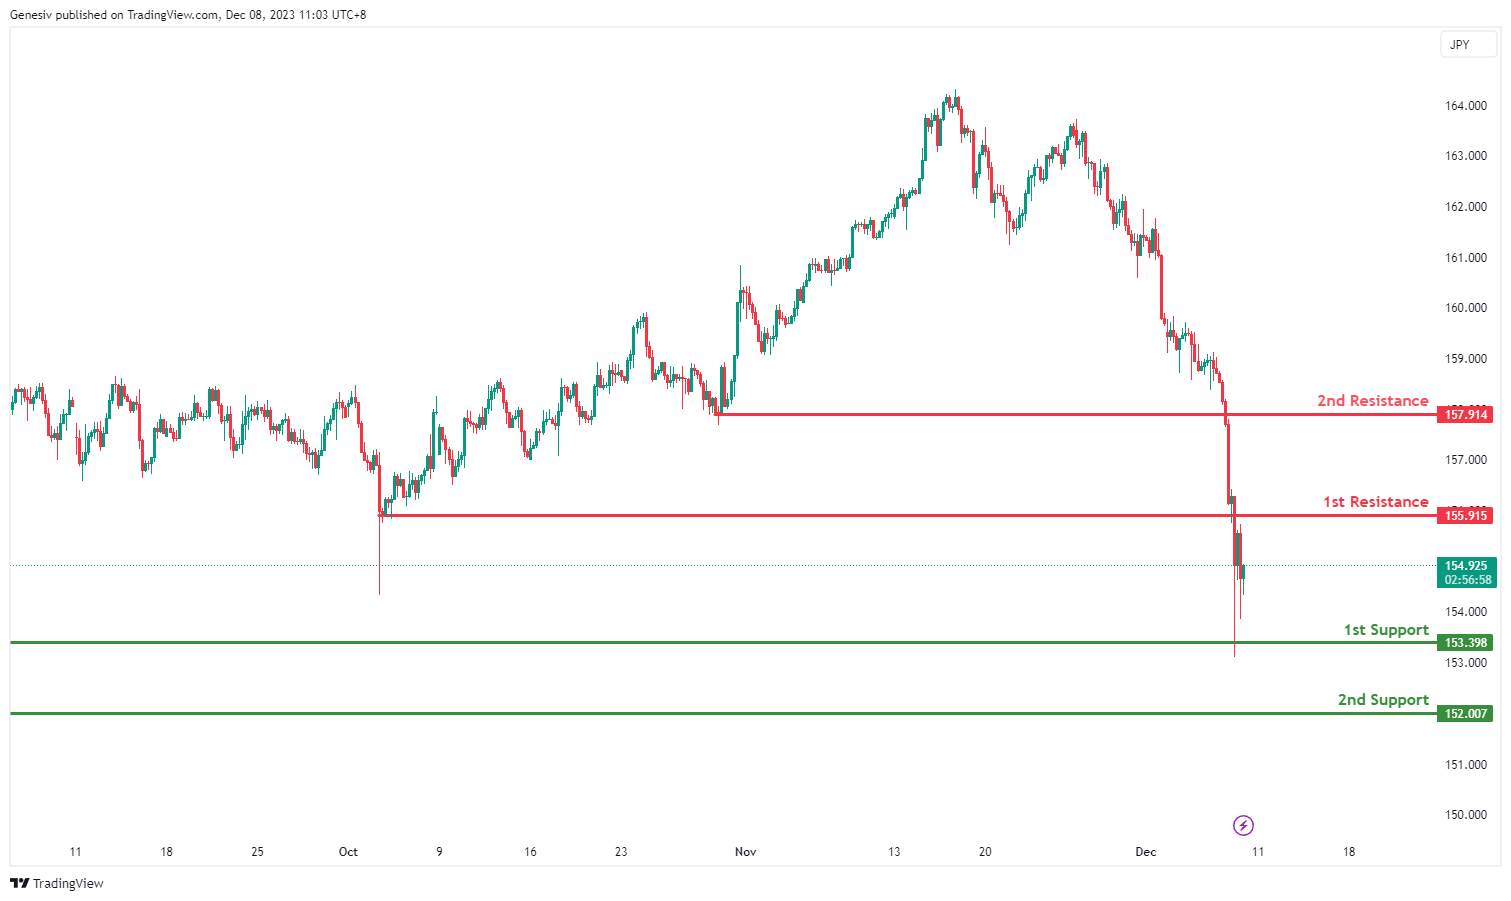
EUR/JPY:
The EUR/JPY chart currently has bearish overall momentum, suggesting a potential bearish continuation towards the first support.
1st Support at 153.40: This level is identified as a pullback support, indicating a potential area where buying interest might emerge, contributing to a stabilization in the price.
2nd Support at 152.01: The second support is described as a swing low support, reinforcing the notion that this level has historical significance as a support zone.
1st Resistance at 155.92: The first resistance is recognized as a pullback resistance, suggesting a level where selling interest might be observed, acting as a hurdle to further upward movement.
2nd Resistance at 157.00: The second resistance is noted as a pullback resistance, indicating a level where selling interest might be encountered, potentially acting as an additional barrier to the bearish trend.
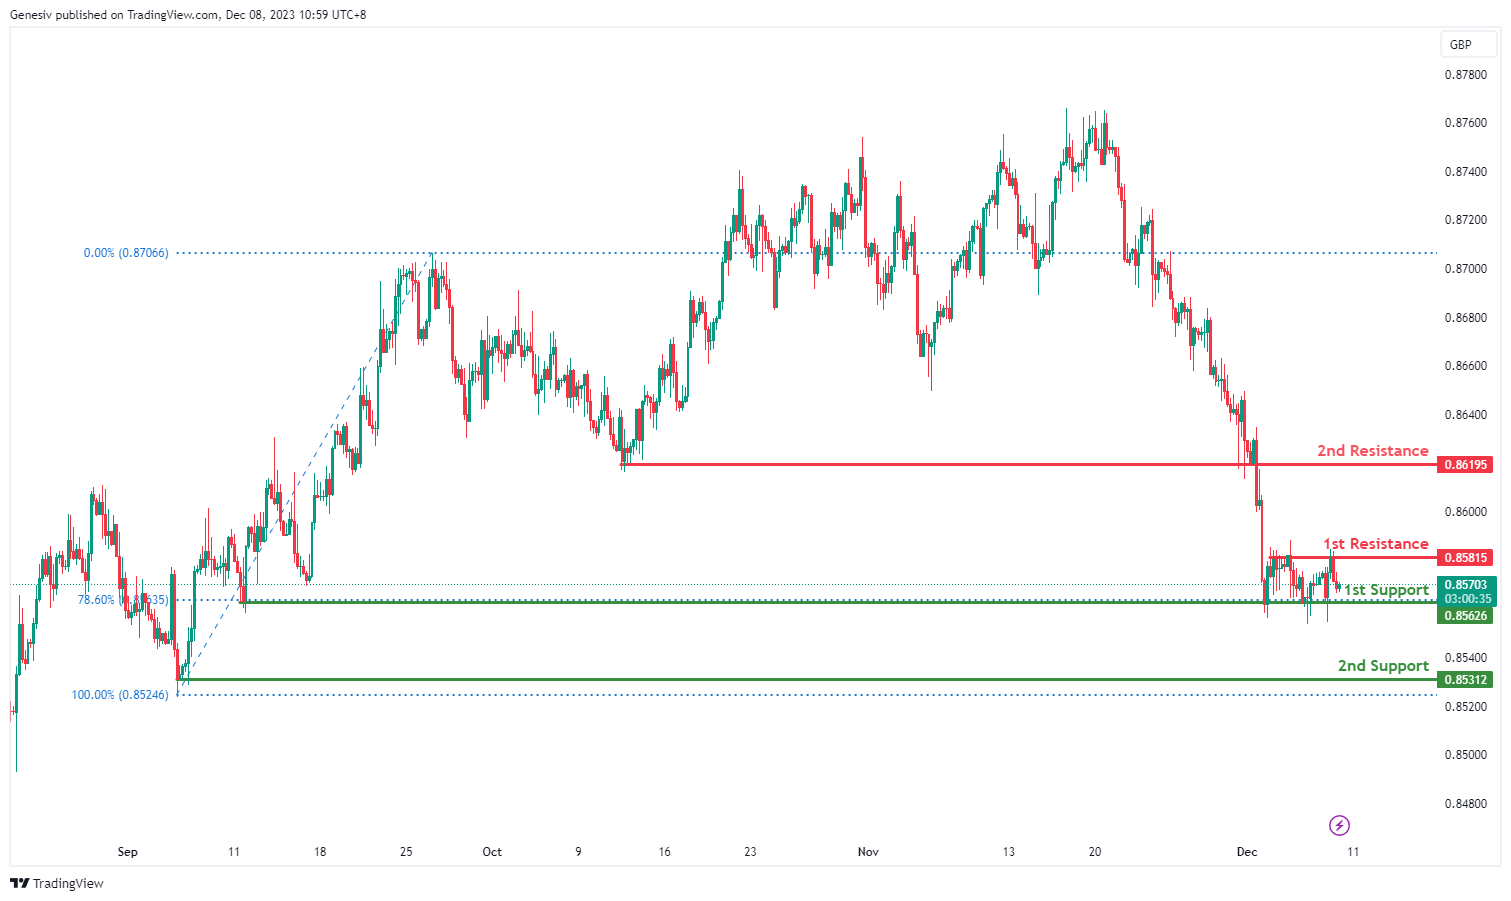
EUR/GBP:
The EUR/GBP currency pair exhibits a a weak bearish momentum with low confidence, suggesting a potential bearish continuation towards the first support.
1st Support at 0.8563: This level is identified as a multi-swing low support, indicating historical significance as a level where the price has found support. Additionally, it coincides with the 78.60% Fibonacci retracement, adding to its potential strength as a support zone.
2nd Support at 0.8531: The second support is described as a pullback support, reinforcing the notion that buyers might show interest at this level, potentially leading to a stabilization in price.
1st Resistance at 0.8582: The first resistance is recognized as a multi-swing high resistance, suggesting historical points where the price faced obstacles and potential reversals. This level may act as a barrier to upward movement.
2nd Resistance at 0.8620: The second resistance is noted as a pullback resistance, indicating a level where selling interest might be observed, potentially acting as an obstacle to the bearish trend.
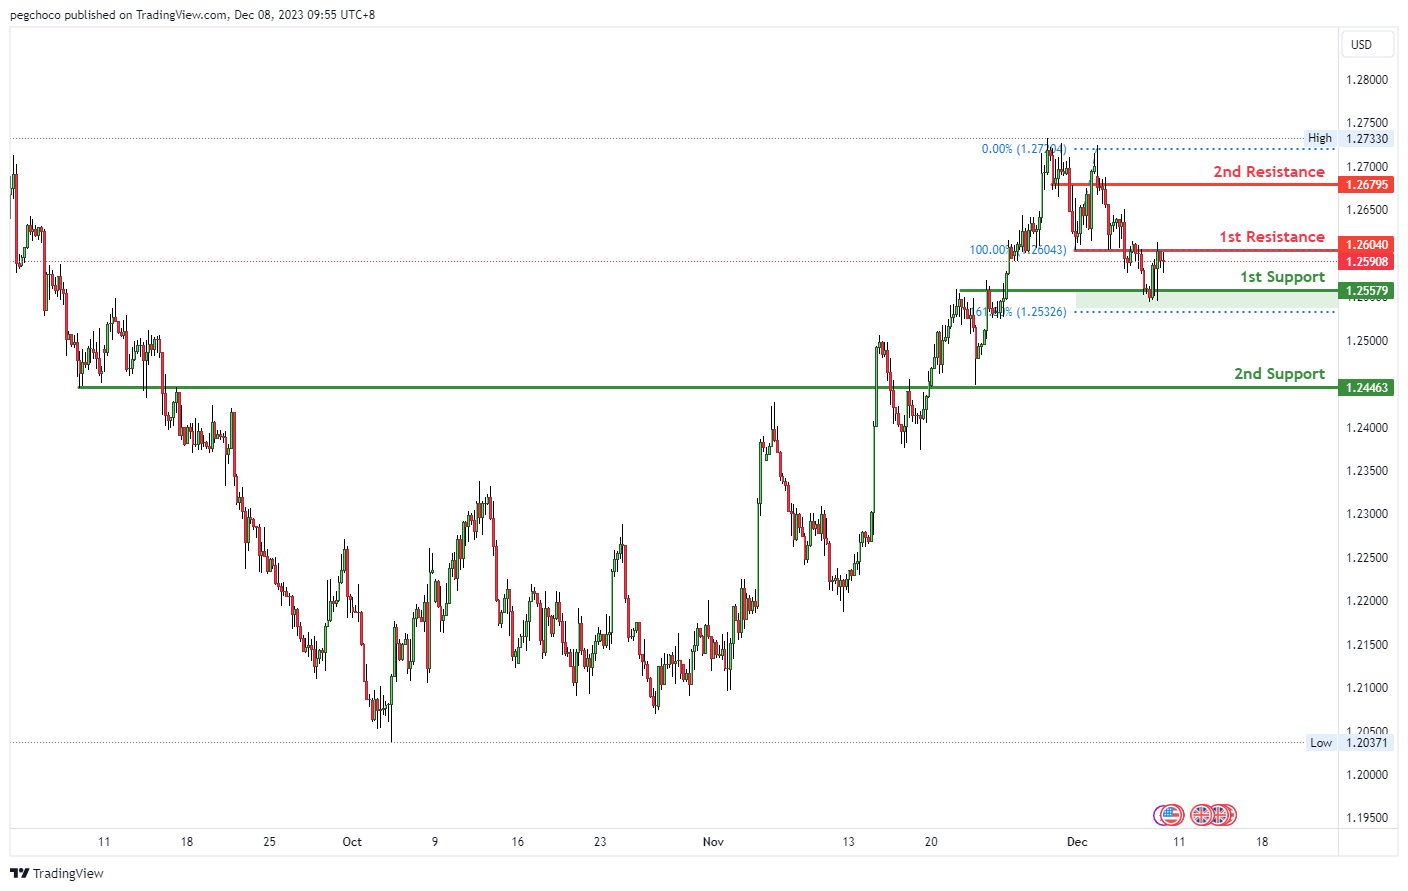
GBP/USD:
The GBP/USD chart currently exhibits a bearish overall momentum, indicating potential for a bearish continuation towards the 1st support level.
The 1st support at 1.2535 is categorized as an overlap support. Overlap supports are historical levels where buying interest may emerge, potentially providing support for the GBP/USD pair.
The 2nd support at 1.2446 is also identified as an overlap support, reinforcing its significance as a potential level where buyers might become active.
On the resistance side, the 1st resistance at 1.2604 is noted as an overlap resistance. Overlap resistances are historical levels where selling interest may intensify, potentially limiting upward movements.
The 2nd resistance at 1.2679 is categorized as an overlap resistance, further indicating its potential significance as a level where selling pressure may increase.
GBP/JPY:
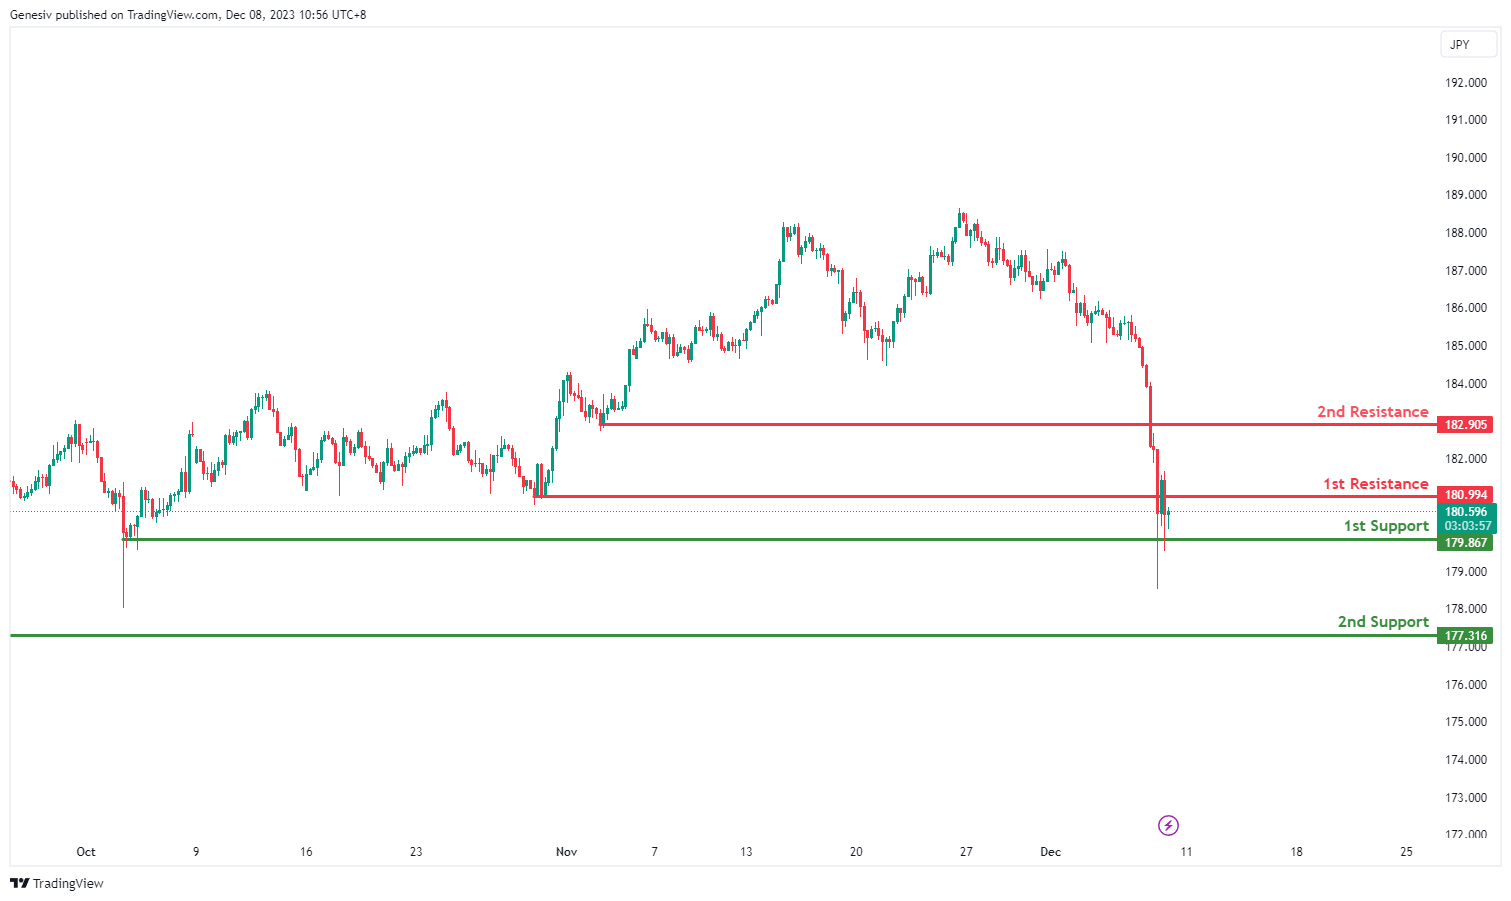
The GBP/JPY currency pair is currently experiencing a bearish momentum, indicating a potential bearish continuation towards the first support.
1st Support at 179.87: This level is identified as a swing low support, suggesting historical significance as a level where the price has found support in the past.
2nd Support at 177.32: The second support is described as a pullback support, indicating a level where buyers might show interest, potentially leading to price stabilization.
1st Resistance at 180.99: The first resistance is recognized as a pullback resistance, suggesting a level where selling interest might be observed, acting as a hurdle to further downward movement.
2nd Resistance at 182.91: The second resistance is noted as a pullback resistance, reinforcing the potential for selling interest and acting as an additional obstacle to the bearish trend.
USD/CHF:
The analysis for the USD/CHF currency pair is as follows:
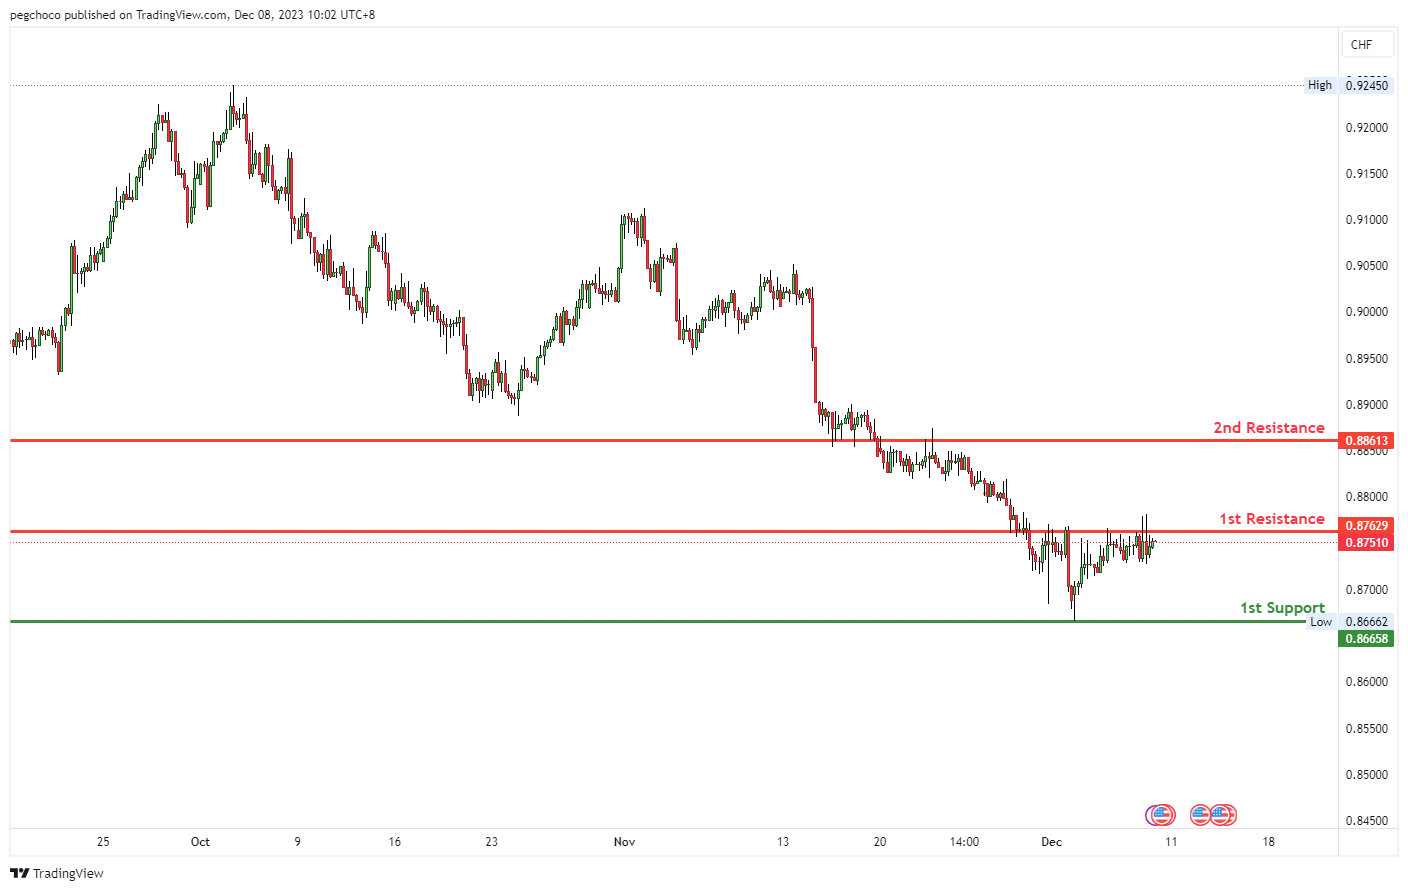
The USD/CHF chart currently displays a neutral overall momentum, suggesting that price could potentially fluctuate between the 1st resistance and 1st support levels.
The 1st support at 0.8665 is categorized as a multi-swing low support. Multi-swing low supports are historical levels where buying interest may emerge, potentially providing support for the USD/CHF pair.
On the resistance side, the 1st resistance at 0.8762 is identified as an overlap resistance. Overlap resistances are historical levels where selling interest may intensify, potentially limiting upward movements.
The 2nd resistance at 0.8861 is also categorized as an overlap resistance, reinforcing its significance as a potential level where selling pressure may increase.
USD/JPY:
The USD/JPY chart currently exhibits a bearish overall momentum, suggesting the potential for a bearish continuation towards the 1st support level.
The 1st support at 141.74 is categorized as an overlap support. Overlap supports are historical levels where buying interest may emerge, potentially providing support for the USD/JPY pair.
Further down, there is a 2nd support at 137.68, also identified as an overlap support. This reinforces the significance of this support level, suggesting it as a potential area where buyers might become active.
On the resistance side, the 1st resistance at 144.74 is noted as a pullback resistance, implying that it’s a substantial barrier where selling interest could intensify, potentially triggering a bearish continuation.
The 2nd resistance at 146.17 is also identified as a pullback resistance, further indicating its potential significance as a level where selling pressure may increase.

USD/CAD:
The USD/CAD chart currently has a bearish overall momentum, and there’s potential for a bearish continuation towards the 1st support level.
The 1st support at 1.3521 is categorized as an overlap support. This level is significant because it indicates a confluence of technical factors, including the 61.80% Fibonacci Retracement and the 61.80% Fibonacci Projection. This suggests that it could be a strong level where buying interest may emerge, potentially providing support for the USD/CAD pair.
The 2nd support at 1.3481 is identified as a swing low support, further reinforcing its significance as a potential level where buyers might become active. Additionally, it is associated with the 100% Fibonacci Projection, making it a notable level.
On the resistance side, the 1st resistance at 1.3622 is noted as a swing high resistance. This implies that it’s a substantial barrier where selling interest could intensify, potentially limiting upward movements.
The 2nd resistance at 1.3666 is categorized as an overlap resistance, indicating its potential significance as a level where selling pressure may increase.

AUD/USD:
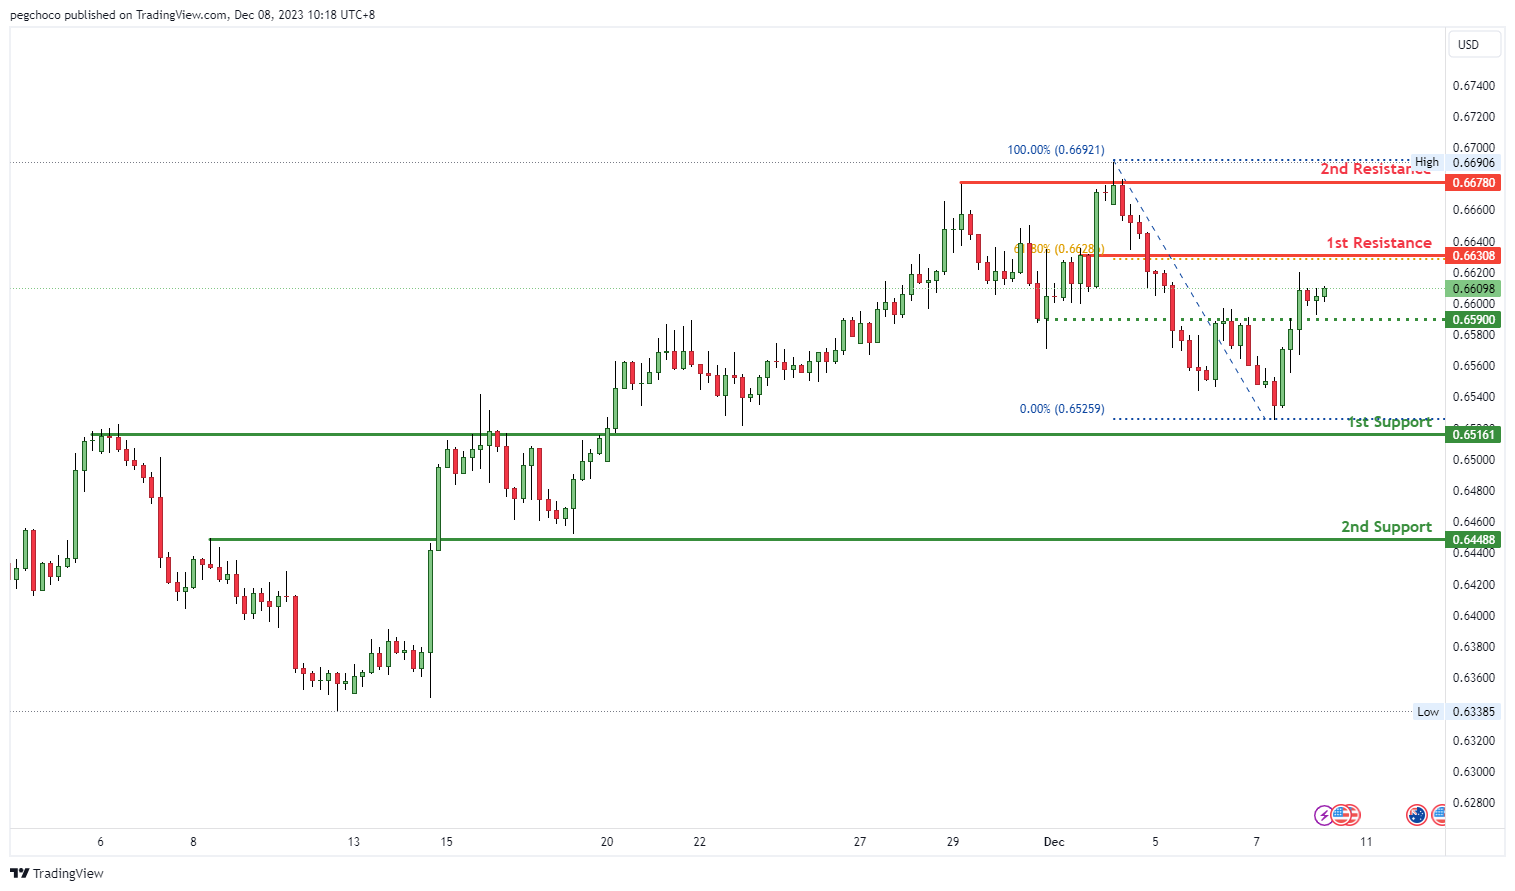
The AUD/USD chart currently exhibits a bearish overall momentum, and there’s potential for a bearish reaction off the 1st resistance level with a subsequent drop towards the 1st support.
The 1st support at 0.6516 is categorized as a pullback support, indicating it could be a significant level where buying interest may emerge, potentially providing support for the AUD/USD pair.
The 2nd support at 0.6448 is also identified as a pullback support, reinforcing the significance of this support level as a potential area where buyers might become active.
On the resistance side, the 1st resistance at 0.6630 is noted as a pullback resistance and is associated with the 61.80% Fibonacci Retracement level. This suggests it as a substantial barrier where selling interest could intensify, potentially leading to a bearish reaction.
The 2nd resistance at 0.6678 is categorized as a multi-swing high resistance, indicating another level where selling pressure may increase.
Additionally, there is an intermediate support at 0.6590, categorized as an overlap support, suggesting it as a level where buyers could also provide support.
NZD/USD
The NZD/USD chart currently has a bearish overall momentum, and there’s potential for a bearish reaction off the 1st resistance level with a subsequent drop towards the 1st support.
The 1st support at 0.6130 is categorized as an overlap support, indicating that it could be a significant level where buying interest may emerge, potentially providing support for the NZD/USD pair.
The 2nd support at 0.6066 is also identified as an overlap support, reinforcing the significance of this support level as a potential area where buyers might become active.
On the resistance side, the 1st resistance at 0.6191 is noted as an overlap resistance and is also associated with the 61.80% Fibonacci Retracement level. This suggests it as a substantial barrier where selling interest could intensify, potentially leading to a bearish reaction.
The 2nd resistance at 0.6222 is categorized as a swing high resistance, indicating another level where selling pressure may increase.

DJ30:
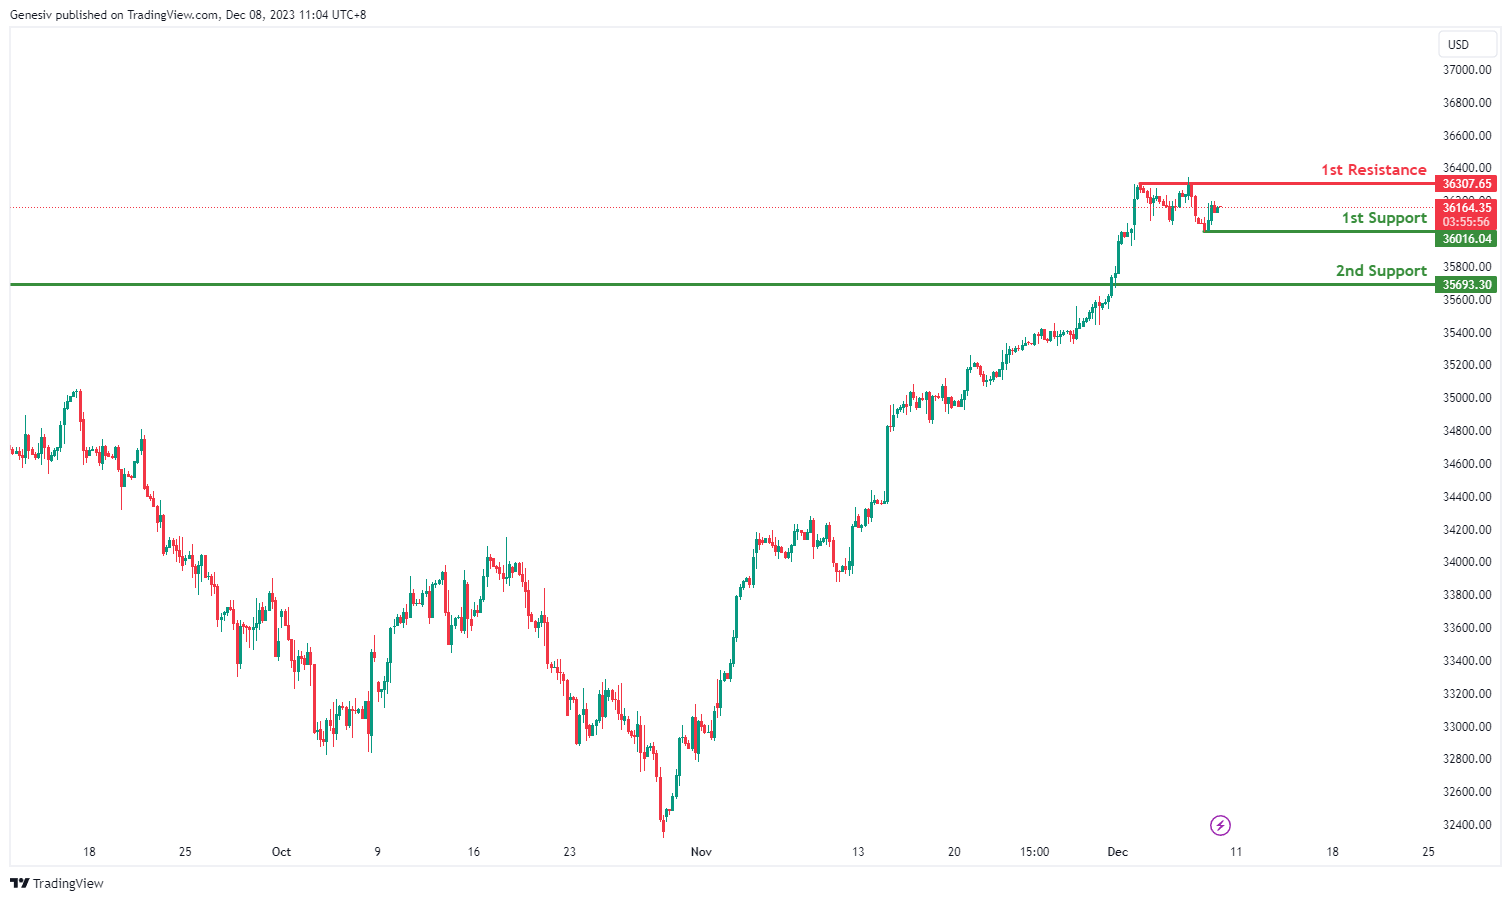
The DJ30 shows a neutral overall momentum, indicating a lack of a clear bullish or bearish trend. The potential price movement suggests a scenario in which the price could fluctuate between the first resistance and the first support levels. Overall Momentum: Neutral
1st Support at 36016.04: This level is identified as a swing low support, suggesting historical significance as a level where the price has found support in the past.
2nd Support at 35693.30: The second support is described as a pullback support, indicating a level where buyers might show interest, potentially stabilizing the price.
1st Resistance at 36307.65: This level is recognized as a swing high resistance, representing a historical point where the price has faced obstacles and potential reversals.
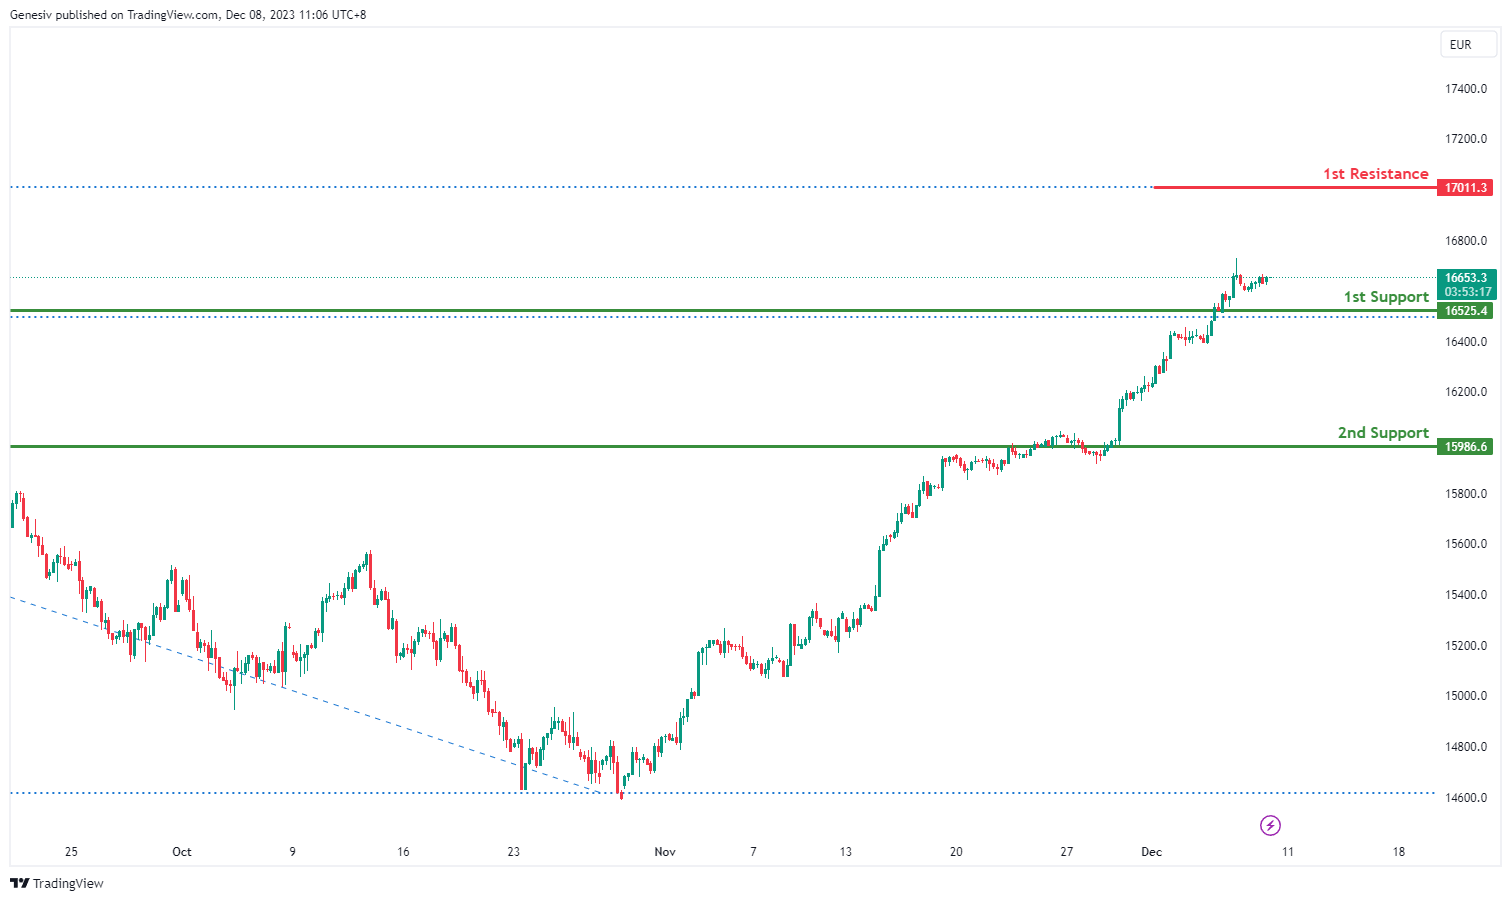
GER40:
The GER40 indicates a llish overall momentum, suggesting a potential continuation towards the first resistance.
1st Support at 16524.4: This level is identified as a pullback support, indicating a potential area where buying interest might emerge, contributing to price stabilization.
2nd Support at 15986.6: The second support is also described as a pullback support, reinforcing the notion that buyers could be interested in this level, potentially providing strong support.
1st Resistance at 17009.4: The first resistance is noted as being at the 127.20% Fibonacci Extension level, signifying a potential barrier where the price might face selling pressure or a reversal within its bullish trend.
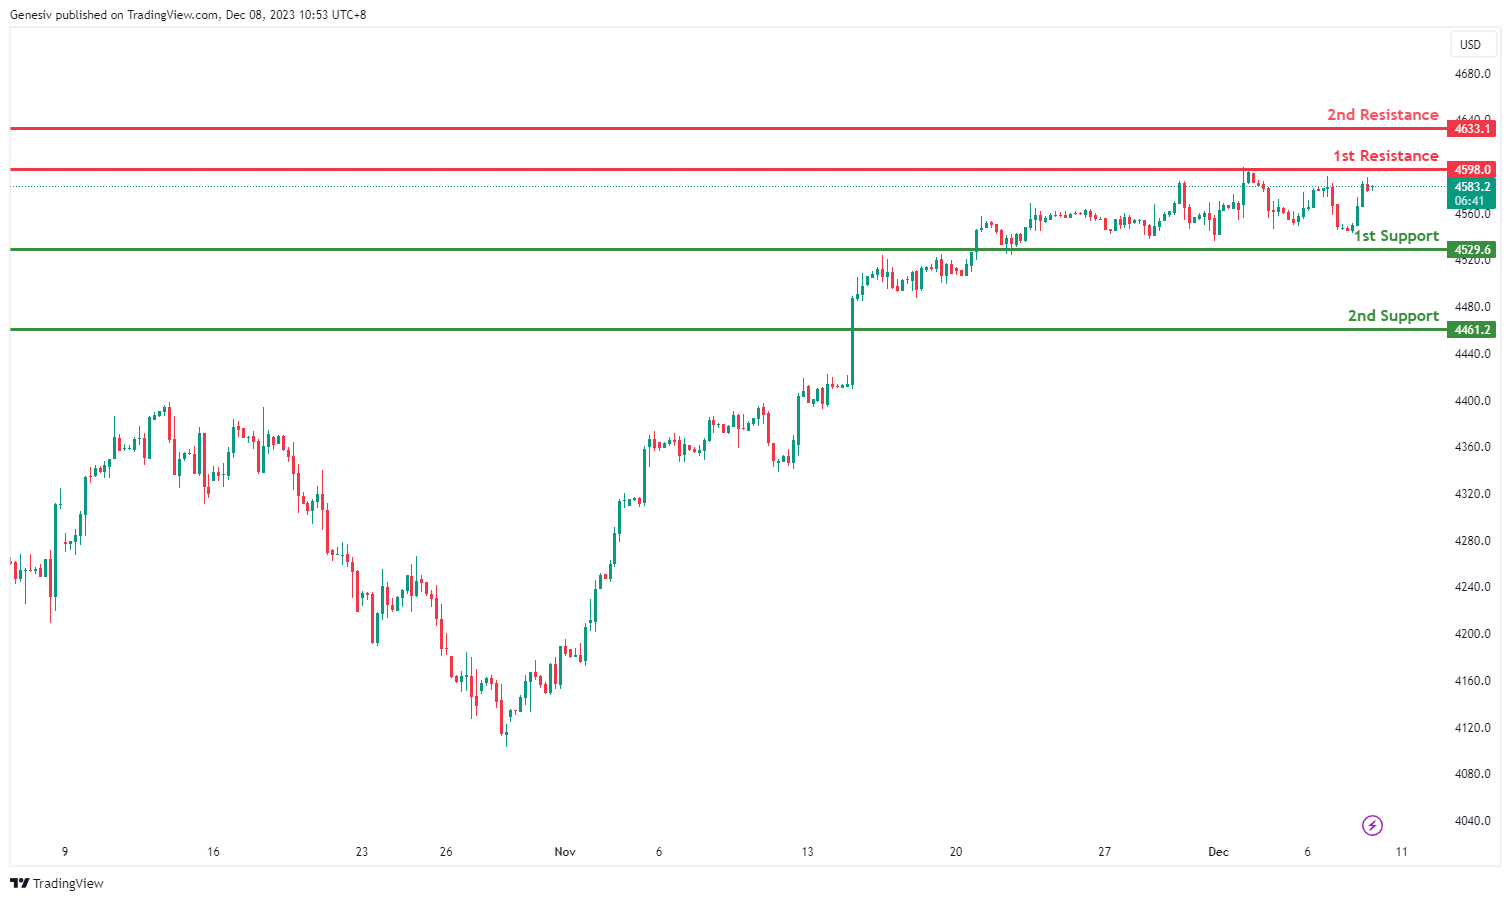
`US500:
The chart of US500 indicates a bullish overall momentum, suggesting a potential continuation towards the first resistance.
1st Support at 4529.6: This level is identified as an overlap support, indicating historical significance as a level where the price has found support in the past.
2nd Support at 4461.2: The second support is described as a pullback support, suggesting a level where buyers might show interest, potentially leading to price stabilization.
1st Resistance at 4598.0: The first resistance is recognized as a multi-swing high resistance, signifying a historical point where the price faced obstacles and potential reversals in its upward movement.
2nd Resistance at 4633.1: The second resistance is noted as a pullback resistance, indicating a level where selling interest might be observed, potentially acting as a hurdle to further bullish movement.
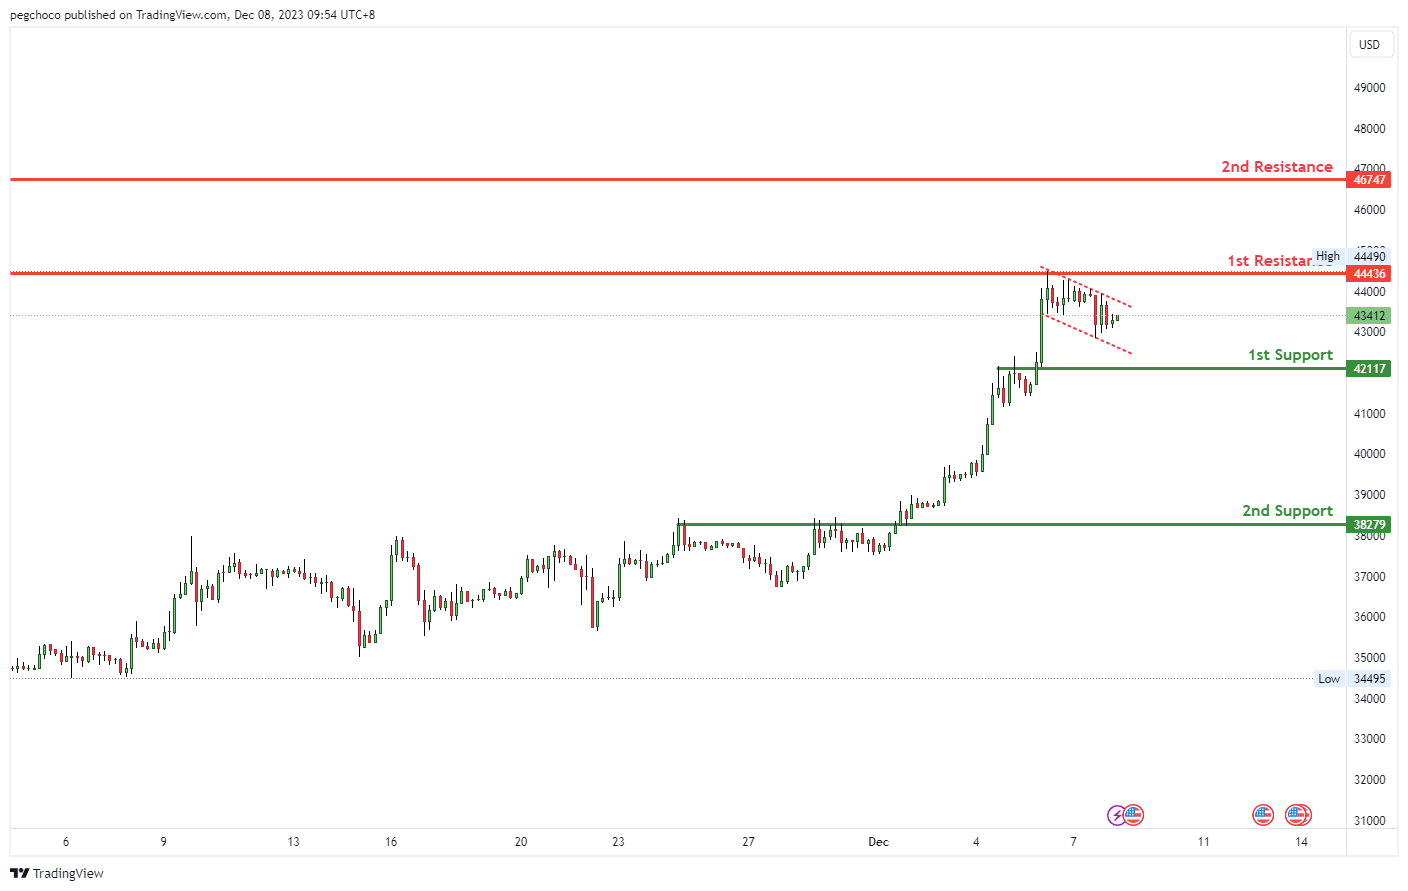
BTC/USD:
The BTC/USD chart currently exhibits a bullish overall momentum, and there’s potential for a bullish bounce off the 1st support level, signaling a potential upward movement towards the 1st resistance.
The 1st support at 42117 is categorized as an overlap support, indicating that it could be a significant level where buying interest may emerge, potentially providing support for the BTC/USD pair.
Further reinforcing this potential bullish scenario, there is a 2nd support at 38283, also identified as an overlap support. This additional support level adds to the significance of the potential bounce.
On the resistance side, the 1st resistance at 44436 is noted as a pullback resistance. This suggests that it’s a substantial barrier where selling interest could intensify, potentially causing a temporary pause in the bullish movement.
The 2nd resistance at 46747 is categorized as an overlap resistance, further indicating its potential significance as a level where selling pressure may increase.
Additionally, a “Bullish Flag” pattern is observed. Bullish flag patterns are common in equities that are in a sustained rally and are regarded as strong continuation patterns. This pattern often indicates that after a brief consolidation or pullback (the “flag”), there’s a potential for the previous upward trend to continue.
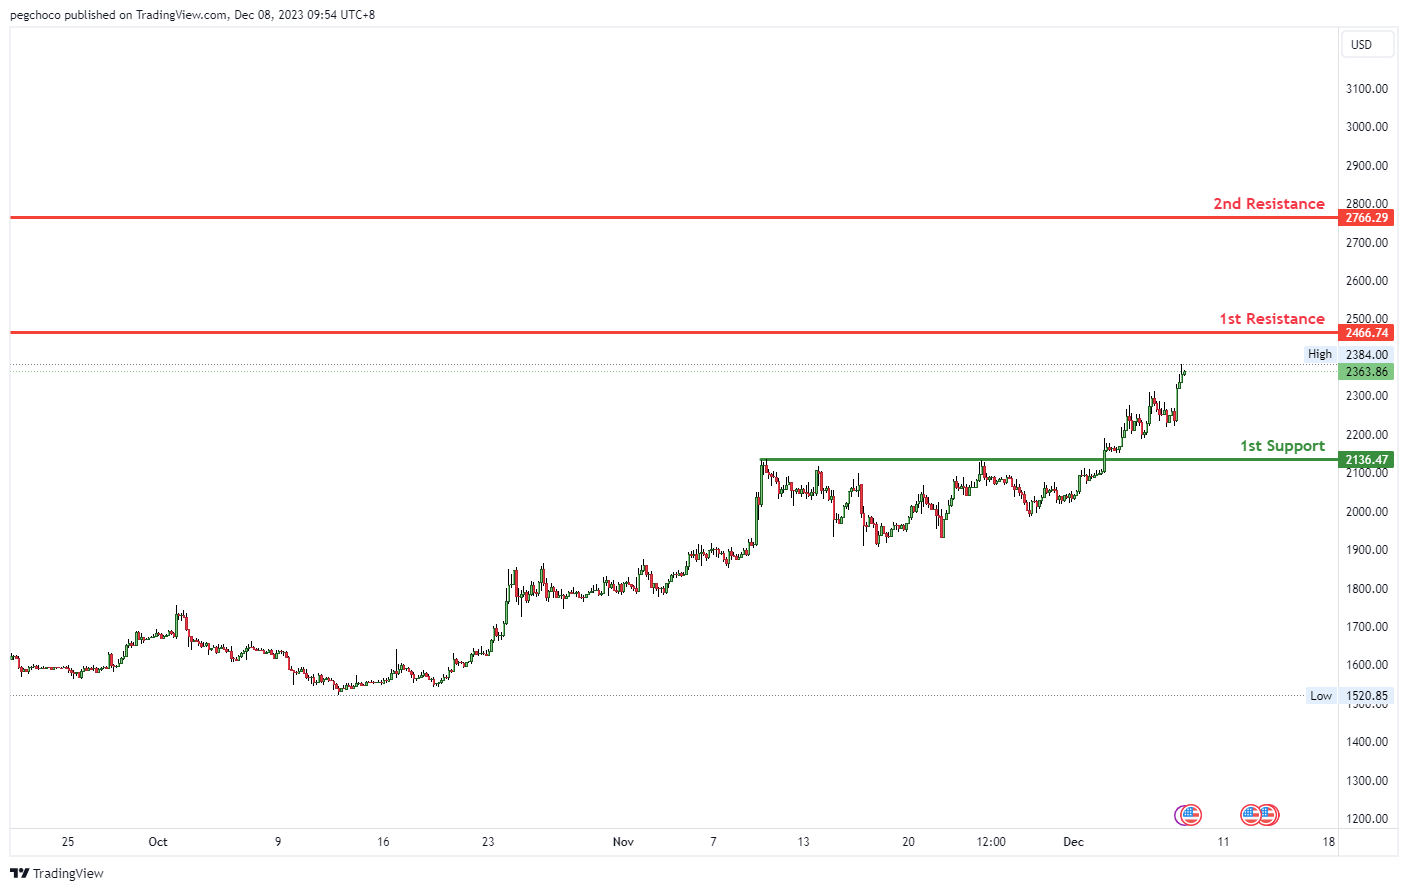
ETH/USD:
The ETH/USD chart currently exhibits a bullish overall momentum, and there’s potential for a bullish continuation towards the 1st resistance level.
The 1st support at 2136.47 is categorized as a pullback support. This level might act as a significant support zone where buying interest may emerge, potentially providing support for the Ethereum/US Dollar pair.
On the resistance side, the 1st resistance at 2466.74 is identified as an overlap resistance. This suggests that it’s a substantial barrier where selling interest could intensify, potentially limiting further upward movements.
The 2nd resistance at 3766.29 is categorized as a pullback resistance, indicating another level where selling pressure may increase.
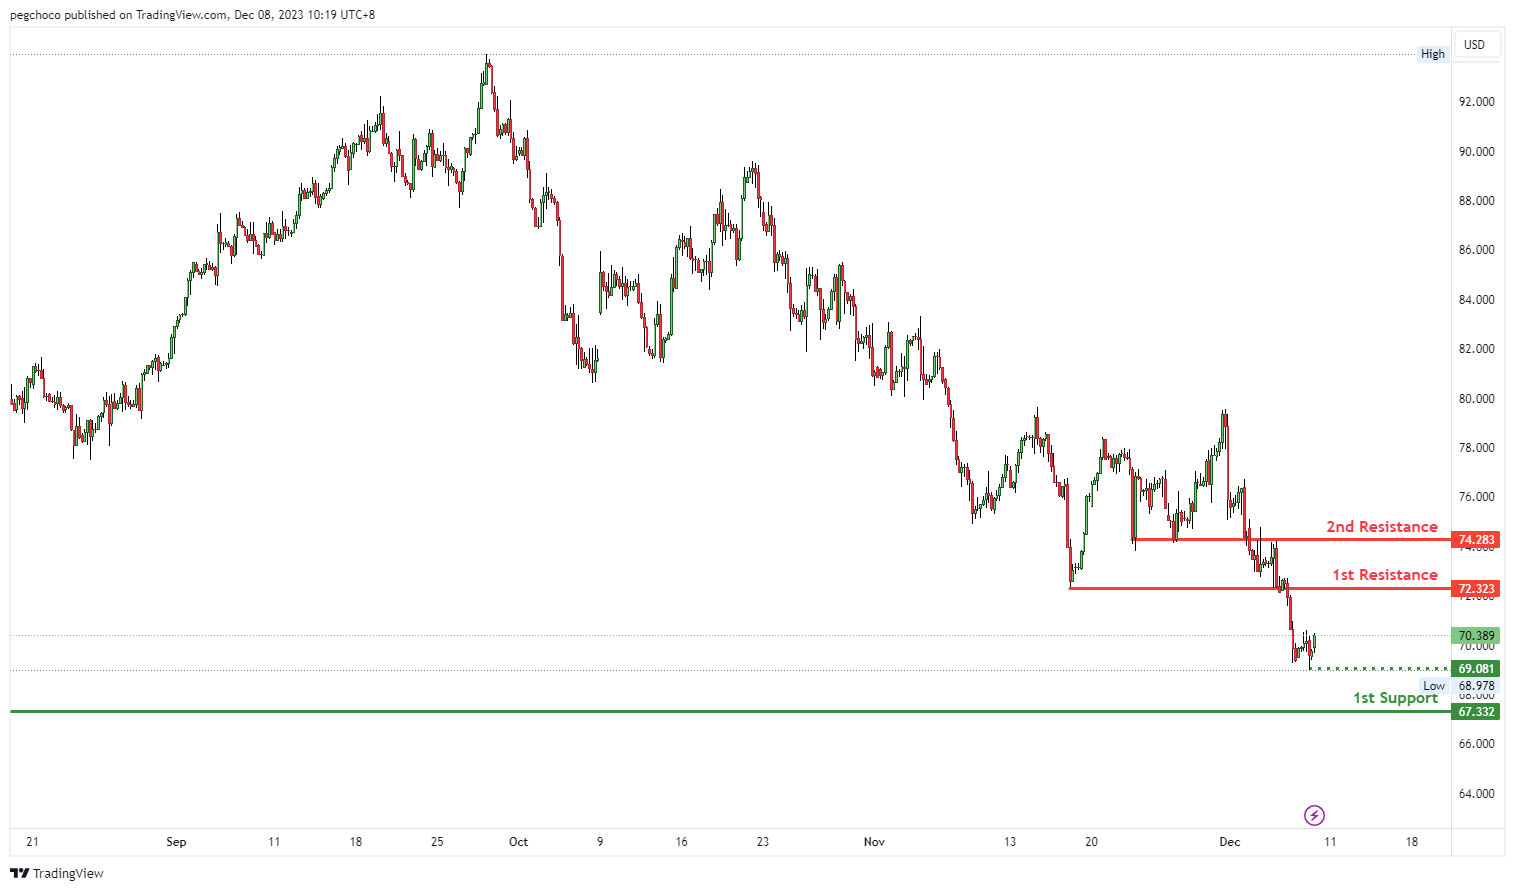
WTI/USD:
The WTI chart currently has a bearish overall momentum, and there’s potential for a bearish reaction off the 1st resistance level with a subsequent drop towards the 1st support.
The 1st support at 67.33 is categorized as a multi-swing low support, indicating that it could be a significant level where buying interest may emerge, potentially providing support for the WTI price.
Intermediate support is noted at 69.08, which is identified as a swing low support. This adds to the significance of potential support in this area.
On the resistance side, the 1st resistance at 72.32 is categorized as a pullback resistance, implying that it’s a substantial barrier where selling interest could intensify, potentially leading to a bearish reaction.
The 2nd resistance at 74.28 is identified as an overlap resistance, indicating another level where selling pressure may increase.
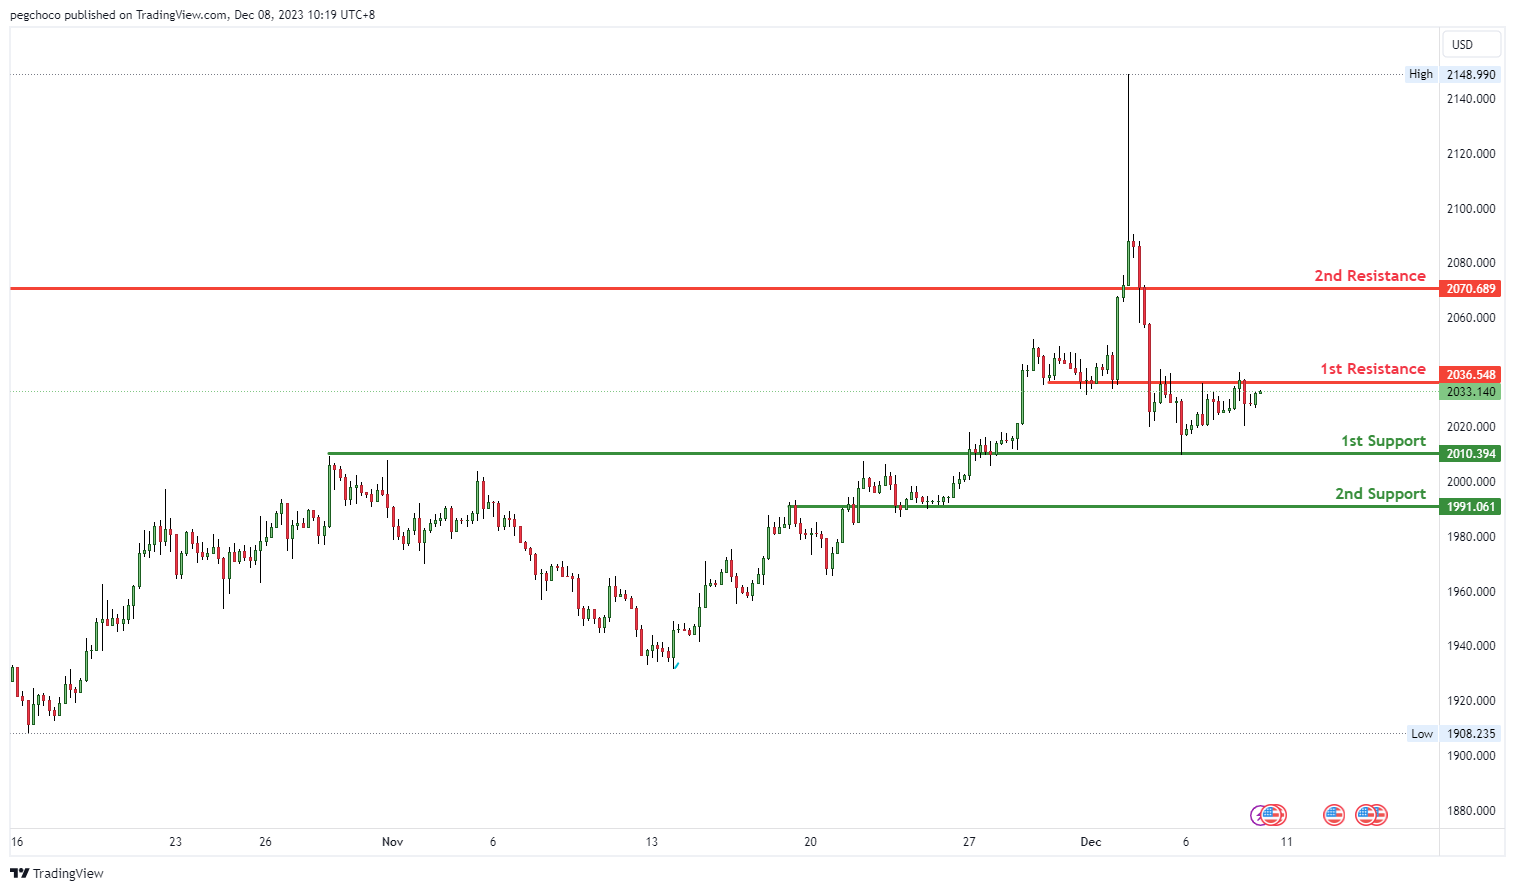
XAU/USD (GOLD):
The XAU/USD chart currently exhibits a neutral overall momentum, suggesting the potential for price to fluctuate between the 1st resistance and 1st support levels.
The 1st support at 2010.39 is categorized as an overlap support. Overlap supports are historical levels where buying interest may emerge, potentially providing support for the XAU/USD pair.
Further down, there is a 2nd support at 1991.06, also identified as an overlap support. This reinforces the significance of this support level, suggesting it as a potential area where buyers might become active.
On the resistance side, the 1st resistance at 2036.54 is noted as an overlap resistance, implying that it’s a substantial barrier where selling interest could intensify, potentially limiting upward movements.
The 2nd resistance at 2070.68 is categorized as a pullback resistance, further indicating its potential significance as a level where selling pressure may increase.
The accuracy, completeness and timeliness of the information contained on this site cannot be guaranteed. IC Markets does not warranty, guarantee or make any representations, or assume any liability regarding financial results based on the use of the information in the site.
News, views, opinions, recommendations and other information obtained from sources outside of www.icmarkets.com, used in this site are believed to be reliable, but we cannot guarantee their accuracy or completeness. All such information is subject to change at any time without notice. IC Markets assumes no responsibility for the content of any linked site.
The fact that such links may exist does not indicate approval or endorsement of any material contained on any linked site. IC Markets is not liable for any harm caused by the transmission, through accessing the services or information on this site, of a computer virus, or other computer code or programming device that might be used to access, delete, damage, disable, disrupt or otherwise impede in any manner, the operation of the site or of any user’s software, hardware, data or property.


