
A note on lower timeframe confirming price action…
Waiting for lower timeframe confirmation is our main tool to confirm strength within higher timeframe zones, and has really been the key to our trading success. It takes a little time to understand the subtle nuances, however, as each trade is never the same, but once you master the rhythm so to speak, you will be saved from countless unnecessary losing trades. The following is a list of what we look for:
- A break/retest of supply or demand dependent on which way you’re trading.
- A trendline break/retest.
- Buying/selling tails – essentially we look for a cluster of very obvious spikes off of lower timeframe support and resistance levels within the higher timeframe zone.
- Candlestick patterns. We tend to only stick with pin bars and engulfing bars as these have proven to be the most effective.
For us, lower timeframe confirmation starts on the M15 and finishes up on the H1, since most of our higher timeframe areas begin with the H4. Stops usually placed 5-10 pips beyond your confirming structures.
EUR/USD:
Using a top-down approach this morning, we can see that the single currency remains housed within weekly supply drawn from 1.1533-1.1278. Despite seeing little selling interest here over the past three weeks, this area has managed to hold price action lower since May 2015 on five occasions, so the bulls still likely have their work cut out for them if they want to push higher.
Looking down to the daily chart, a collection of indecision candles have recently printed between demand seen at 1.1385-1.1332 and a Quasimodo resistance level coming in at 1.1460. A break below the current demand likely opens the trapdoor to a sell-off down towards demand penciled in at 1.1143-1.1187.
Moving across to the H4 chart, supply at 1.1451-1.1425 (sits within the aforementioned weekly supply and just below the daily Quasimodo resistance) and the broken Quasimodo support line at 1.1338 (positioned within the extremes of the above said daily demand) has contained price since the beginning of April.
Given the above points, one could look to trade the edges of the current H4 consolidation today. Nevertheless, we would recommend only doing so with lower timeframe confirmation since fakeouts are common within ranging environments such as this. The more preferred method, however, at least for us, would be to wait for the H4 candles to close below the current H4 range demand, and the 1.1300 line. This would place us in a favorable position to look for shorts on any retest seen to the underside of 1.1300, targeting H4 demand at 1.1168-1.1190 (see black arrows), which sits on top of daily demand mentioned above at 1.1143-1.1187.
Alongside this, let’s also keep in mind that by shorting 1.1300, we’d be trading in-line with weekly flow (see above). Furthermore, the close below 1.1300 would very likely force daily action to close beneath the current daily demand, thus opening the path south towards daily demand discussed above at 1.1143-1.1187.
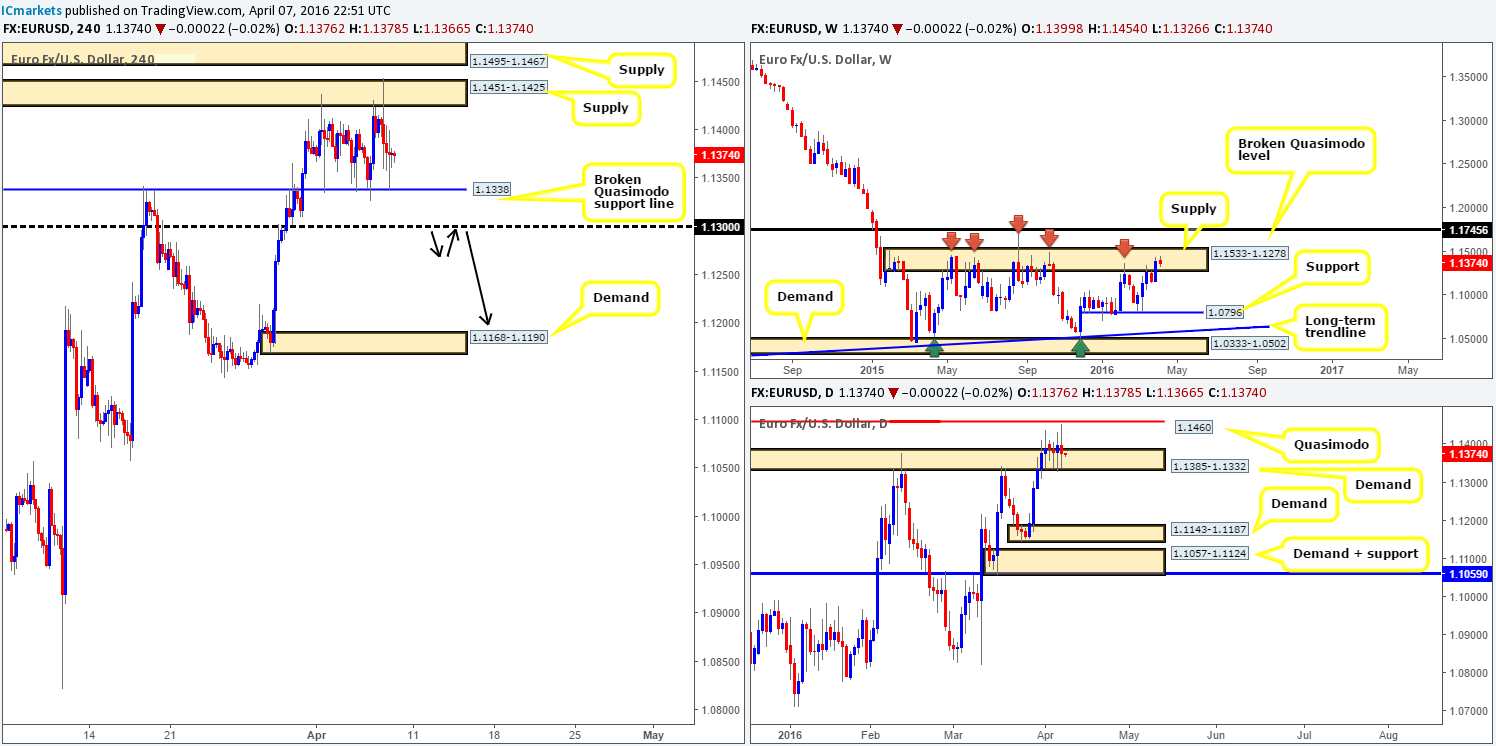
Levels to watch/live orders:
- Buys: 1.1338 [Tentative – confirmation required] (Stop loss: dependent on where one confirms this level).
- Sells: 1.1451-1.1425 [Tentative – confirmation required] (Stop loss: dependent on where one confirms this area). Watch for price to consume 1.1300 and look to trade any retest seen thereafter (lower timeframe confirmation required).
GBP/USD:
The British Pound took yet another hit to the mid-section yesterday losing a further 65 pips of value, off the back of Brexit fears. As can be seen from the H4 chart, this saw candle action erase bids from the 1.4100 handle and head lower to test weekly support painted in at 1.4051. This weekly support – coupled with price also crossing swords with a daily demand at 1.3843-1.4036 that boasts a daily AB-CD bullish approach (see black arrows) suggests a bounce north could be seen.
We say ‘bounce’ here for a reason! With Brexit fears plaguing this pair and the trend predominantly pointing south with little attempt at a bullish recovery, taking long positions in this market medium-term might not be the best path to take. Moreover, for traders looking to enter long from the current weekly support, bear in mind that once the European session kicks in today, price could potentially fake lower to the large psychological support 1.4000 before we see Cable’s next attempt to recover, as we saw happen on Wednesday.
Personally, we’re not confident trading this market today and believe the best position to take is on the sidelines.
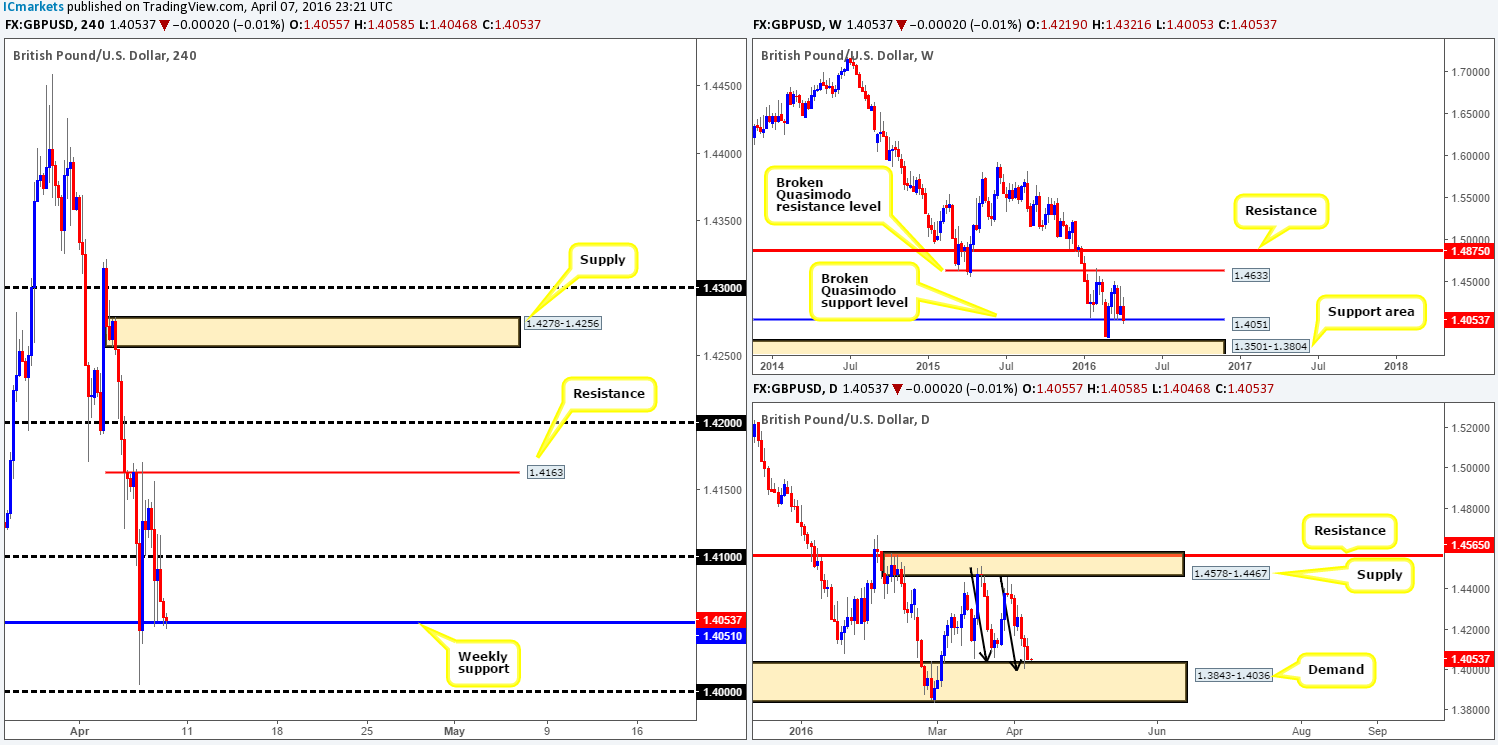
Levels to watch/live orders:
- Buys: Flat (Stop loss: N/A).
- Sells: Flat (Stop loss: N/A).
AUD/USD:
Early on in European trading yesterday the commodity currency snowballed south, taking out both the 0.7600 line and H4 demand at 0.7535-0.7551 (now acting supply), before stabilizing for the day around the 0.7500 handle. Entering long from this number today is not really something we’d stamp a high-probability trade. Yes, we do see price trading within daily demand at 0.7477-0.7537, but considering that the Aussie just sold off from a major weekly resistance line at 0.7604, and near-term H4 supply lurks overhead at 0.7535-0.7551, longs are not an option for now.
In the event that 0.7500 caves in today, we would be interested in looking for shorts on any retest seen at this number, targeting H4 demand at 0.7414-0.7435 as per the green arrows (positioned just within weekly demand at 0.7438-0.7315 – the next weekly downside target). Due to price trading within daily demand at the moment, nevertheless, we would require strong lower timeframe confirmation (for confirmation techniques, see the top of this report) before looking to sell. Should our analysis be correct and we manage to pin down a short setup, we’ll be looking to end the week with our stop at breakeven since we rarely leave positions open over the weekend.
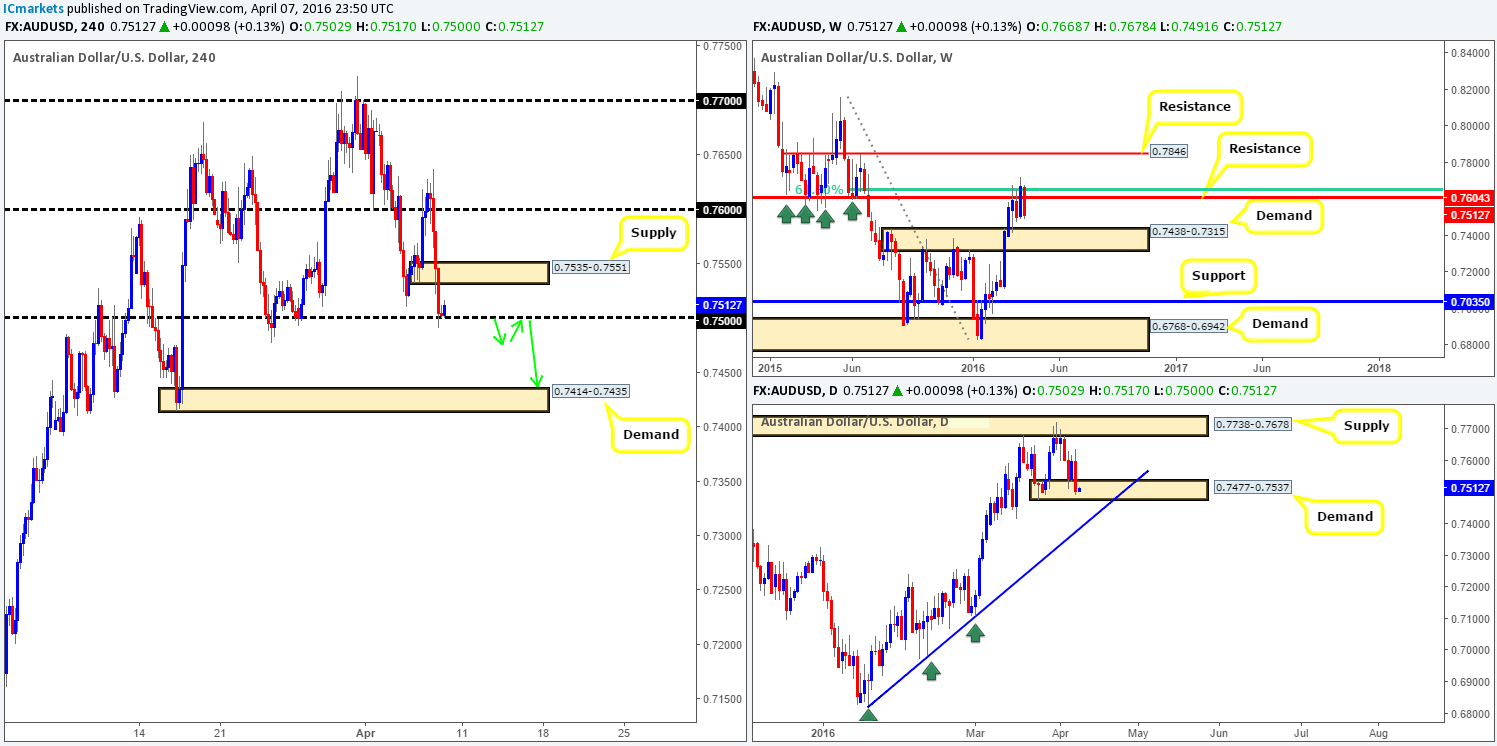
Levels to watch/live orders:
- Buys: Flat (Stop loss: N/A).
- Sells: Watch for price to consume 0.7500 and look to trade any retest seen thereafter (lower timeframe confirmation required).
USD/JPY:
Reporting from the weekly chart this morning, following a strong push seen below support at 110.09 price recently came within touching distance of connecting with demand seen at 105.19-107.54. Along the same vein, daily action has also collided with demand, albeit a smaller zone, but still a valid base which can be found at 107.60-108.35. Should the bulls defend this area, we see little overhead resistance until around the 110.96 region.
In light of this pair’s recent selling, we can also see that the H4 chart crossed swords with both a psychological number 108.00 and a H4 support line directly above it at 108.25. Now, given that price has already begun to show bullish intent from here, would we consider this a stable platform in which to look for longs today? Well, considering where price is positioned on the higher-timeframe picture (see above) right now, we would. Be that as it may, we’d need to see price pullback to the 108.25/108.00 region (green zone – green arrows) before looking for a lower timeframe entry. The reason for requiring lower timeframe confirmation here, is simply because price could still drive lower to connect with the top-side of weekly demand at 107.54 (remember, price has yet to hit the base) – essentially the mid-level hurdle 107.50, so do keep an eye on this number for confirmed longs as well today!

Levels to watch/live orders:
- Buys: 108.00/108.25 [Tentative – confirmation required] (Stop loss: dependent on where one confirms this area). 107.50 [Tentative – confirmation required] (Stop loss: dependent on where one confirms this level).
- Sells: Flat (Stop loss: N/A).
USD/CAD:
Going into yesterday’s European session, price action found support just ahead of the large number 1.3000 as Oil prices took a tumble from a H4 resistance area at 38.88/38.16. This, as you can see, resulted in the Loonie breaking through 1.3100 and jabbing into H4 supply at 1.3186-1.3160 by the day’s end.
Trading short from this current area of H4 supply is not really something we’d get excited about, due to there being little higher-timeframe convergence. The H4 supply directly above at 1.3284-1.3254 on the other hand is a place we would consider shorting, since it fuses with daily supply coming in at 1.3405-1.3259. However, we’d still be hesitant to place a pending sell order here seeing as how there is a strong possibility that price will fake above the H4 supply to tag in offers around the 1.3300 handle.
In regard to longs, the 1.3000 line is somewhere we may see a bounce. The real line we’re interested in, however, is 1.2900 as it also represents a daily Quasimodo support, and also has a H4 Quasimodo support hovering just above it at 1.2911.

Levels to watch/live orders:
- Buys: 1.3000 [Tentative – confirmation required] (Stop loss: dependent on where one confirms this level). 1.2900 region [Tentative – confirmation required] (Stop loss: dependent on where one confirms this area).
- Sells: 1.3284-1.3254 [Tentative – confirmation required] (Stop loss: dependent on where one confirms this area).
USD/CHF:
Beginning with a look at the weekly chart this morning, the buyers and sellers can be seen battling for position around a weekly Quasimodo support line at 0.9526, which is surrounded by demand coming in at 0.9476-0.9608. Scrolling a page lower to the daily chart, we can also see downside momentum diminishing around the weekly Quasimodo support. This – coupled with the fact that the weekly level converges perfectly with a daily AB=CD bullish completion point, makes this a very interesting zone for longs.
Looking down to the H4 chart, price just missed connecting with demand found at 0.9493-0.9517 yesterday, and instead found support around the mid-level number 0.9550. Ideally, we were looking for price to hit the H4 demand before buying this market! One could, nonetheless, buy at current prices given the three buying tails printed on the H4, targeting 0.9600 as your first take-profit target, followed by daily resistance at 0.9660. We, however, will hold fire and wait to see if price fakes lower to our H4 demand zone and look to enter long from 0.9517 with our stop below at 0.9490 – this, to us, is the best possible price!
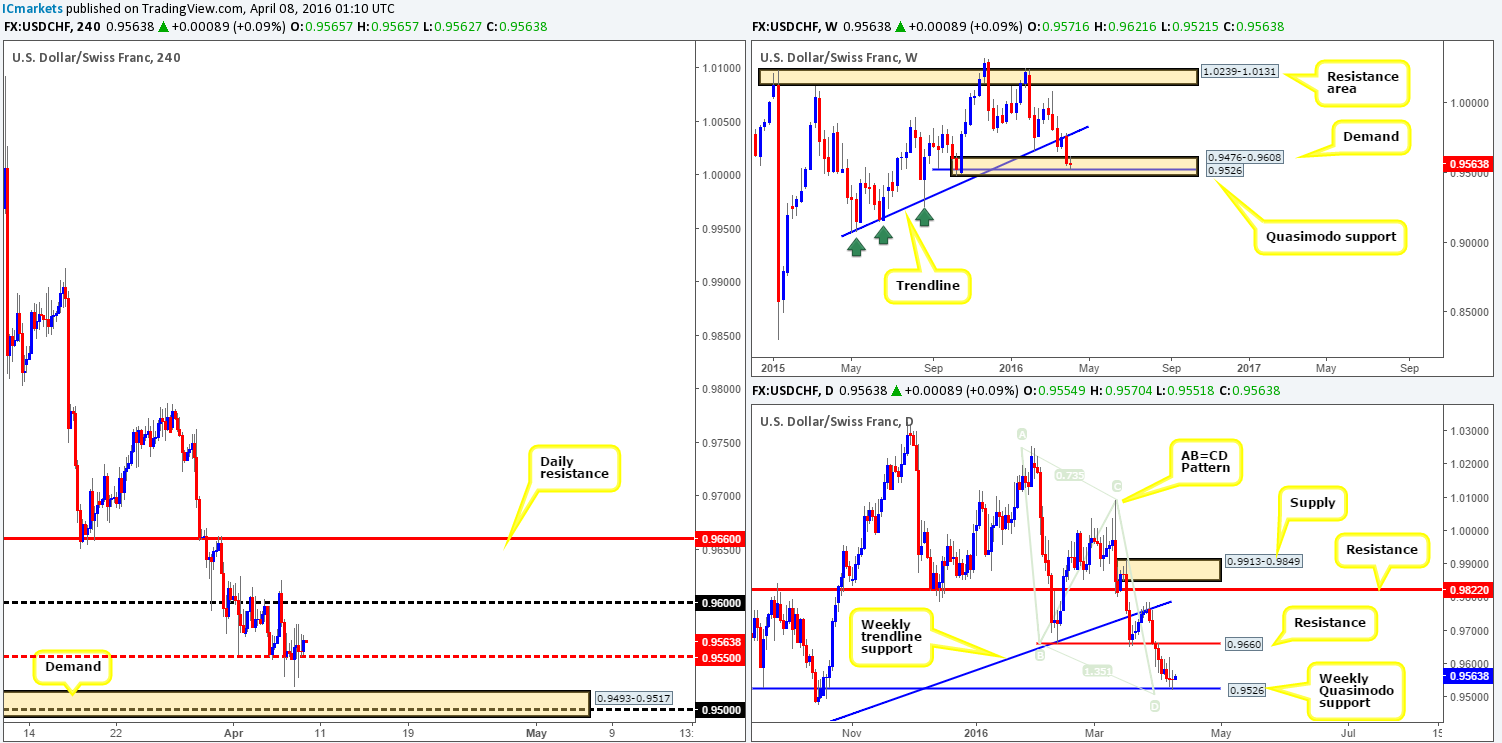
Levels to watch/live orders:
- Buys: 0.9517 (Stop loss: 0.9490).
- Sells: Flat (Stop loss: N/A).
DOW 30:
Starting from the top this morning, weekly activity shows that the DOW recently found active sellers around the 17898 region – a clear area of resistance (pink circle). This has forced the current weekly candle to break back below the trendline resistance extended from the high18365, which could suggest this may be a fakeout to drive lower to support at 17135. Moving down to the daily chart, however, demand at 17396-17554 is now firmly in play and is, as you can see, the last obstacle to a move towards the above said weekly support. This is why it always pays to watch multiple timeframes!
Moving down one more level to the H4 shows price found support just ahead of demand coming in at 17396-17466 (positioned deep within the aforementioned daily demand) with price looking as though it’s now en-route to shake hands with the recently broken demand (now supply) at 17617-17582.
With the weekly selling off from resistance, we have absolutely no interest in buying this market for now. What we are interested in, nevertheless, is a close below the current H4 demand at 17396-17466. Here’s why:
- A close below the H4 demand would likely open the path south down to weekly support at 17135. The green arrow on the H4 chart points to a demand consumption tail at 17241 which has likely taken out the majority of buyers around the H4 demand seen marked with a pink circle at 17186-17228, potentially clearing the path down to demand at 17117-17141 (sits on top of weekly support).
- Following a close below the H4 demand, one could look to trade short by selling any retest seen to the underside of the H4 demand as supply, as per the black arrows.
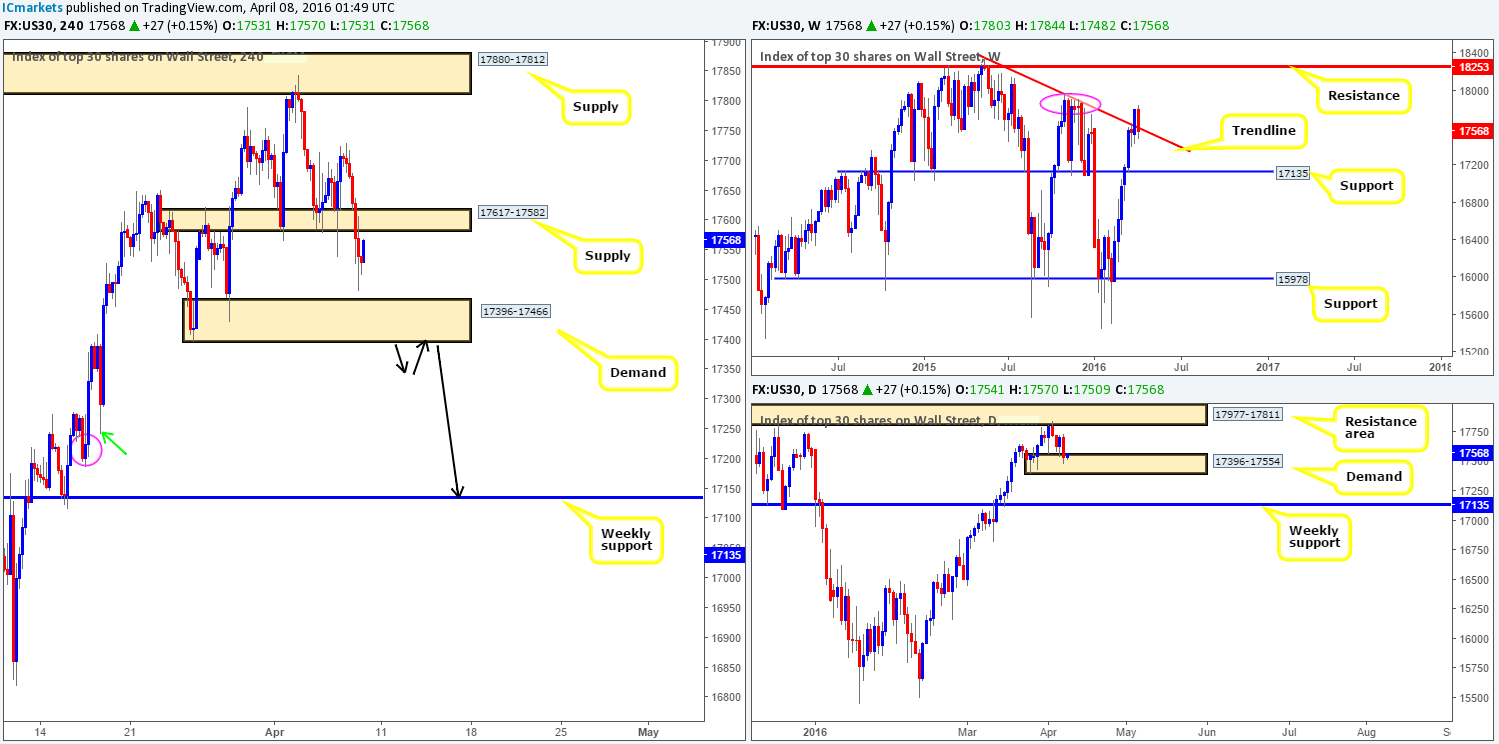
Levels to watch/live orders:
- Buys: Flat (Stop loss: N/A).
- Sells: Watch for price to consume 17396-17466 and look to trade any retest seen thereafter (lower timeframe confirmation required).
XAU/USD: (Gold)
Early on during yesterday’s sessions, Gold prices advanced north in a flight to safety as Equities took a hit. As can be seen from the H4 chart, upside momentum diminished going into the London open as price connected with supply chalked up at 1237.2-1243.9, which remains firm for the time being. In view of this H4 supply area being glued to the underside of a daily supply zone drawn from 1260.1-1243.4, there’s a good chance Gold may turn south today. While this may be true, we have to take into account that the weekly chart shows that the yellow metal is being bought from demand given at 1205.6-1181.2, and shows potential to continue driving north up to supply fixed at 1307.4-1280.0.
In light of the points made above, where do we go from here? Well, we try to only trade when all three timeframes we watch are trading in unison. However, seeing as this is not the case here, one could simply watch the lower timeframes (preferably no lower than the M15) for direction within the current H4 supply. For example, if one was to spot a close above an M30 supply zone with room seen to move higher, you could simply look to buy the pullback from an M30 support.
In regards to first targets, if one happens to pin down a long setup we’d be looking to take profits at 1256.2 – a H4 resistance. Conversely, should one manage to short this market, profits, at least for us, would be taken around the H4 demand at 1215.2-1218.6.
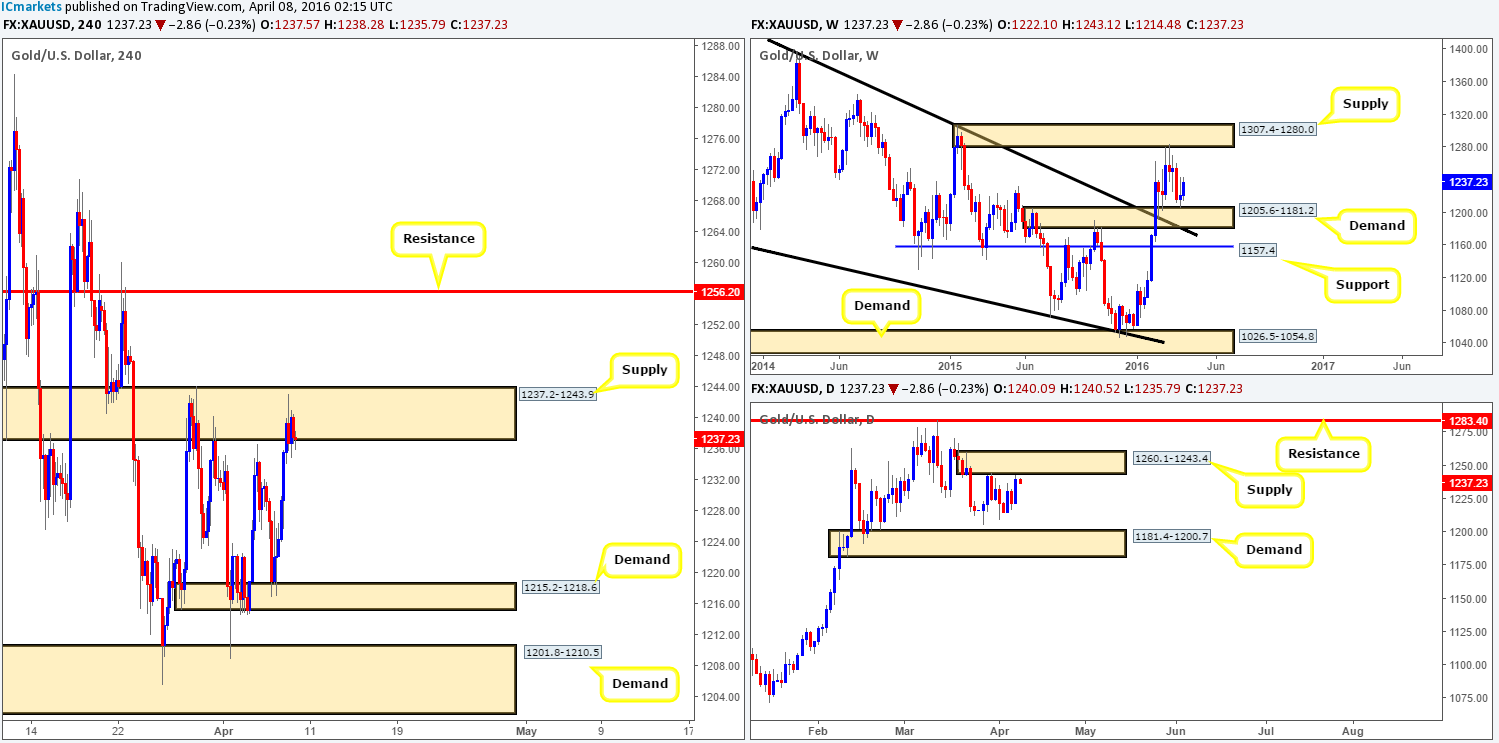
Levels to watch/live orders:
- Buys: 1237.2-1243.9 [Tentative – confirmation required] (Stop loss: dependent on where one confirms this area).
- Sells: 1237.2-1243.9 [Tentative – confirmation required] (Stop loss: dependent on where one confirms this area).


