
EUR/USD:
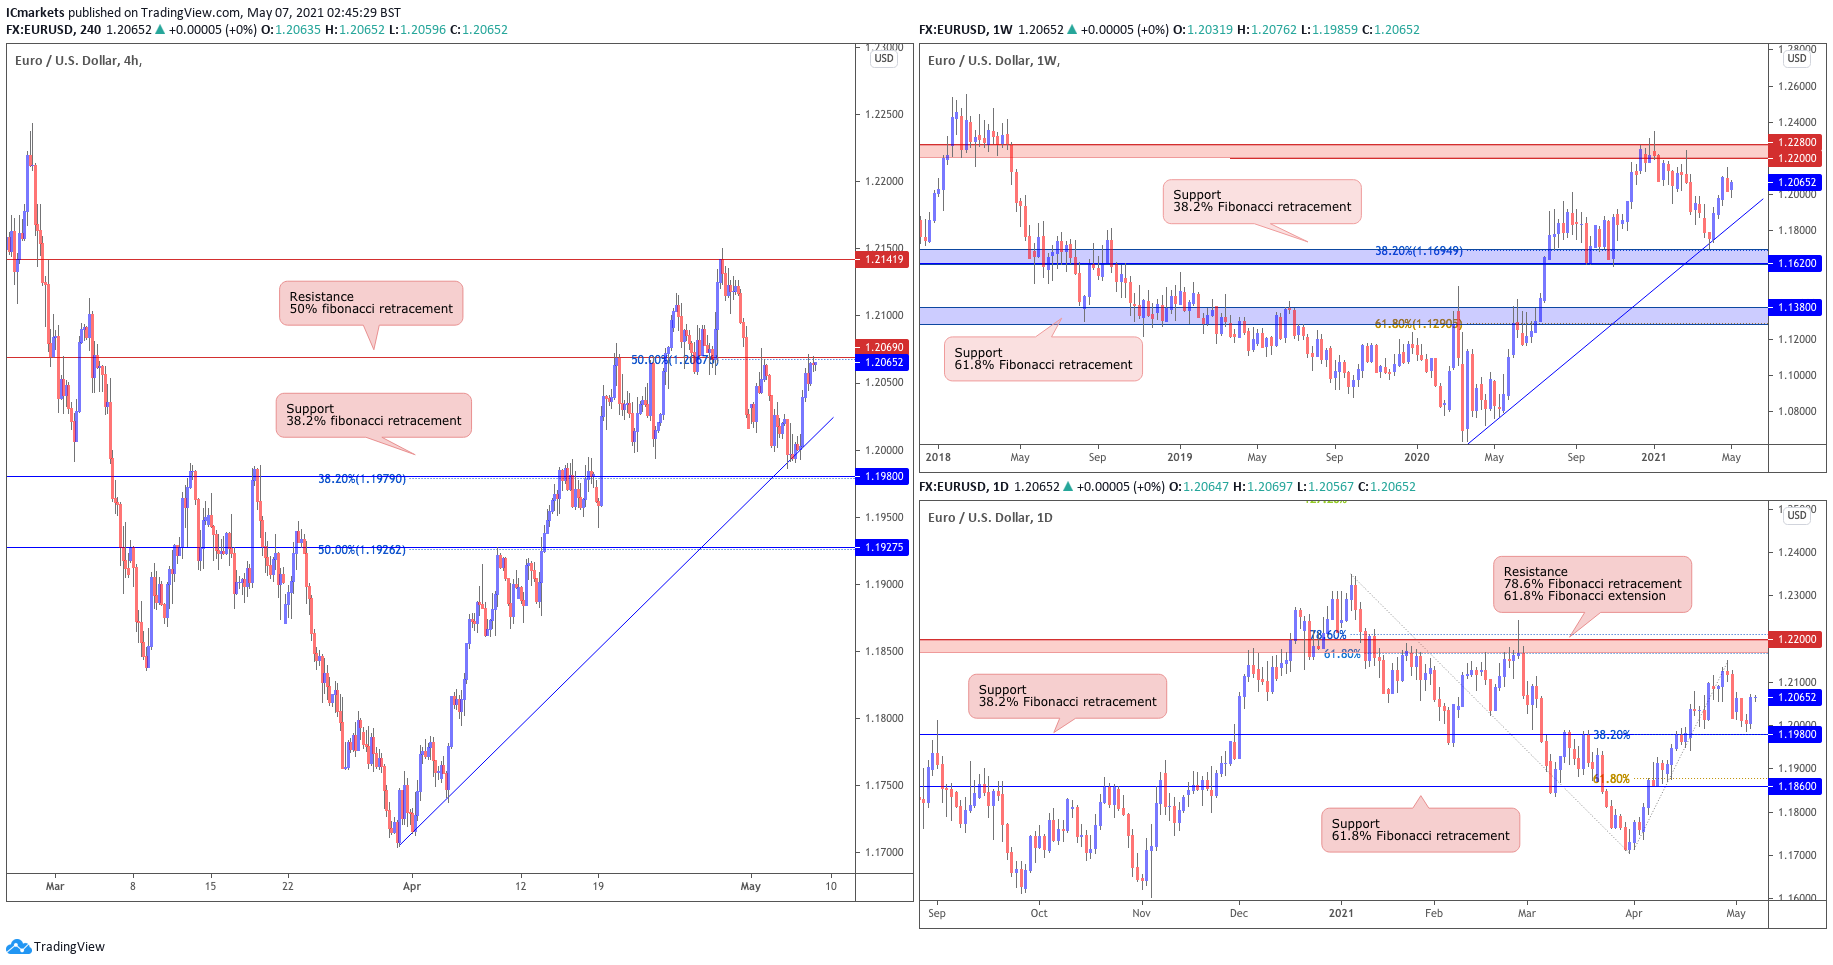
Looking at the weekly chart, we can see that prices are seeing further limited upside before it reaches our resistance area at 1.22000 – 1.22800. On the daily chart, prices are facing bullish pressure from our support level at 1.1980, in line with our graphical support level and 38.2% fibonacci retracement where we could see a bounce above this level.
On the H4 timeframe, prices are testing our first resistance level at 1.20690, in line with the 50% fibonacci retracement. Keeping in mind the view on the larger time frames, a break above our resistance level at 1.20690 could see a further upside to our next resistance target at 1.21419. Failure to hold above our support level at 1.19800 could see a swing towards our next support level at 1.19800.
Areas of consideration:
- 1.21419 resistance area found on H4 time frame
- 1.19800 support area found on H4 time frame
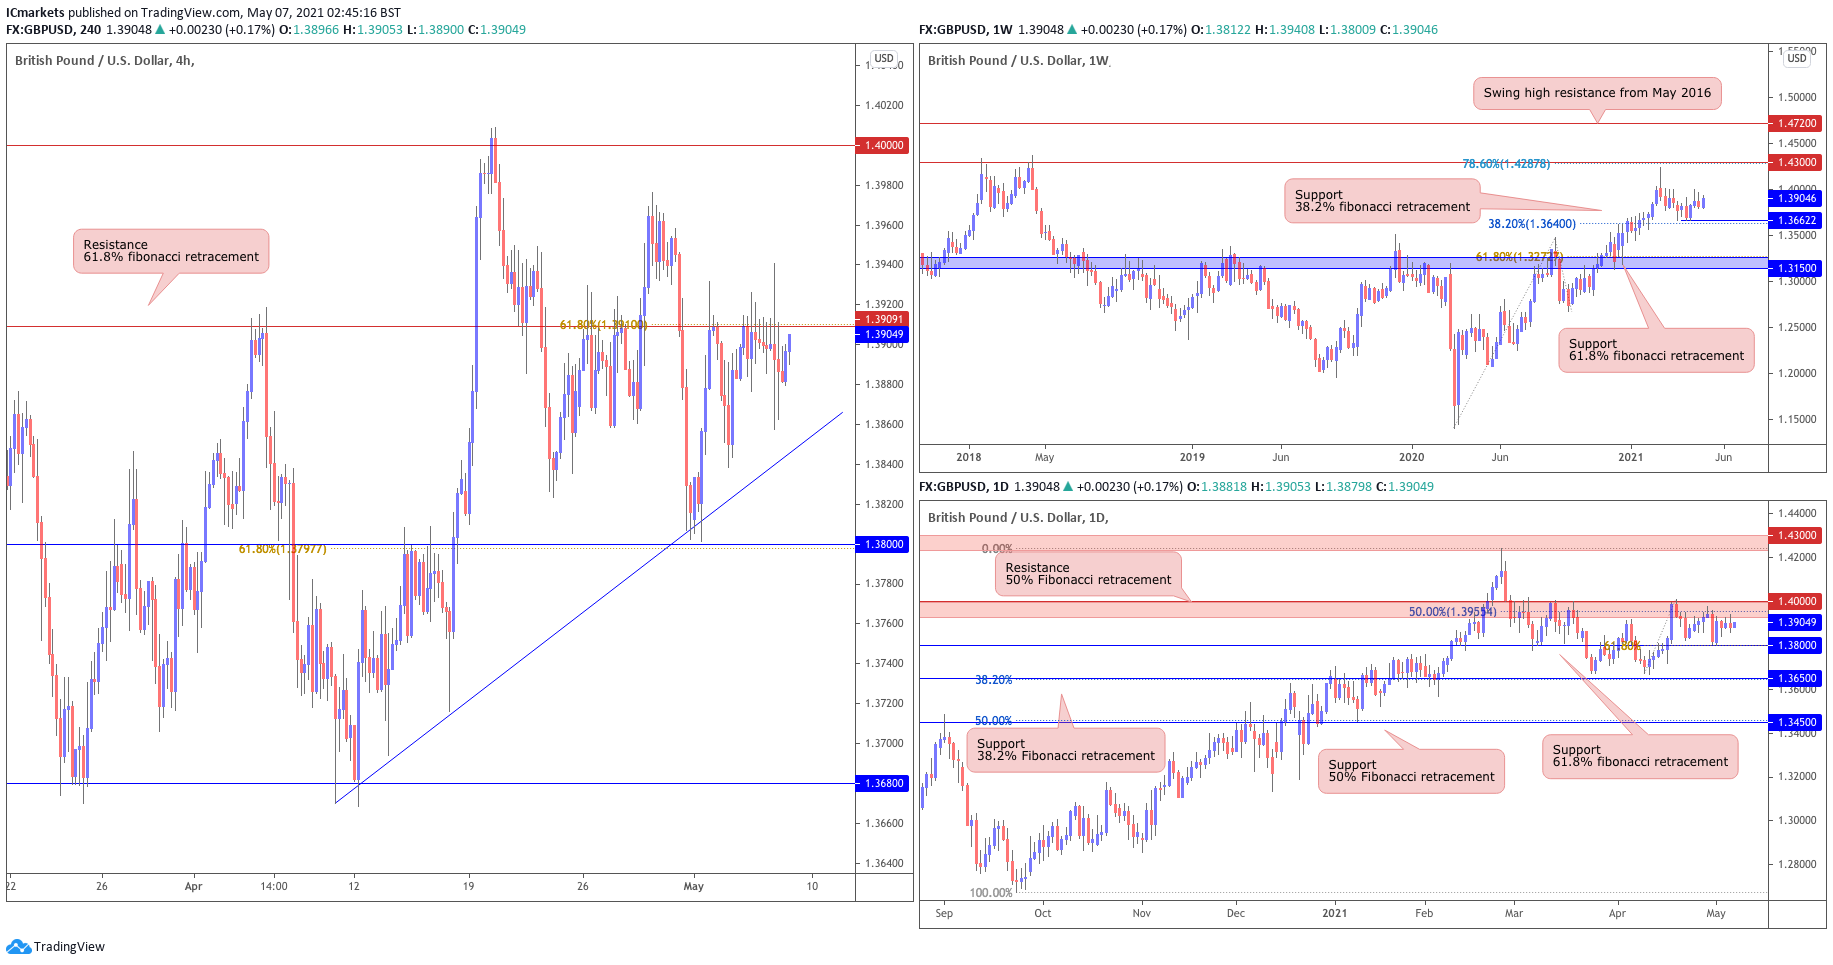
Looking at the weekly chart, we can see that prices are trading within our support and resistance levels at 1.43000 and 1.36622 respectively. On the daily time frame, prices are approaching our resistance level at 1.4000, in line with the 50% fibonacci retracement where we could see limited upside above our daily support level at 1.38000.
On the H4 timeframe, prices are testing its resistance at 1.39091, in line with the 61.8% fibonacci retracement where a break above this level could see a further upside to our next resistance target at 1.4000, in line with our resistance level found on the daily time frame. Failure to hold above our ascending trend line and support level at 1.38000 could see a swing towards our next support target at 1.36800, in line with the graphical swing low support level found on the H4 time frame.
Areas of consideration:
- 1.39091 resistance area found on H4 time frame
- 1.38000 support area found on H4 timeframe
AUD/USD:
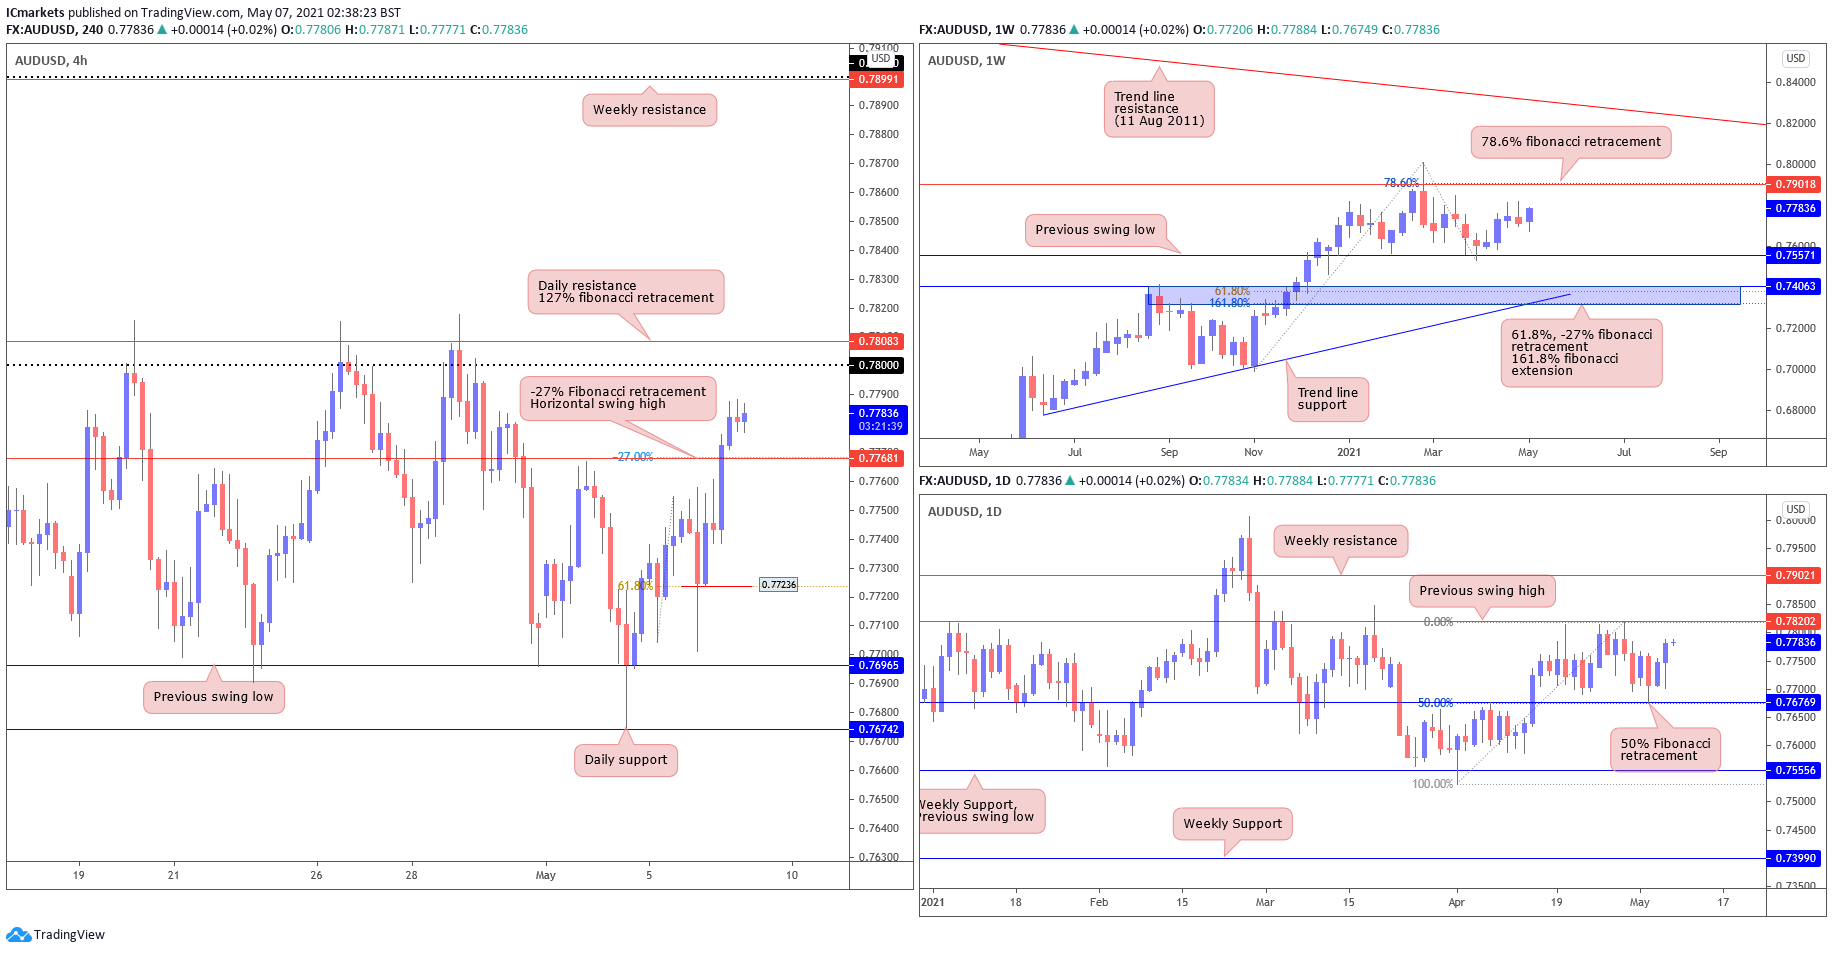
From the Weekly timeframe, price is displaying a consistent bullish move where it may find resistance at 78.6% fibonacci retracement level of 0.79018. From the daily timeframe, we see a similar move with price trending sideways near the previous swing high level of 0.78202, and has bounced off the 50% fibonacci retracement level in line with horizontal graphical overlap at 0.76769.
On the H4 timeframe, we saw that price managed to pullback down to 0.77236, in line with 61.8% fibonacci retracement level called yesterday, and showed signs of reversal, where we entered the market before price pushed straight towards the take profit level at -27% fibonacci level in line with horizontal swing high at 0.77681. Currently we may see a continuation towards the Daily resistance at 0.78083 in line with horizontal swing high resistance and major level 0.7800.
Areas of consideration:
- H4 may push higher towards 0.7800 in line with previous swing high.
- Daily and weekly time frames showing sideways consolidation on a bullish trend.
USD/JPY:
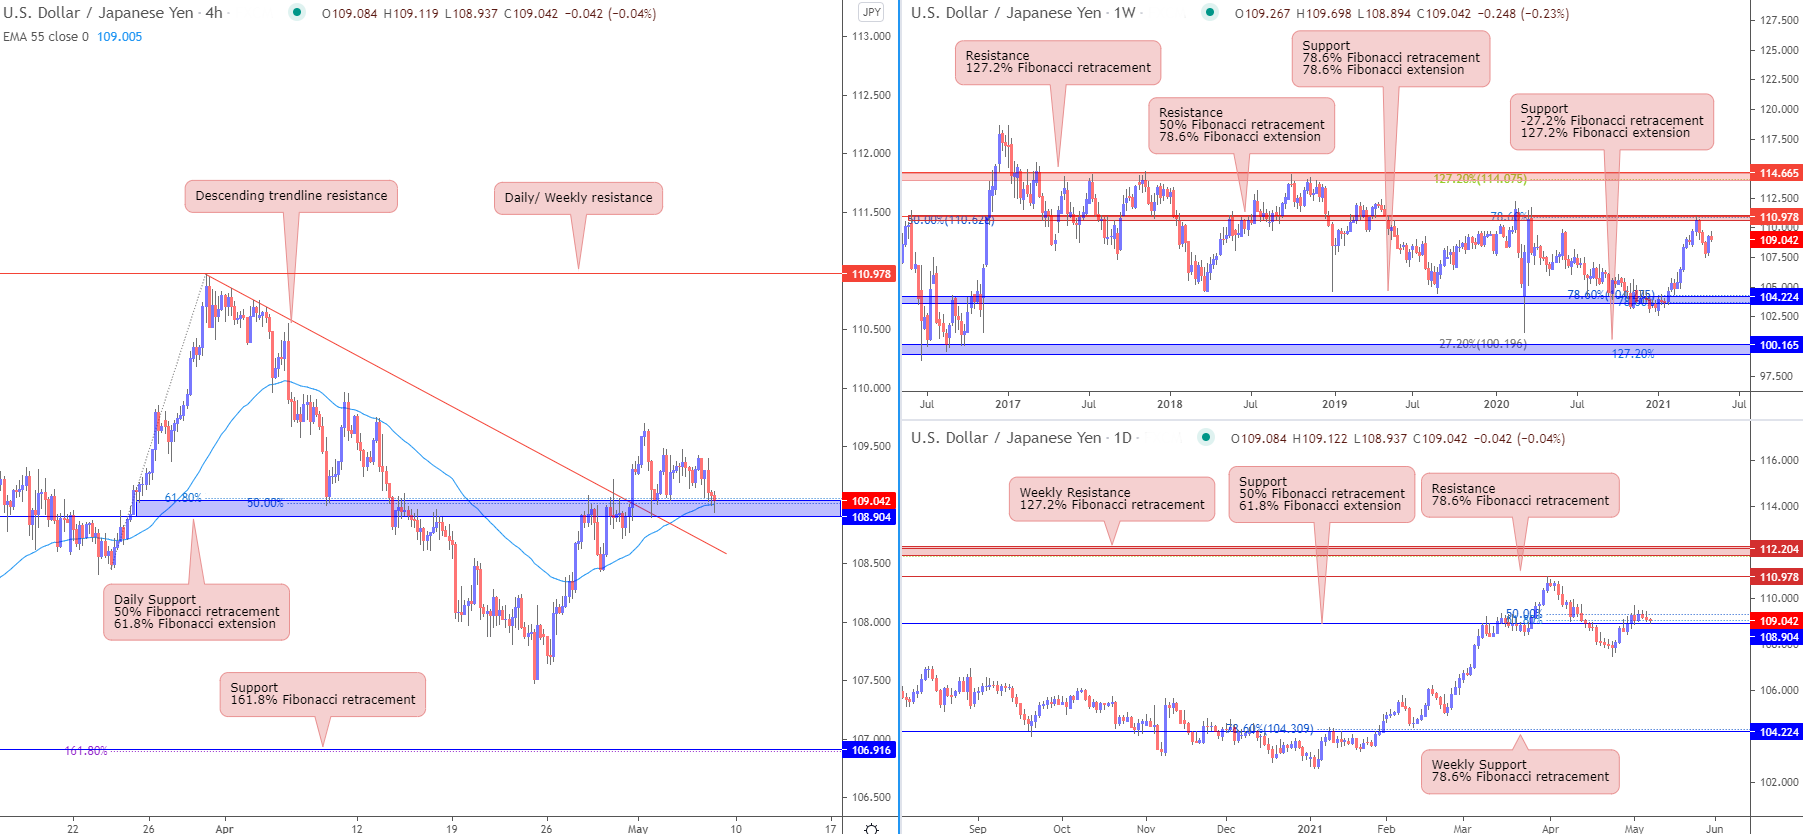
From the weekly timeframe, prices are facing resistance from horizontal swing high resistance which coincides with 50% Fibonacci retracement and 78.6% Fibonacci extension, taking support from 104.224 level which is in line with 78.6% FIbonacci retracement and 78.6% FIbonacci extension. In the daily time frame, prices are facing support from 108.904 level which coincides with 50% Fibonacci retracement and 61.8% Fibonacci extension. Prices might bounce towards daily resistance level 110.978 in line with 78.6% Fibonacci retracement.
On the H4 timeframe, prices have broken out of descending trendline resistance and are taking support from the daily support level of 108.904 level. Prices might push up towards 110.978. If prices push down further, prices might take support from 106.916 level which is also in line with 161.8% retracement. EMA is also below prices, showing a bullish pressure for prices.
Areas of consideration:
- On the H4, prices might push up towards 110.978 daily resistance level
- Price are taking support on 108.904 level on both the daily and weekly timeframe
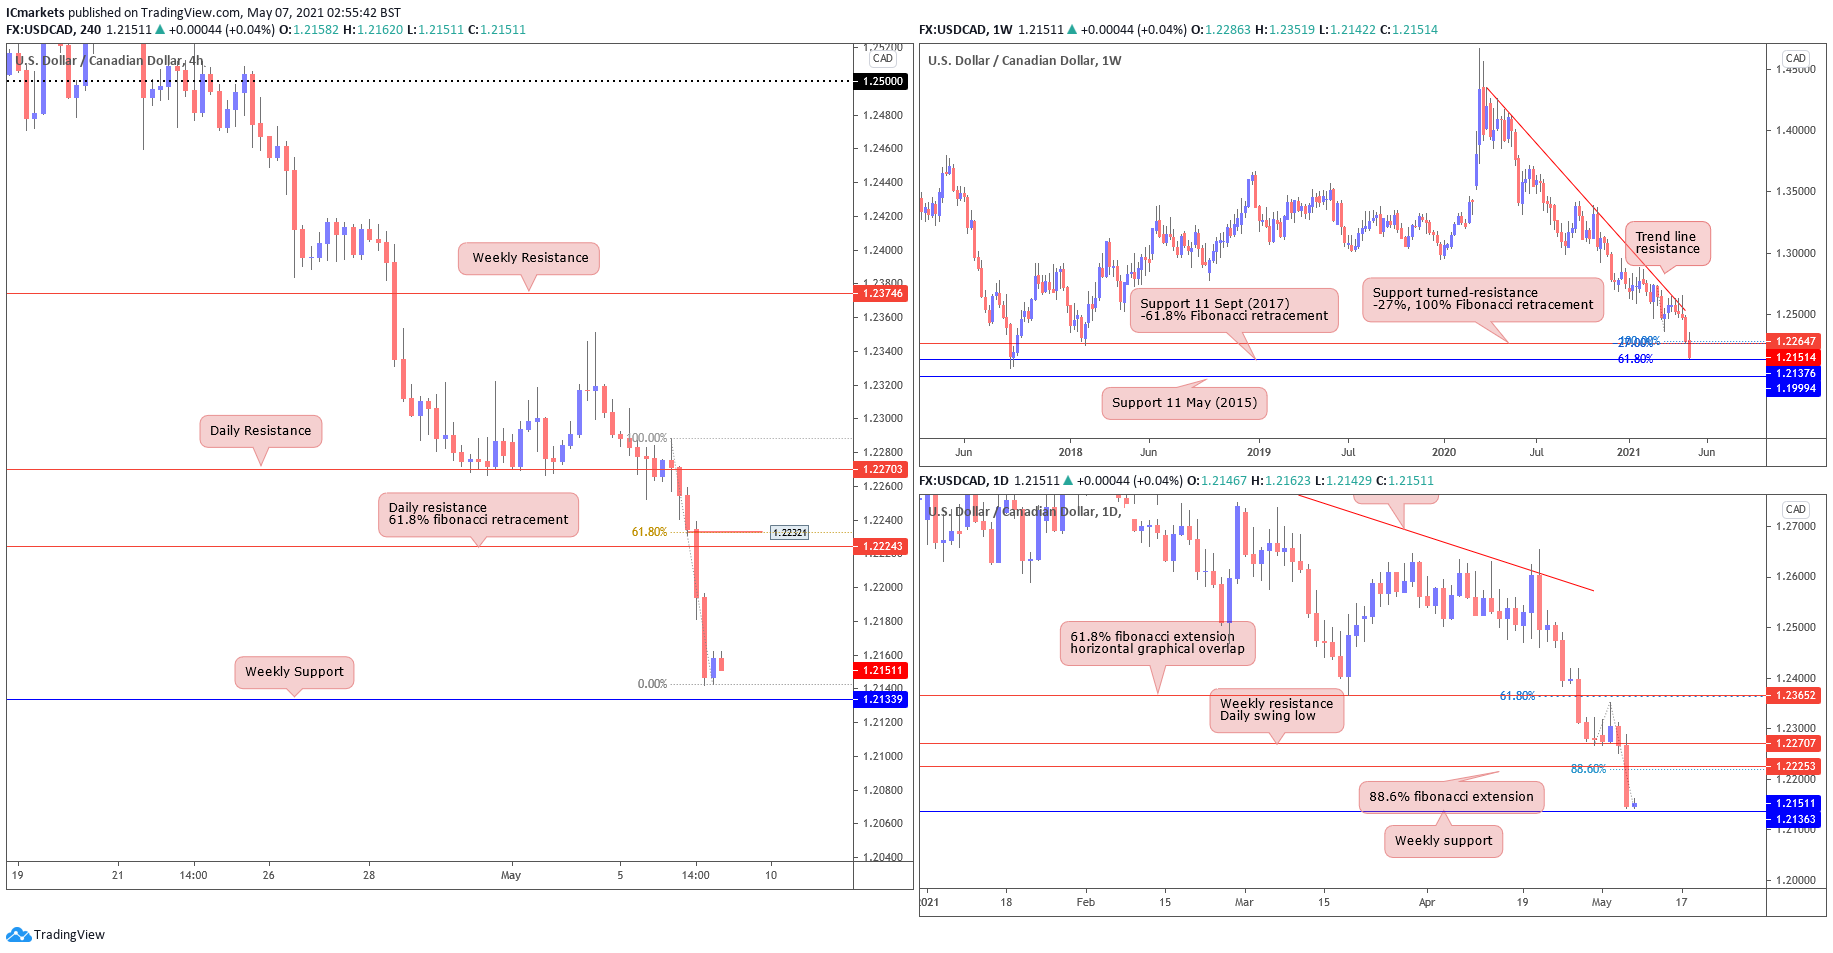
USD/CAD:
The weekly chart shows shot straight down towards the support level at 1.21376, in line with the -61.8% fibonacci retracement and horizontal graphical swing low taken from 11 september 2017. If price manages to break beneath this level, we may see it head towards the horizontal swing low from 11th May (2015).
On the daily time frame, we can see price finding support at the weekly support level where we may expect a pull back towards 1.22193, in line with 88.6% fibonacci extension level.
The H4 timeframe we see a pause in the strong bearish move where we could take fibonacci retracement and pull out the 61.8% level, currently if price retraces back into the level of 1.22321 in line with Daily resistance, we can consider a short position back down to the weekly support.
Areas of consideration:
- The weekly and daily time frame shows a break in the strong support level and continued its bearish move.
- On H4, price may pullback towards 1.22321 before swinging towards next support at 1.21339
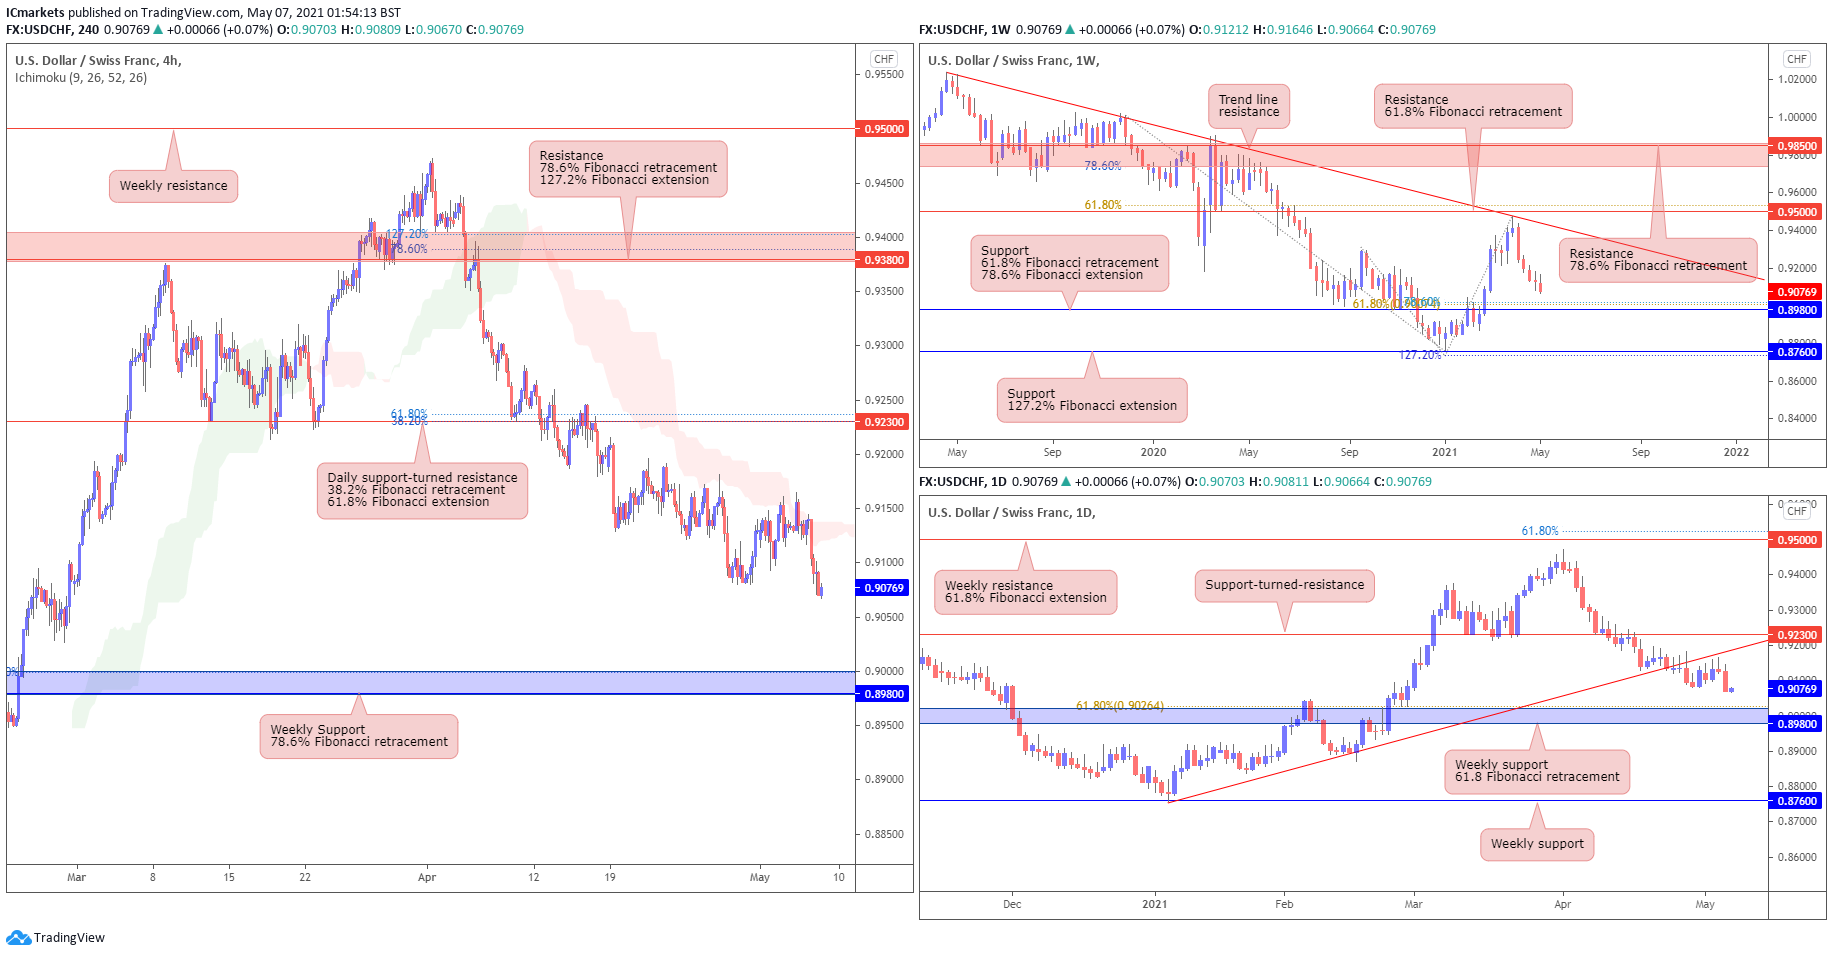
 USC/CHF:
USD/CHF has seen a reversal at the descending trendline resistance and is now approaching the weekly 0.89800 support, in line with 61.8% Fibonacci retracement and 78.6% Fibonacci extension. The daily chart shows that price is now holding below the key daily 0.92300 support-turned-resistance and has also broken below the ascending trendline support-turned-resistance. We could potentially see a reversal and further downside from here towards the next daily 0.89800 support level.
On the H4 chart, we can see that price is now holding below the Ichimoku cloud resistance, showing bearish pressure in line with our bearish bias. It is worth noting that price continues to hold below the daily 0.92300 support-turned-resistance area, which is in line with our 38.2% Fibonacci retracement and 61.8% Fibonacci extension. We could potentially see further downside towards our weekly 0.89800 support in line with 78.6% Fibonacci retracement. Otherwise, price could also make a stronger pullback to retest the Ichimoku cloud resistance.
Areas of consideration:
- We could potentially see a price swing towards the next 0.89800 weekly support.
- Price could also make a stronger pullback to retest the Ichimoku cloud and ascending trendline support-turned-resistance.
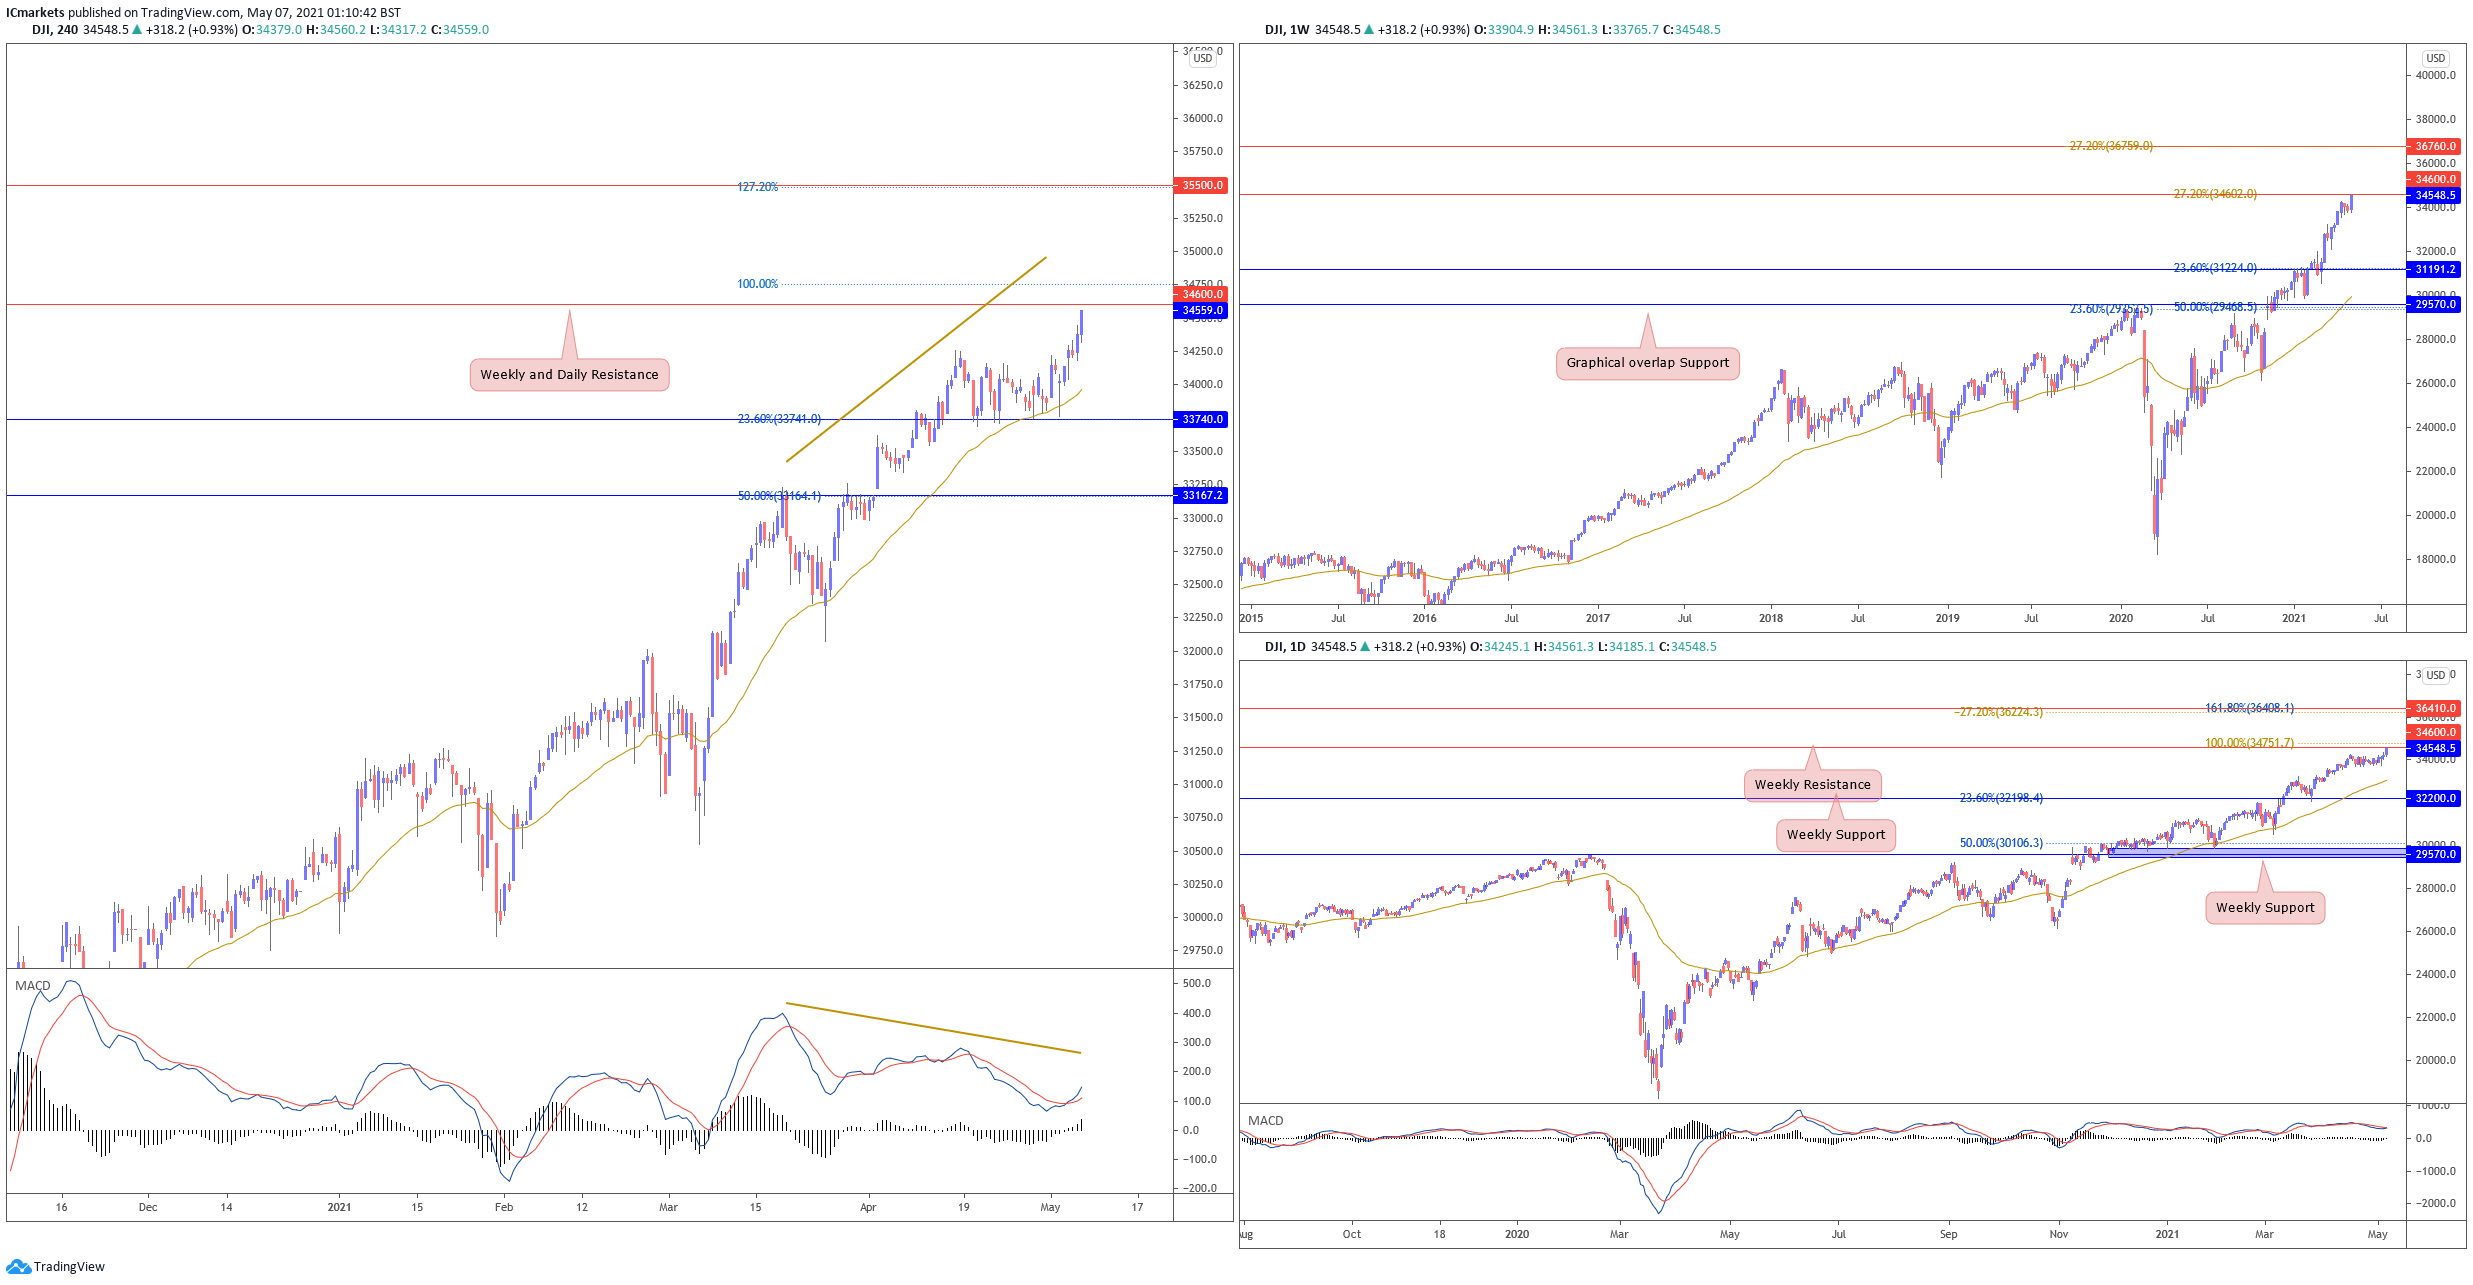
Dow Jones Industrial Average:
On the weekly chart, price is testing and holding below key 34600 resistance. With price deviating so far from the moving average, we may expect to see some mean reversion in the Dow soon. Sellers may add to their shorts below 34600 resistance with a possible long term downside target at 31190 support. Otherwise a weekly break and close above 34600 resistance will see price swing higher. On the Daily, price is capped below 34600 weekly resistance and seems to be reversing as well. Traders should be cautious about any form of selling as technical indicators remain bullish.
On the H4, pushed higher and is coming close to key weekly resistance at 34600. While technical indicators remain bullish, we note that there is a divergence forming. Traders looking to go long should be cautious. A daily close above 34600 resistance will confirm further rise. Otherwise, there is a chance that price may pullback lower.
Areas of consideration:
- Watch closely 34600 key resistance
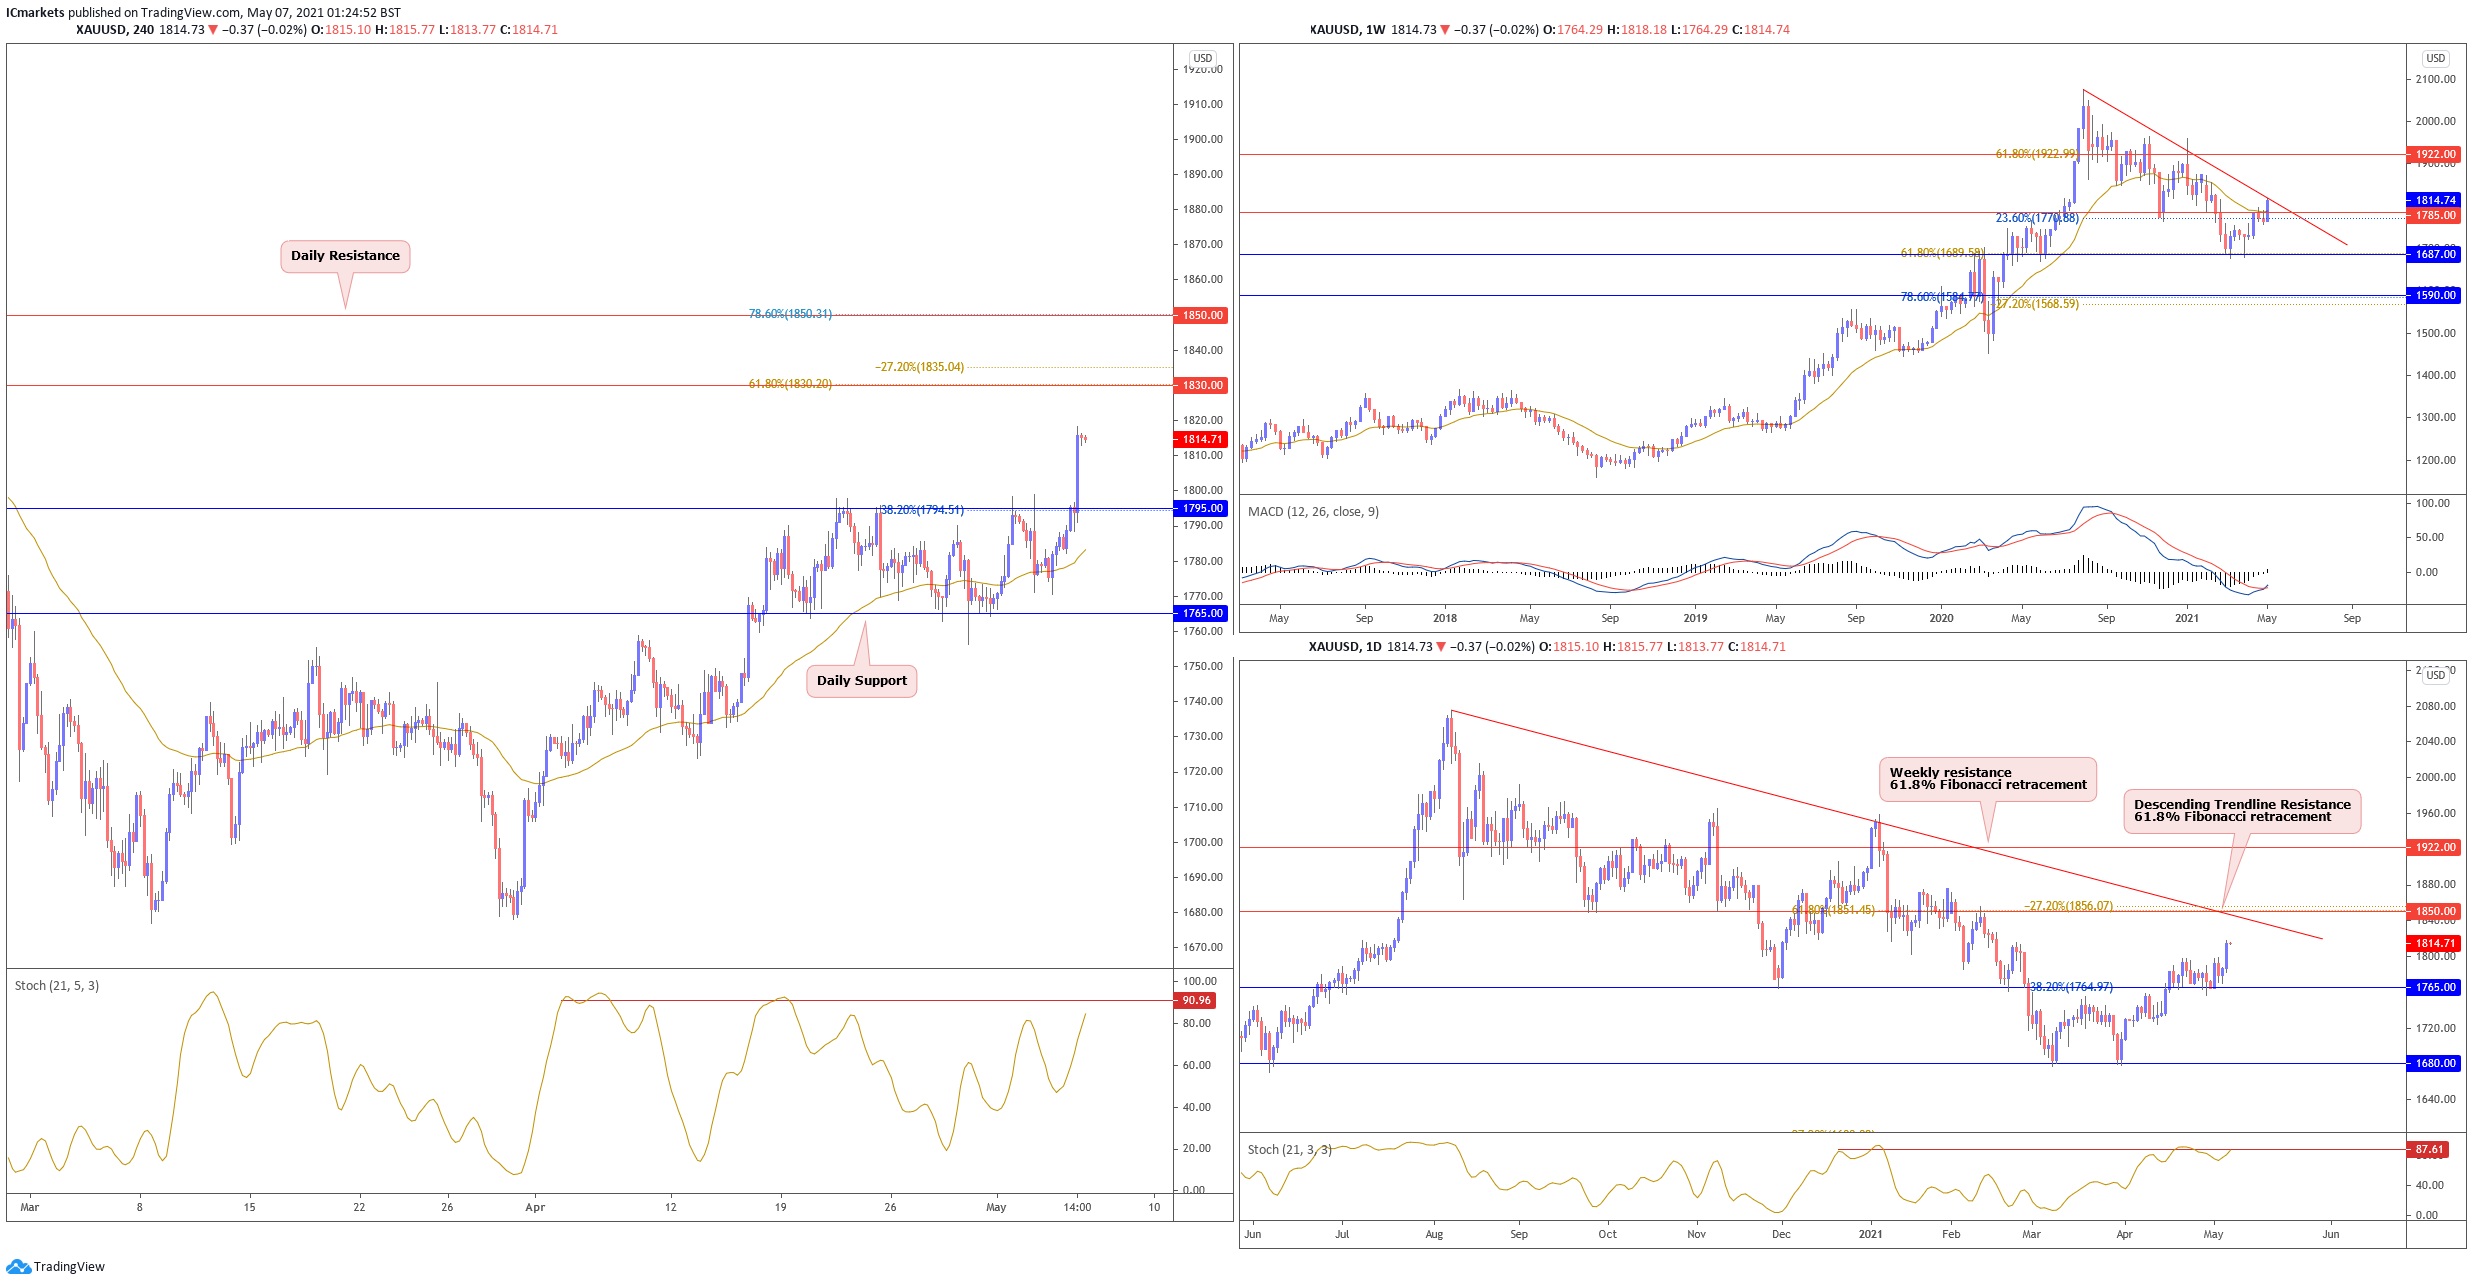
XAU/USD (Gold):
On the weekly timeframe, gold is testing and holding below descending trendline resistance at 1785 region. A weekly close below this resistance could see price pull back lower towards 1687 support. Otherwise, a weekly close above will see price push higher. On the Daily timeframe, price is approaching resistance at 1850. With stochastic testing resistance where price reacted in the past, a short term drop towards support at 1765 could be likely. Otherwise, failure to hold below 1850 resistance could see price swing higher towards 1922 resistance next.
On the H4, price pushed higher overnight and is capped below intraday resistance at 1830. With technical indicators giving mixed signals, we prefer to remain neutral with a slight bearish bias, watching 1830 resistance. Failure to hold below 1830 resistance will see price push towards daily resistance at 1850.
Areas of consideration:
- 1850 resistance level found on H4 time frame
- Technical indicators are mixed on H4
The accuracy, completeness and timeliness of the information contained on this site cannot be guaranteed. IC Markets does not warranty, guarantee or make any representations, or assume any liability regarding financial results based on the use of the information in the site.
News, views, opinions, recommendations and other information obtained from sources outside of www.icmarkets.com.au, used in this site are believed to be reliable, but we cannot guarantee their accuracy or completeness. All such information is subject to change at any time without notice. IC Markets assumes no responsibility for the content of any linked site.
The fact that such links may exist does not indicate approval or endorsement of any material contained on any linked site. IC Markets is not liable for any harm caused by the transmission, through accessing the services or information on this site, of a computer virus, or other computer code or programming device that might be used to access, delete, damage, disable, disrupt or otherwise impede in any manner, the operation of the site or of any user’s software, hardware, data or property.


