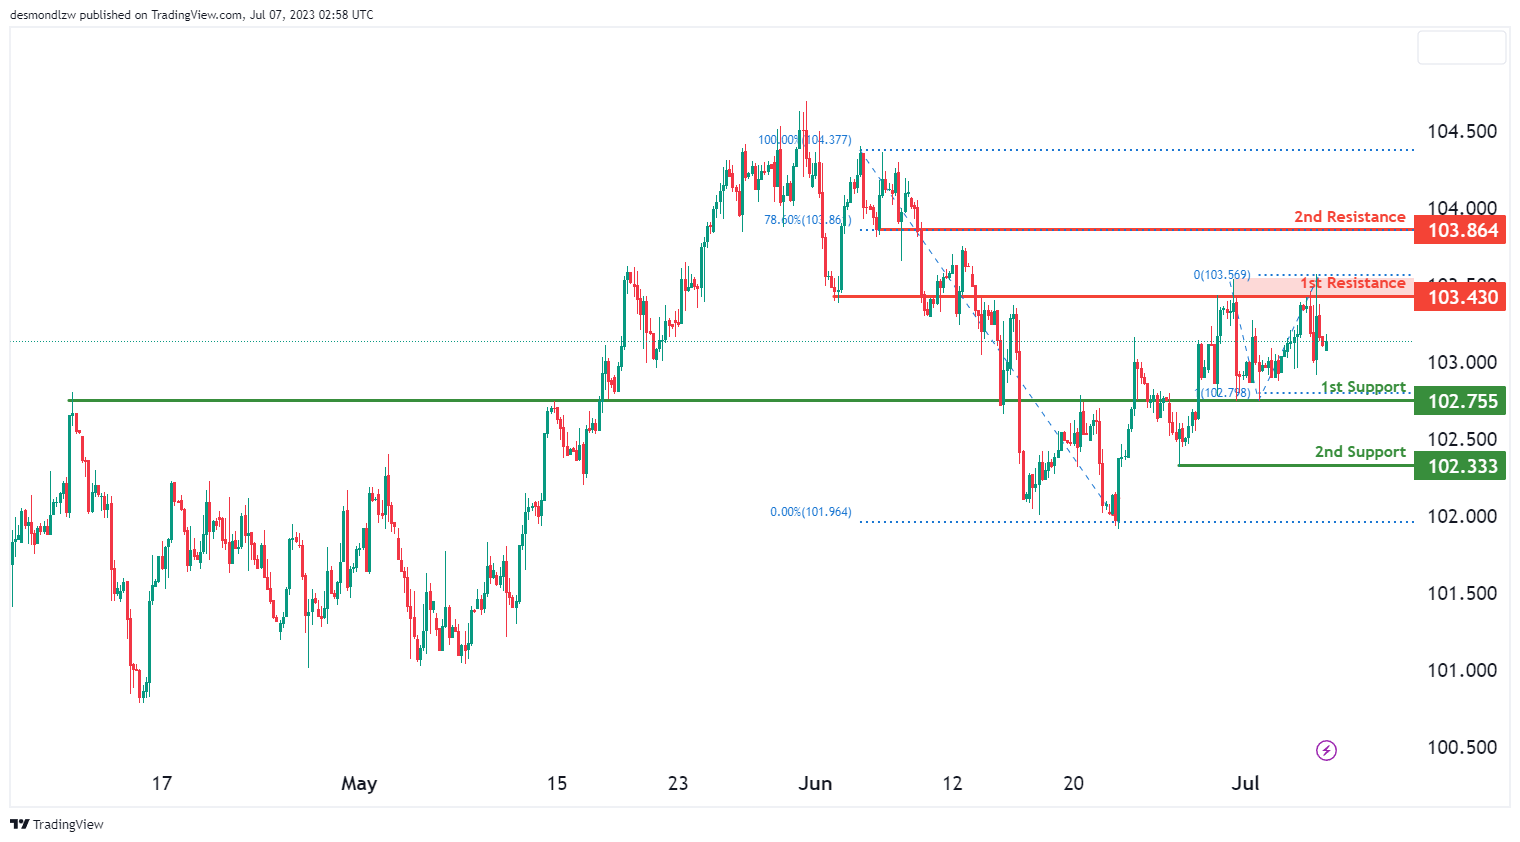
DXY:
The DXY chart indicates a prevailing bearish momentum, implying a likelihood of further downward movement in the market. The price has the potential for a bearish continuation, targeting the 1st support level located at 102.75. This support level is significant as it aligns with an overlap support and corresponds to a 100% Fibonacci Retracement level. Furthermore, the 2nd support at 102.33 serves as a swing low support, adding to its significance.
In terms of resistance levels, the 1st resistance at 1103.43 represents a prominent area of price resistance, characterized by overlap resistance. Conversely, the 2nd resistance at 103.86 acts as a pullback resistance, substantiated by its association with a 78.60% Fibonacci Retracement level.
EUR/USD:
The EUR/USD chart currently exhibits a neutral momentum, indicating a lack of clear direction in the market. There is a possibility of price fluctuating between the 1st support level at 1.0847, which is an ov
erlap support, and the 1st resistance level at 1.0919, representing a multi-swing high resistance with a 100% Fibonacci Retracement. The 2nd support level at 1.0780 serves as an additional overlap support, while the 2nd resistance level at 1.0995 is a swing high resistance.
Furthermore, the presence of a symmetrical triangle chart pattern suggests a period of consolidation, potentially preceding a breakout or breakdown. A bullish breakout may occur if the upper trendline is breached, while a bearish breakdown may happen if the lower trendline is breached.

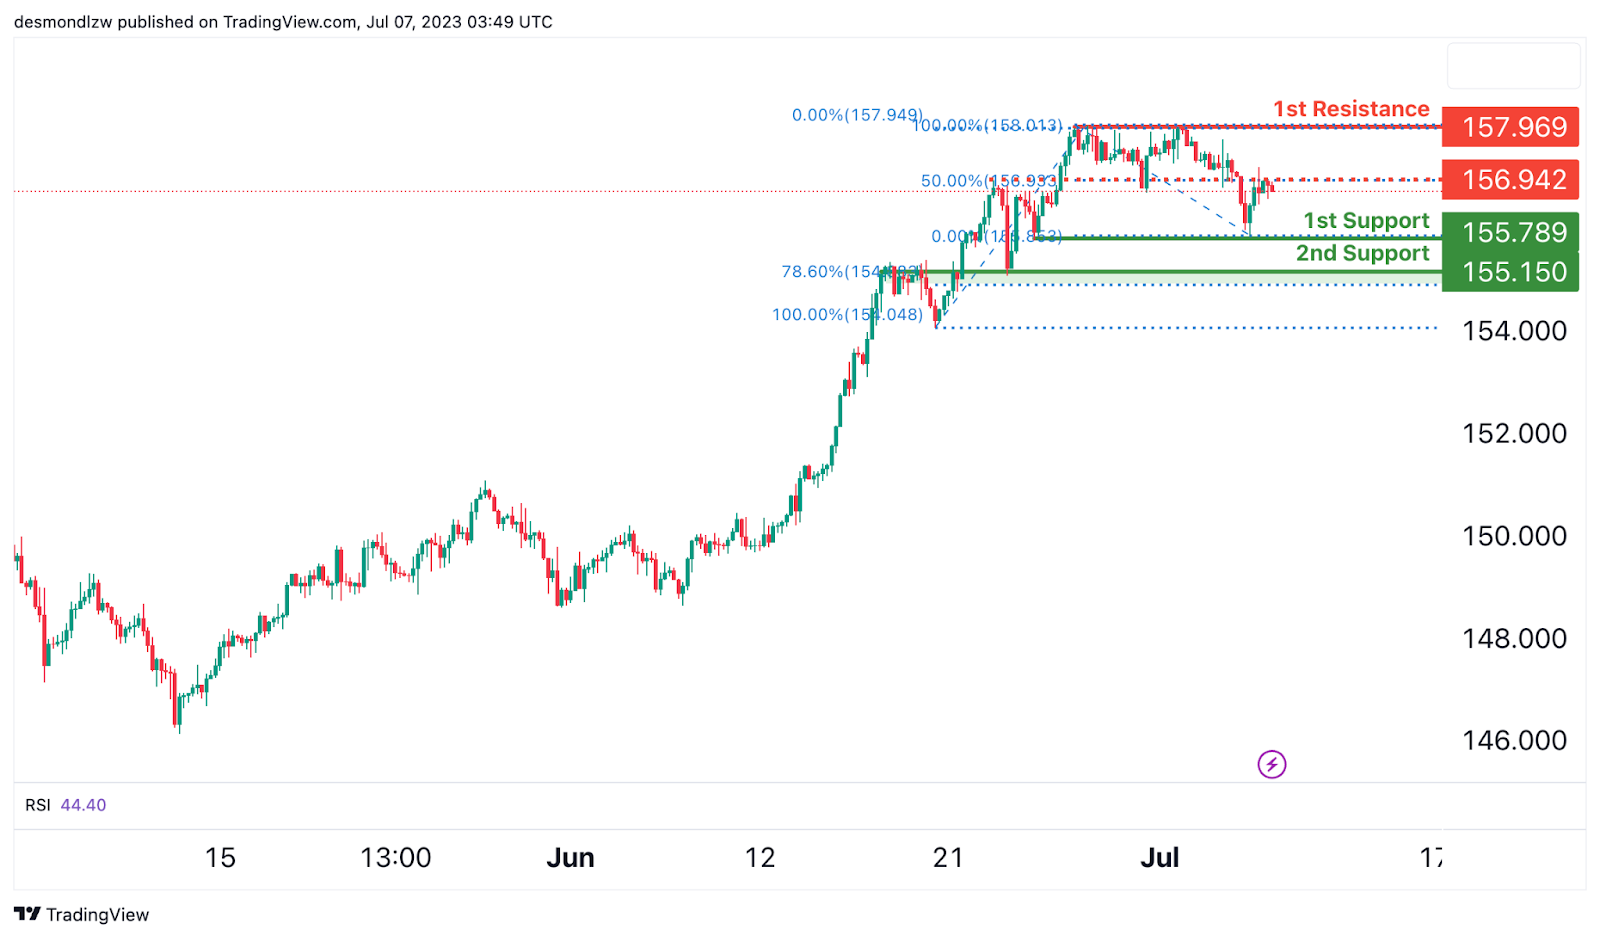
EUR/JPY:
The EUR/JPY chart currently demonstrates a bearish momentum, indicating the potential for further downward movement.
There is a possibility of a bearish continuation towards the 1st support level at 155.78, which is identified as a significant multi-swing low support. Additionally, the 2nd support level at 155.15 acts as an overlap support and exhibits Fibonacci confluence with a 78.60% Fibonacci Retracement, further reinforcing its importance.
On the upside, the 1st resistance level at 1916.21 represents a notable overlap resistance. Similarly, the 2nd resistance level at 1975.62 serves as a swing high resistance, indicating a potential barrier for price advancement.
In addition, there is an intermediate resistance at 155.94, which is an overlap resistance and aligns with a 50% Fibonacci Retracement, further emphasizing its significance.
EUR/GBP:
The EUR/GBP chart currently demonstrates a bullish overall momentum, suggesting the potential for further upward movement.
The 1st support level at 0.8524 serves as a significant multi-swing low support, indicating a potential area for price to bounce from. Additionally, the 2nd support level at 0.8493 acts as an overlap support, further reinforcing its significance.
On the upside, the 1st resistance level at 0.8577 represents an important overlap resistance, indicating a potential barrier for price advancement. Similarly, the 2nd resistance level at 0.8627 also functions as an overlap resistance, further solidifying its role as a potential price ceiling.

GBP/USD:
The GBP/USD chart currently demonstrates a bullish momentum, supported by the price being above a major ascending trend line and an ascending trend line acting as support.
There is a potential for a bullish bounce off the 1st support level at 1.2721, which is considered as pullback support. The 2nd support level at 1.2673 also acts as an overlap support and aligns with a 61.80% Fibonacci Retracement.
On the upside, the 1st resistance level at 1.2771 represents an overlap resistance with a 78.60% Fibonacci Retracement. Additionally, the 2nd resistance level at 1.2847 is a multi-swing high resistance.

GBP/JPY:
The GBP/JPY chart currently shows a neutral momentum, suggesting a lack of clear direction in the market. There is a potential for price to fluctuate between the 1st resistance and 1st support level.
The 1st support level is located at 182.153 and is considered significant due to its overlap support. Additionally, the 2nd support level at 180.046 aligns with an overlap support, further reinforcing its significance. On the upside, the 1st resistance level at 184.265 represents a significant overlap resistance.

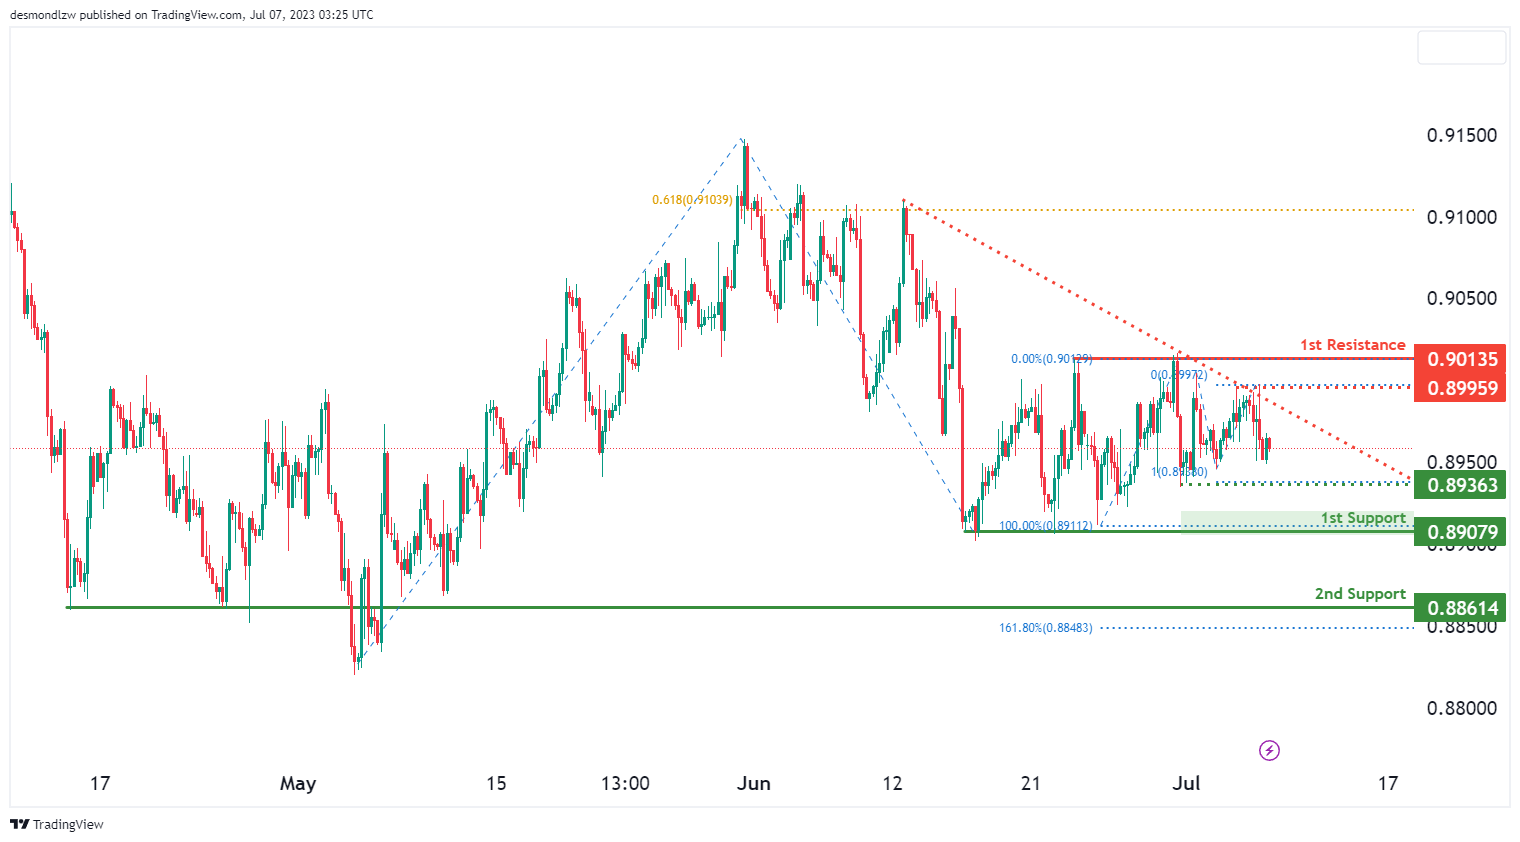
USD/CHF:
The USD/CHF chart currently exhibits a bearish momentum, indicated by the price being below a major descending trend line and a descending trend line acting as resistance.
There is a potential for a bearish continuation towards the 1st support level at 0.8907, which is identified as a multi-swing low support. The 2nd support level at 0.8861 acts as a pullback support and aligns with a 161.80% Fibonacci Extension.
On the upside, the 1st resistance level at 0.9013 represents a multi-swing high resistance. Additionally, there are intermediate resistance and support levels at 0.8936, with the former indicating multi-swing high resistance and the latter representing swing low support with a 100% Fibonacci Projection.
USD/JPY:
The USD/JPY chart currently demonstrates a bullish momentum, supported by the price being above a major ascending trend line and testing an ascending trend line acting as support.
There is a possibility of a bearish continuation towards the 1st support level at 142.16, which is identified as an overlap support and shows Fibonacci confluence with a 23.60% and 38.20% Fibonacci Retracement. The 2nd support level at 138.68 is also an overlap support.
On the upside, the 1st resistance level at 145.10 represents a pullback resistance. Additionally, there is a 2nd resistance level at 146.67, coinciding with a 78.60% Fibonacci Retracement. An intermediate support level at 143.91 is also present as an overlap support.

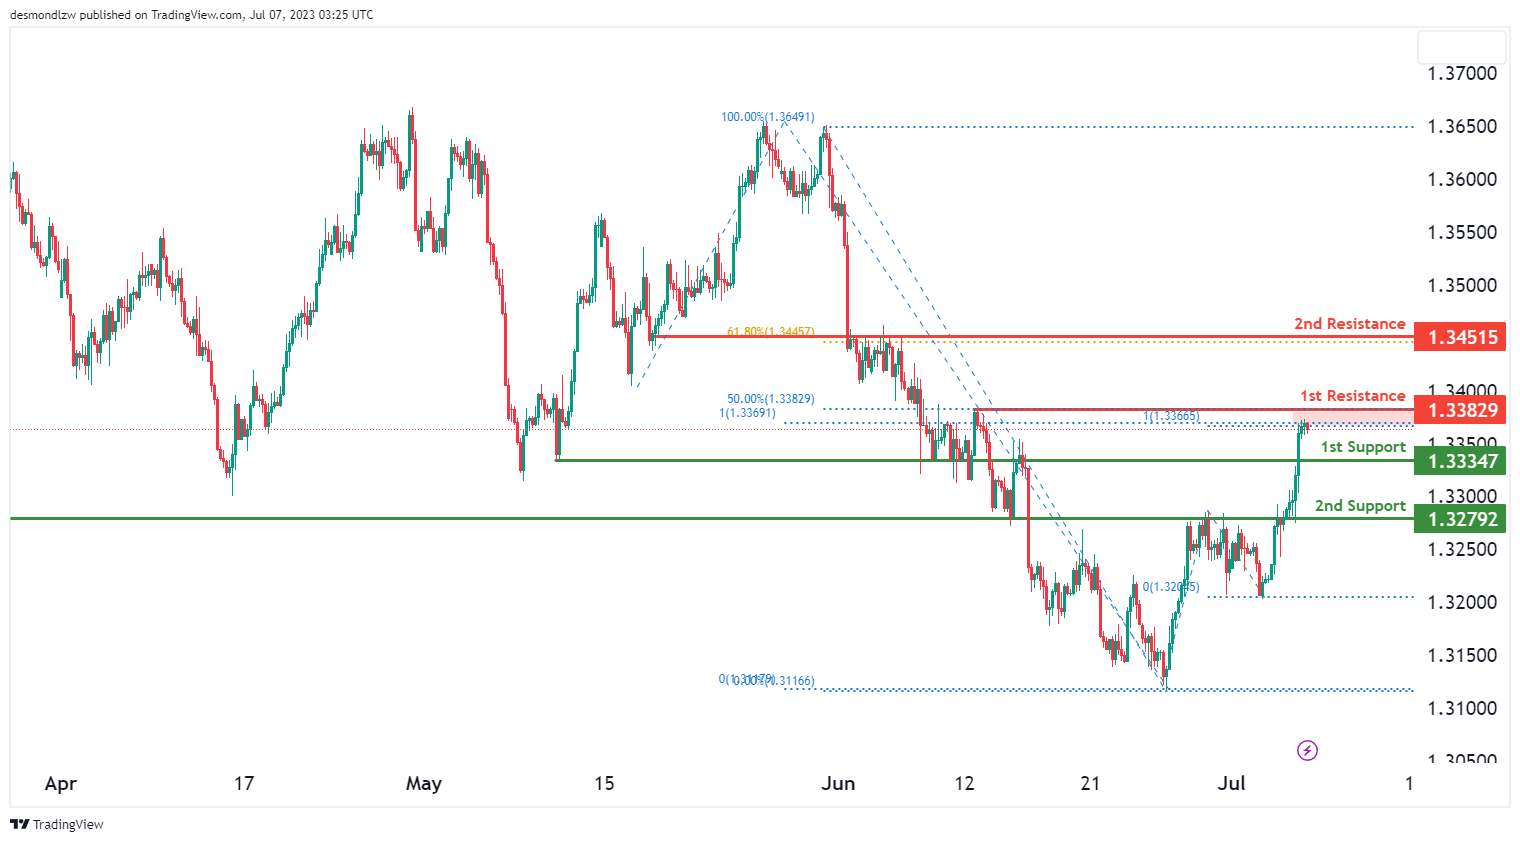
USD/CAD:
The USD/CAD chart exhibits a weak bullish momentum with low confidence. There is a potential for a bullish continuation towards the 1st resistance level at 1.3383, which is an overlap resistance and aligns with the 50% Fibonacci Retracement level and 100% Fibonacci Projection level.
The 1st support level at 1.3335 and the 2nd support level at 1.3279 act as reliable support levels, providing potential downside support.
On the upside, the 2nd resistance level at 1.3452 represents an overlap resistance and coincides with the 61.80% Fibonacci Retracement level.
AUD/USD:
The AUD/USD chart indicates a weak bullish momentum with low confidence. There is a potential for a bullish continuation towards the 1st resistance level at 0.6639, which is an overlap resistance and coincides with a 38.20% Fibonacci Retracement level.
The 1st support level at 0.6597 and the 2nd support level at 0.6580 both act as overlap supports. The 2nd support level also aligns with a 127.20% Fibonacci Extension level.
On the upside, the 2nd resistance level at 0.6717 is an overlap resistance and coincides with a 38.20% Fibonacci Retracement level.

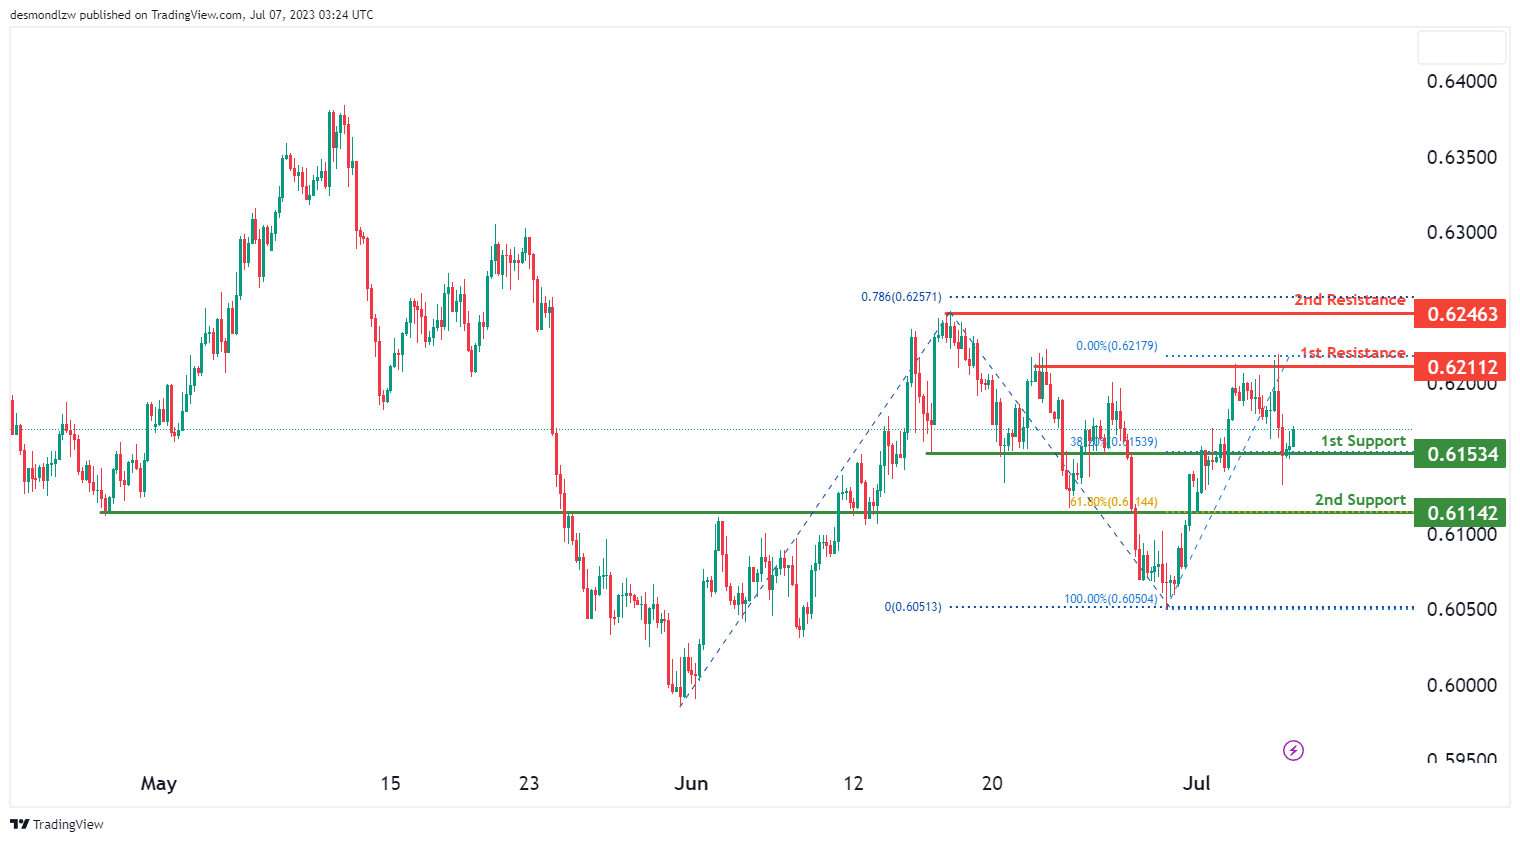
NZD/USD
The NZD/USD chart shows a bullish momentum, indicating the potential for further upward movement. There is a possibility of a bullish continuation towards the 1st resistance level at 0.6211, which is an overlap resistance.
The 1st support level at 0.6153, along with the 38.20% Fibonacci Retracement level, provides good support. Additionally, the 2nd support level at 0.6114, aligned with the 61.80% Fibonacci Retracement level, further strengthens the support.
On the upside, the 2nd resistance level at 0.6246, accompanied by the 78.60% Fibonacci Projection level, acts as a significant resistance.
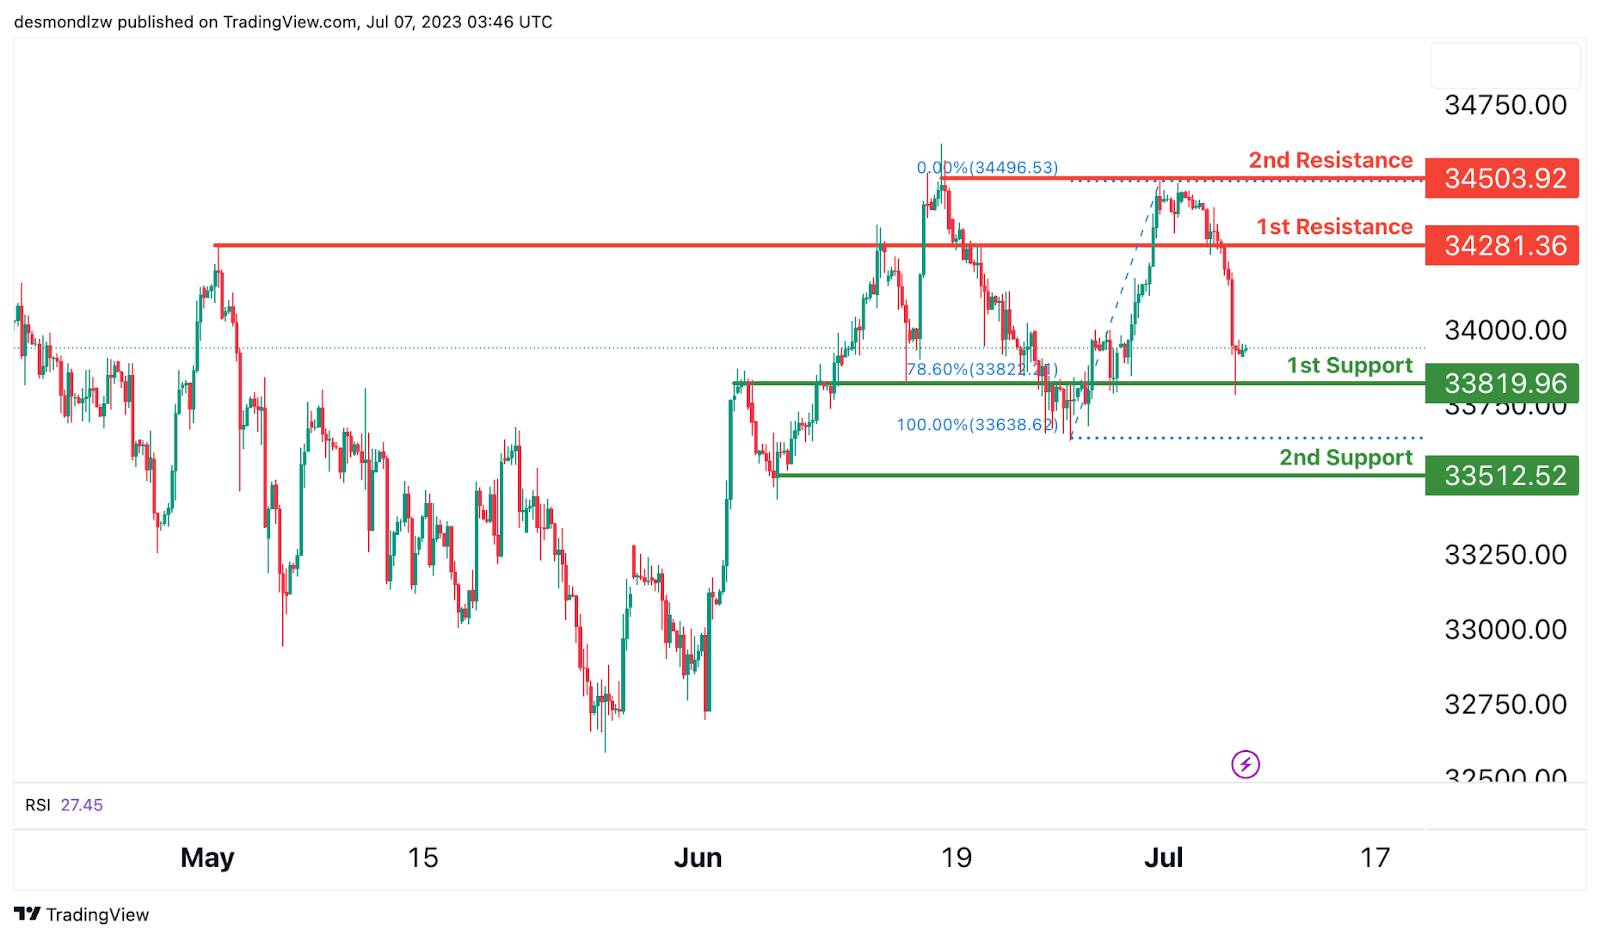
DJ30:
The DJ30 (Dow Jones Industrial Average) chart currently displays a strong bullish momentum, indicating a favorable market sentiment for upward movement.
There is a possibility for a bullish rebound from the reliable 1st support level located at 33819.96, which serves as a significant overlap support. This support level also aligns with a 78.60% Fibonacci Retracement, further reinforcing its importance. Additionally, the 2nd support level at 33512.52 acts as a swing low support, providing further potential downside support.
On the upside, it is worth noting that the 1st resistance level positioned at 34281.36 represents a significant overlap resistance, suggesting a potential area of price resistance. Furthermore, the 2nd resistance level at 34503.92 represents a multi-swing high resistance, indicating a noteworthy level that may act as a barrier to further price advancement.
GER30:
The GER30 (DAX) chart currently exhibits a strong bullish momentum, indicating a favorable market sentiment for upward movement.
There is a potential for a bullish rebound from the reliable 1st support level located at 15483.16, which is characterized as a significant multi-swing low support. This level also aligns with a -27% Fibonacci Expansion, further enhancing its significance.
On the upside, it is worth noting that the 1st resistance level positioned at 15669.01 represents a notable overlap resistance, indicating a potential area of price congestion. Moreover, the 2nd resistance level at 15773.56 coincides with a 61.80% Fibonacci Projection and acts as an additional overlap resistance, adding to its importance.

US500
The US500 (S&P 500) chart currently demonstrates a robust bullish momentum, suggesting a strong inclination for upward movement in the market.
There is a distinct possibility of witnessing a bullish rebound from the well-established 1st support level located at 4383.3, which is recognized as a significant multi-swing low support area.
On the upside, it is noteworthy that the 1st resistance level positioned at 4452.4 represents a notable overlap resistance, indicating a potential level of price congestion. Moreover, the 2nd resistance level situated at 4515.5 is considered a prominent swing high resistance, underscoring its significance in terms of potential price barrier.

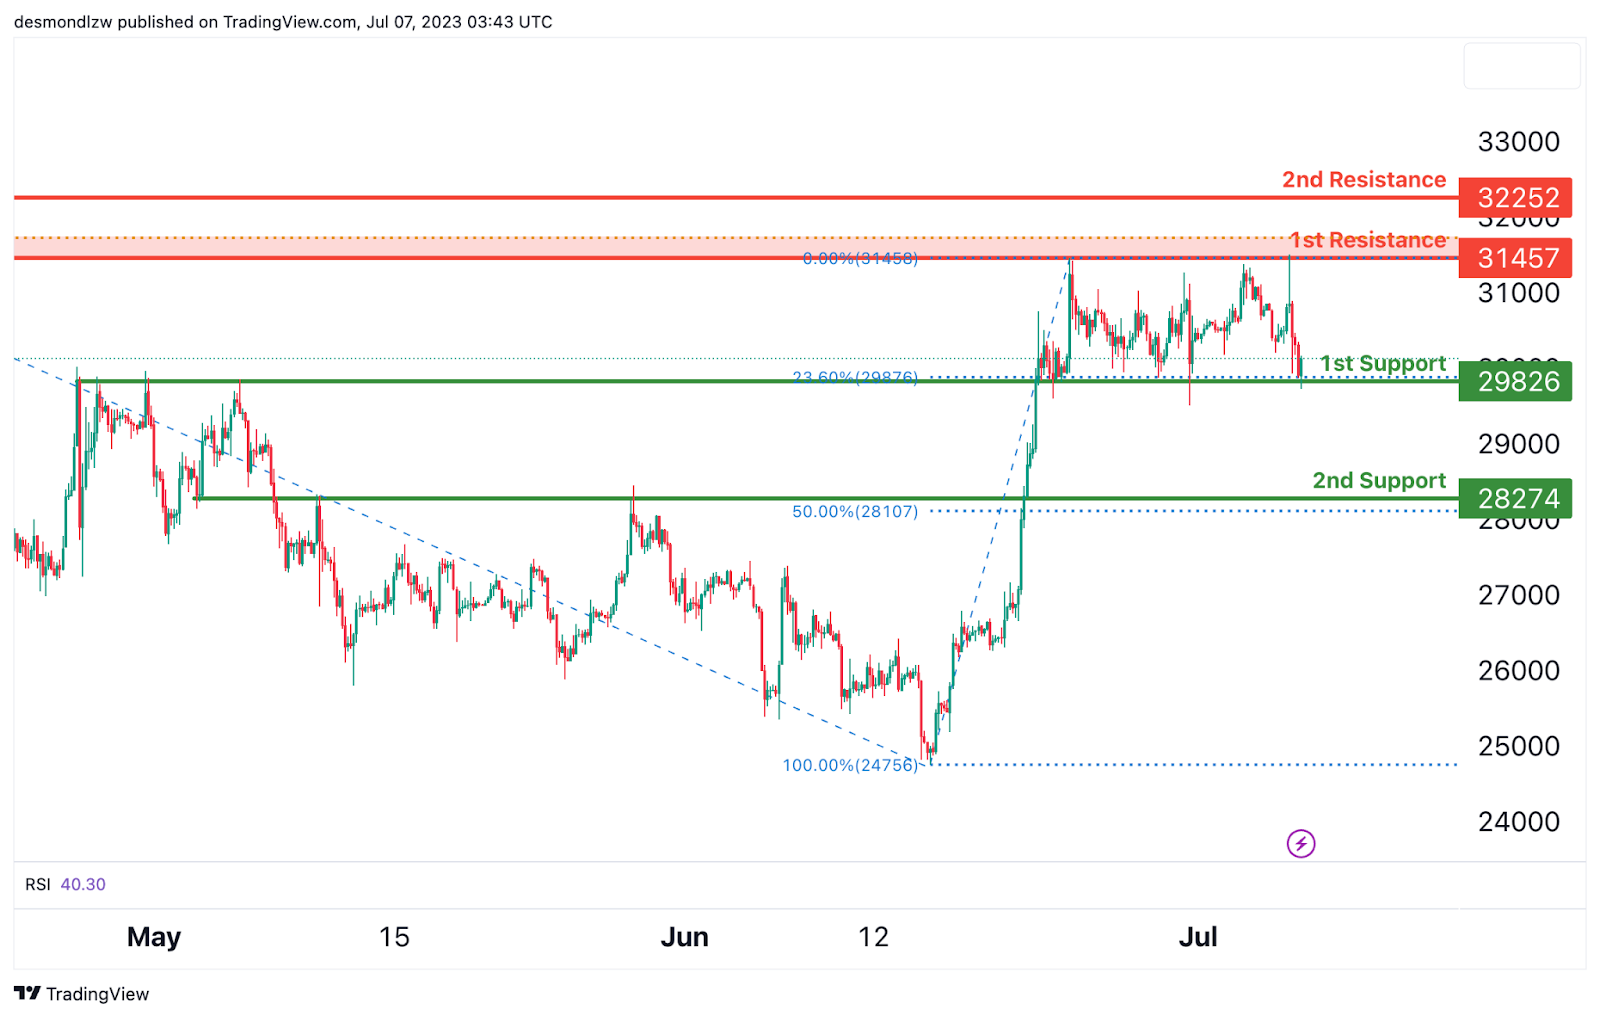
BTC/USD:
The BTC/USD (Bitcoin) chart currently demonstrates bullish momentum, indicating the potential for upward movement in the market.
There is a possibility of a bullish bounce off the 1st support level at 29826, which is identified as an overlap support and coincides with a 23.60% Fibonacci Retracement. Additionally, the 2nd support level at 28274 acts as an overlap support and aligns with a 50% Fibonacci Retracement.
On the upside, the 1st resistance level at 31457 represents a multi-swing high resistance with a 61.80% Fibonacci Projection. Furthermore, the 2nd resistance level at 32252 is identified as a swing high resistance.
ETH/USD:
The ETH/USD (Ethereum) chart currently displays bullish momentum, suggesting the potential for upward movement in the market.
There is a possibility of a bullish bounce off the 1st support level at 1826.24, which is considered an overlap support and coincides with a 23.60% Fibonacci Retracement. Additionally, the 2nd support level at 1763.33 acts as an overlap support and shows Fibonacci confluence with a 127.20% Fibonacci Extension and a 61.80% Fibonacci Retracement.
On the upside, the 1st resistance level at 1916.21 represents an overlap resistance and aligns with a 61.80% Fibonacci Projection. Furthermore, the 2nd resistance level at 1975.62 is identified as a swing high resistance.

WTI/USD:
The WTI/USD (Crude Oil) chart currently demonstrates bullish momentum, indicating a potential upward movement in the market.
There is a possibility of a bullish continuation towards the 1st resistance level at 72.78, which is identified as an overlap resistance and aligns with a 61.80% Fibonacci Projection.
The 1st support level at 70.14 is considered strong as it represents an overlap support and coincides with a 38.20% Fibonacci Retracement. Additionally, the 2nd support level at 67.15 acts as another overlap support.
On the upside, the 2nd resistance level at 74.25 is an important level as it represents an overlap resistance and aligns with a 100% Fibonacci Projection.

XAU/USD (GOLD):
The XAU/USD (Gold) chart currently exhibits a bearish momentum, supported by the price being below a major descending trend line and a descending trend line acting as resistance.
There is a potential for a bearish reaction off the 1st resistance level at 1911.86, identified as an overlap resistance. This could lead to a drop towards the 1st support level at 1889.42, characterized as an overlap support with a 100% Fibonacci Projection. The 2nd support level at 1856.81 also acts as a pullback support.
Additionally, there is an intermediate support level at 1902.38, which serves as a multi-swing low support with a 78.60% Fibonacci Retracement. The 2nd resistance level at 1932.11 is significant as it represents an overlap resistance and aligns with a 78.60% Fibonacci Retracement.

The accuracy, completeness and timeliness of the information contained on this site cannot be guaranteed. IC Markets does not warranty, guarantee or make any representations, or assume any liability regarding financial results based on the use of the information in the site.
News, views, opinions, recommendations and other information obtained from sources outside of www.icmarkets.com, used in this site are believed to be reliable, but we cannot guarantee their accuracy or completeness. All such information is subject to change at any time without notice. IC Markets assumes no responsibility for the content of any linked site.
The fact that such links may exist does not indicate approval or endorsement of any material contained on any linked site. IC Markets is not liable for any harm caused by the transmission, through accessing the services or information on this site, of a computer virus, or other computer code or programming device that might be used to access, delete, damage, disable, disrupt or otherwise impede in any manner, the operation of the site or of any user’s software, hardware, data or property.