
EUR/USD:
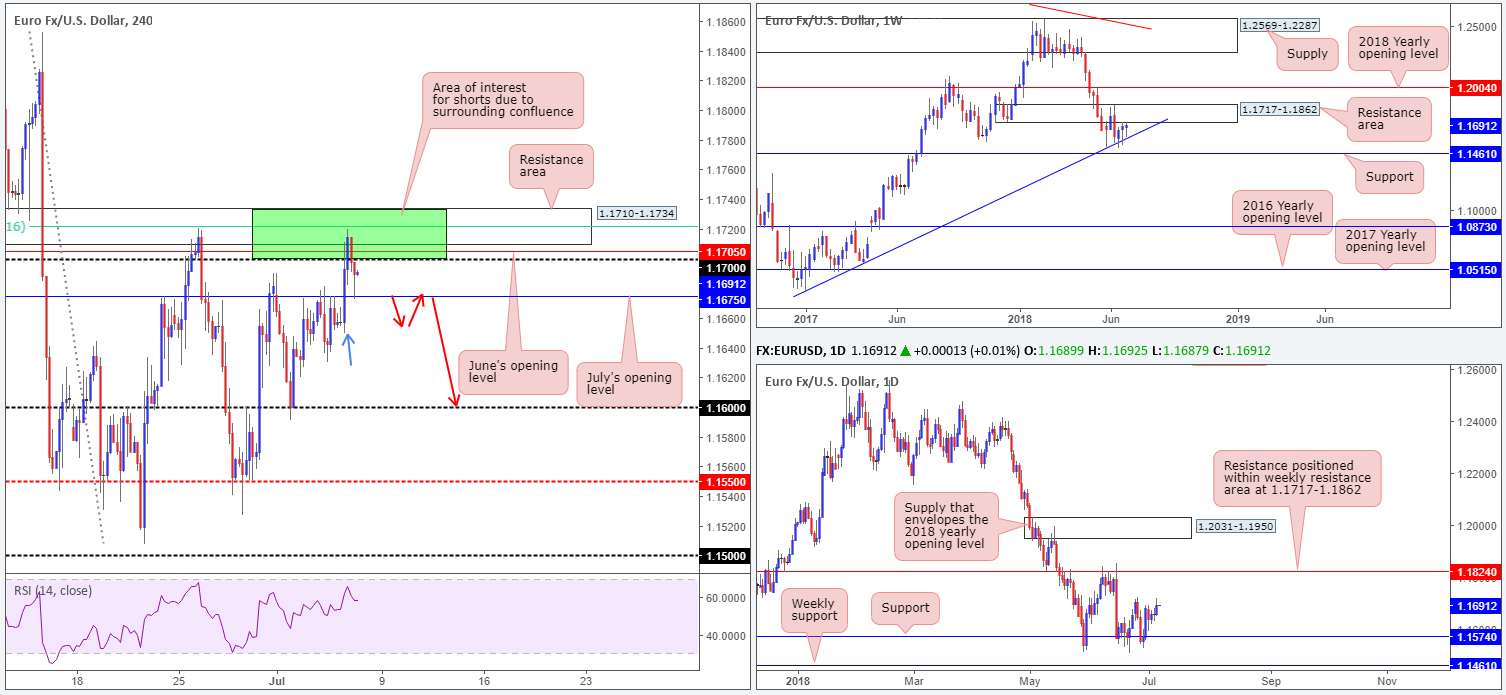
For folks who read Thursday’s briefing you may recall the team highlighting a H4 green zone at 1.1734/1.17 for possible shorting opportunities (comprised of June’s opening level at 1.1705, a 61.8% H4 Fib resistance value at 1.1721, a H4 resistance area at 1.1710-1.1734 and the lower edge of a weekly resistance area at 1.1717). As you can see, the market stormed into our area of interest amid London trade. H4 action, however, hit the brakes and reversed at highs of 1.1720, ending the day testing H4 support in the form of July’s opening level at 1.1675.
Ultimately, the market was undecided on how to interpret the latest FOMC minutes. While showing support for gradual rate hikes, members also displayed concern regarding the yield curve and effects of tariffs.
Areas of consideration:
July’s opening level mentioned above at 1.1675, and a neighboring H4 demand seen marked with a blue arrow at 1.1651-1.1674, is expected to be a challenge for sellers. The demand boasts strong momentum to the upside and was considered fresh. As such, a retest of the noted green H4 resistance zone is not out of the question today.
Overall, though, the expectation is for the market to eventually probe lower and reconnect with weekly trend line support taken from the low 1.0340 (the next downside target on the weekly scale). So, ideally, shorts from the green zone should be targeting the 1.16 band.
A decisive H4 close below July’s opening level, therefore, is what we’re eyeing today. Followed up with a retest to the underside of this level as resistance (see red arrows) in the shape of a full or near-full-bodied H4 bear candle would, in our humble view, be enough evidence to suggest lower prices are on the cards, targeting, as highlighted above, the 1.16 handle.
Today’s data points: US job’s figures.
GBP/USD:
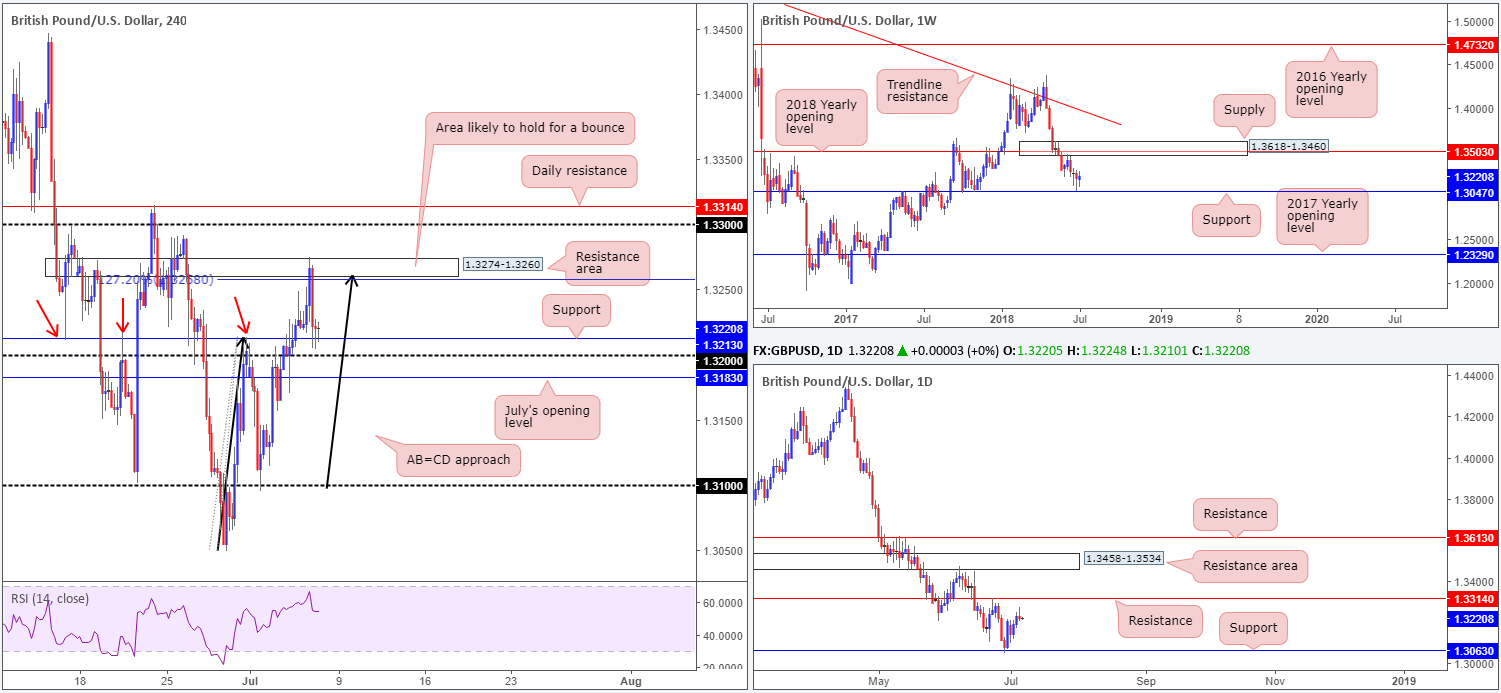
In Thursday’s report, the team underscored a potential reversal from the H4 resistance zone at 1.3274-1.3260, which happened to converge with a H4 AB=CD approach (see black arrows).
GBP/USD bulls initially took advantage of USD weakness amid Europe, also aided by optimistic comments from BoE Gov. Carney. The move brought price action deep into our area of interest noted above, marginally slicing through the top edge. Despite this, sterling dropped against both the dollar and euro after reports suggested Germany is said to see UK PM May’s Brexit customs plan as ‘unworkable’, consequently bringing H4 action down to support at 1.3213: the pre-determined take-profit target. Well done to any of our readers who caught this move!
Areas of consideration:
In addition to H4 support in play at 1.3213, further layers of support are seen nearby: the 1.32 handle and July’s opening level at 1.3183. Collectively, this may prove a difficult area to breach ahead of today’s US employment situation report.
Aside from the move from 1.3274-1.3260, we don’t really have much to hang our hat on in terms of high-probability trading opportunities at the moment. To that end, remaining flat until post NFP might be an idea.
Today’s data points: Halifax HPI m/m; US job’s figures.
AUD/USD:
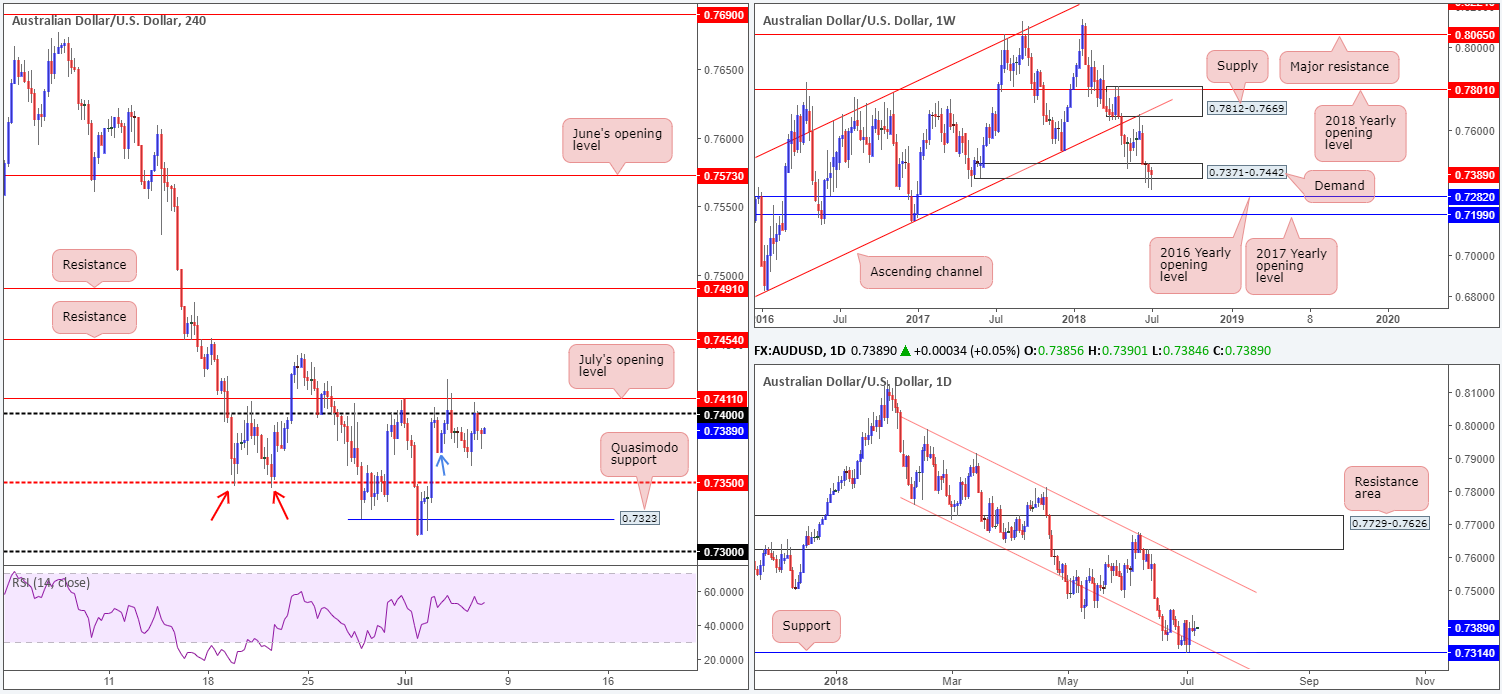
In recent dealings, the commodity currency broke to lows of 0.7361 before rotating north and reconnecting with the underside of 0.74, missing July’s opening level at 0.7411 by a hair. Despite this movement, trade ended the day relatively unchanged.
Weekly demand at 0.7371-0.7442 remains in the fray, but appears to be hanging on by a thread. Last week’s push below this area likely tripped stops and cleared the path south to nearby weekly support in the shape of the 2016 yearly opening level at 0.7282. Daily action, on the other hand, found support at 0.7314, which happens to be bolstered by additional confluence in the form of a nearby daily channel support taken from the low 0.7758.
Areas of consideration:
Longer term, the bulls remain struggling to find solid earth. Regardless, though, the team will not consider buyer exhaustion until a daily close below daily support at 1.3314 is seen.
Intraday, we may see a push lower. Stop-loss orders were tripped sub 0.7371 yesterday (blue arrow), possibly unlocking the trail south to H4 mid-level support at 0.7350. This level held firm in late June (red arrows), so we may well see history repeat itself here. A failure of this barrier opens downside to H4 Quasimodo support at 0.7323, followed closely by the 0.73 handle.
As you can see, structure is restricted on the lower timeframes, leaving little room to work with. A short at current price based on the response seen off 0.74, nonetheless, may be an option, targeting 0.7350 as the initial port of call (stop positioned above 0.7411 at 0.7412 [23 pips at current price] and a take-profit target sited at 0.7350 [39 pips] – 1.7 times one’s risk). However, do remain cognizant of today’s economic data: the US employment situation report – hopefully this setup will have played out before this occurs.
Today’s data points: US job’s figures.
USD/JPY:
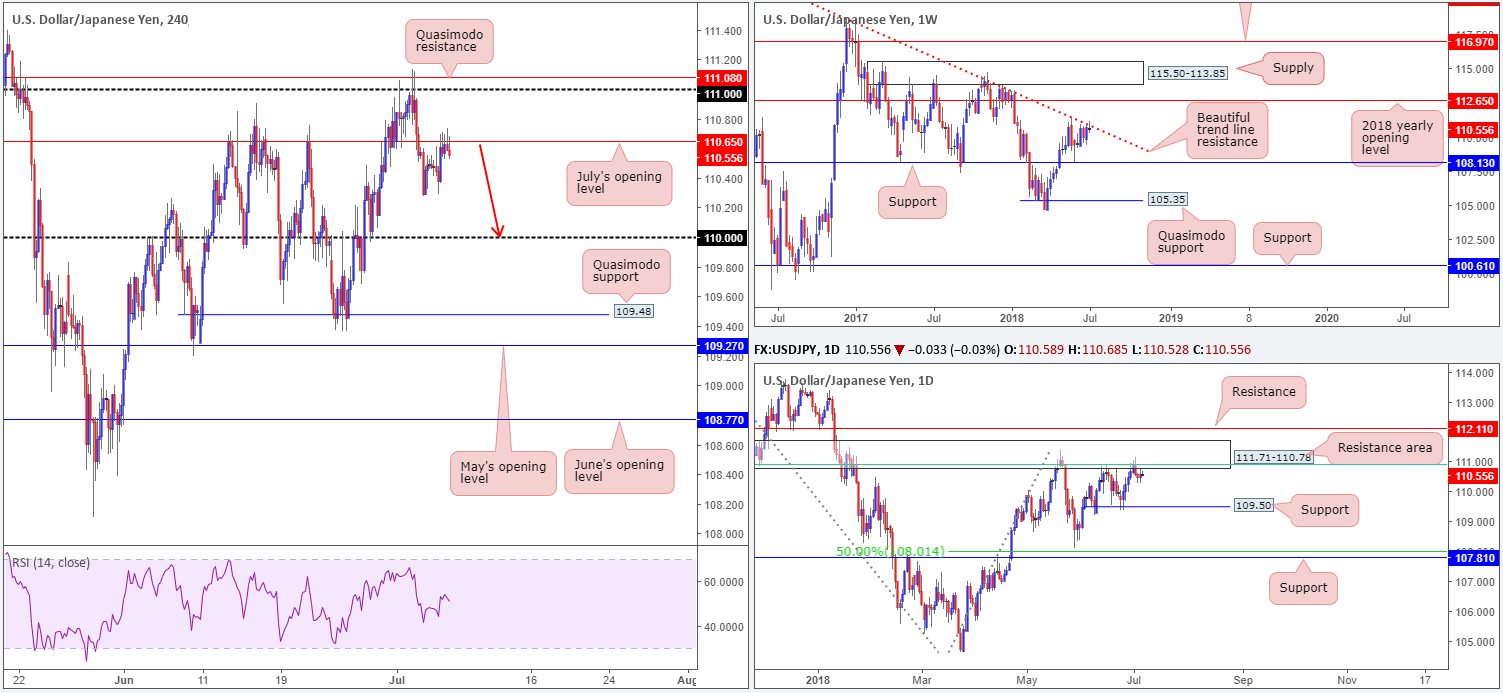
Trade volume remained thin amid Thursday’s sessions on the USD/JPY, with H4 candles establishing resistance around the underside of July’s opening level at 110.65. In light of the lackluster performance, the outlook for this market remains unchanged.
Following a strong push north last week, weekly price engaged with a trend line resistance taken from the high 123.57. Thus far, the sellers remain in the driving seat here and, in turn, could lead to a test of weekly support coming in at 108.13. Bolstering this weekly barrier is a daily resistance area seen at 111.71-110.78, which happens to house a 61.8% daily Fib resistance value at 110.91 (green line) within its limits. Note that the next downside target on this scale does not come into view until we reach the 109.50ish mark.
Areas of consideration:
Having seen H4 price connect with July’s opening level at 110.65 and print a collection of selling wicks, as well as surrounding resistances seen overhead from the higher timeframes, a move down to 110 may come to fruition. Stop-loss placement, for those looking to get involved here, is best positioned above the noted selling wicks: 110.75 appears to be a safe location.
Today’s data points: US job’s figures.
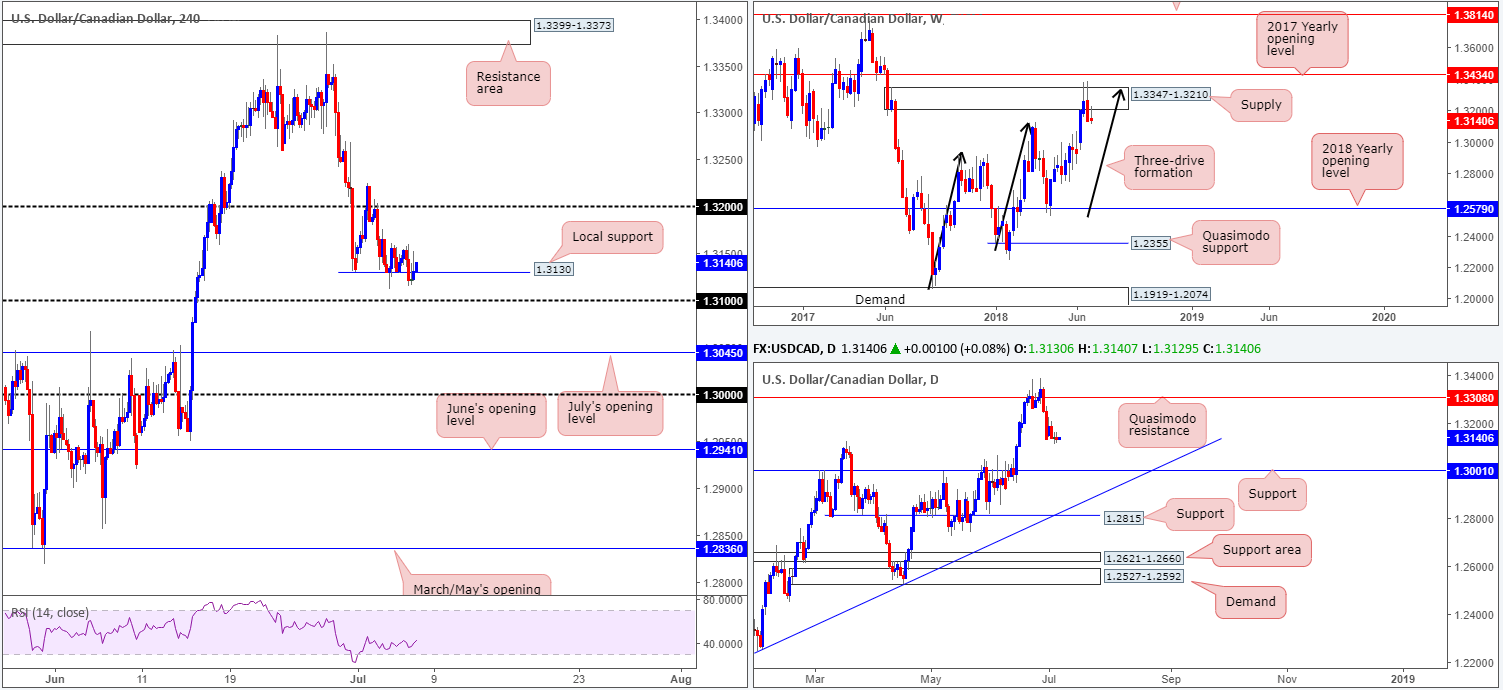
USD/CAD:
USD/CAD prices remained somewhat sedated amid trade on Thursday, despite FOMC minutes. The market was undecided on how to interpret the latest FOMC report. While showing support for gradual rate hikes, members also displayed concern regarding the yield curve and effects of tariffs.
Intraday, local H4 support at 1.3130 continues to provide a floor in this market, in spite of another dip beneath this barrier to lows of 1.3115. A violation of this level today would likely place the 1.31 handle in the firing range. Continued support, on the other hand, has the 1.32 handle to target.
The story on the bigger picture, however, places the market in a somewhat bearish setting. After slicing through the top edge of a weekly supply at 1.3347-1.3210 and completing a three-drive formation (see black arrows), further selling is a strong possibility. In addition to this, daily price shows the next support target does not come into view until 1.3001 – effectively the key figure 1.30.
Areas of consideration:
Having seen higher-timeframe structure imply selling, buying off the local H4 support mentioned above at 1.3130 is chancy. The most traders should expect off this level is 1.32.
To the downside, selling beneath 1.3130 places one in an uncomfortable position owing to the 1.31 handle seen nearby. As such, shorts would only be considered valid on a H4 close beneath 1.31, targeting July’s opening level at 1.3045, followed then by 1.30 handle, which, as we already know, also represents daily support.
Today’s data points: US and Canadian job’s figures; CAD Ivey PMI.
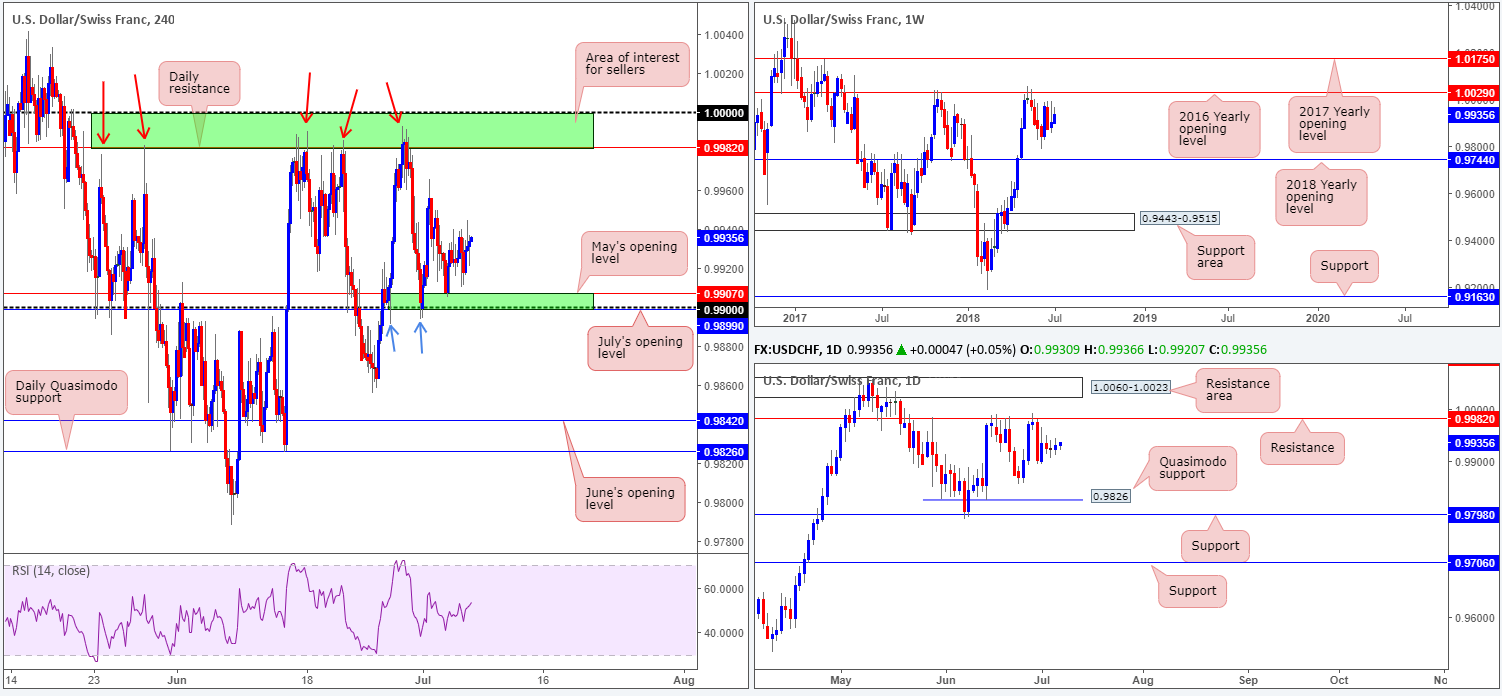
USD/CHF:
Buyers and sellers, once again, struggled to find direction in recent trade, as volume remains thin. Aside from a fresh high of 0.9944, there’s very little to report in terms of technical structure. Therefore, the following report will echo thoughts put forward in yesterday’s analysis…
To the downside on the H4 timeframe, we have May’s opening level at 0.9907, shadowed closely by the 0.99 handle and July’s opening level at 0.9899. Overhead, we do not see a whole lot to write home about until we reach 0.9982: a daily resistance located just south of the key figure 1.0000 (parity).
Areas of consideration:
In view of the history surrounding the upper green H4 zone at 1.0000/0.9982 (parity/daily resistance – see red arrows), this is likely an area of interest for sellers. We would, however, strongly recommend waiting for H4 price to confirm bearish intent (a full or near-full-bodied bearish candle would suffice) before pulling the trigger, as weekly bulls could enter the fray and pull price towards its next upside level at 1.0029: the 2016 yearly opening level.
Another area to take into account is the lower green H4 zone at 0.99/0.9907 (round number/May open level) for a possible bounce higher. As the zone covers only a small area, though, traders will need to prepare themselves for a possible fakeout lower (similar to what we’ve already seen [blue arrows]). With this being the case, it might be best to wait for H4 price to confirm intent before pressing the buy button (a full or near-full-bodied bullish candle).
Today’s data points: US job’s figures.
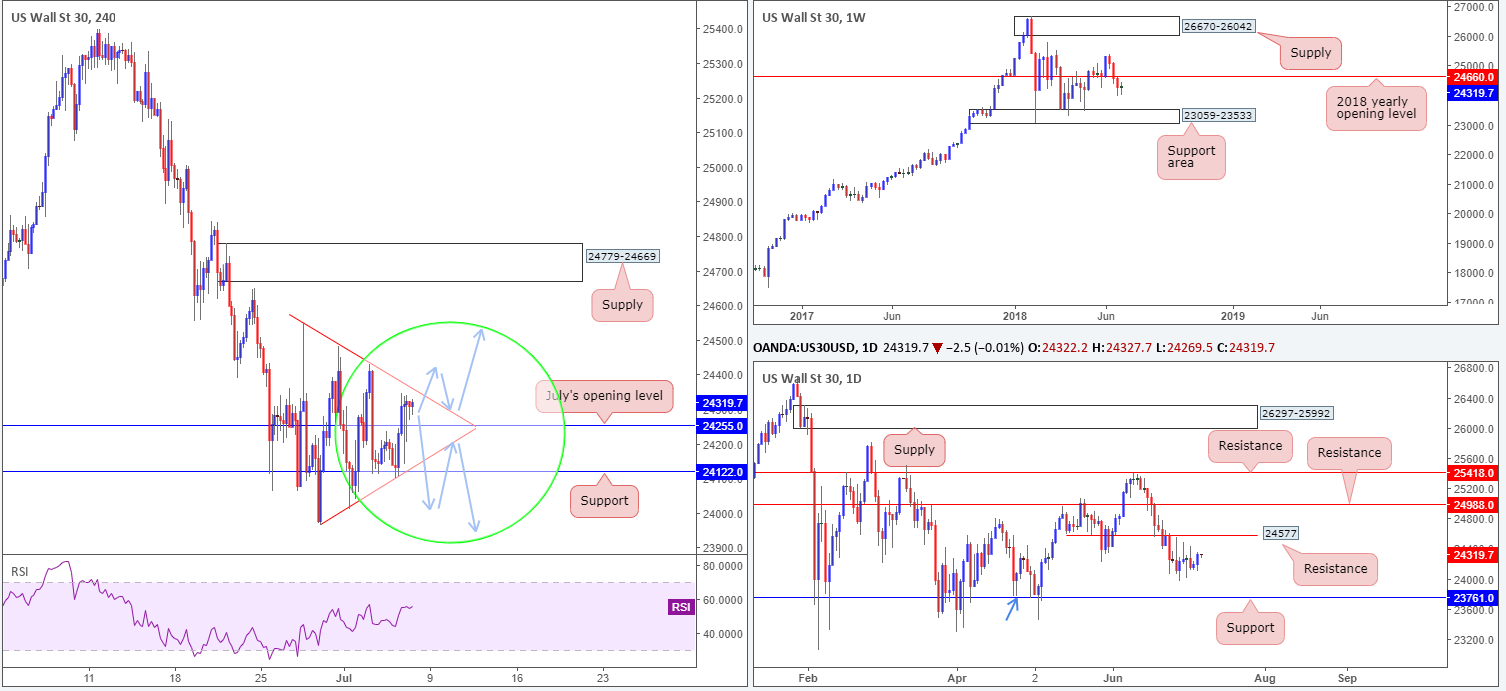
Dow Jones Industrial Average:
Led by the technology sector, the DJIA propelled itself higher on Thursday. Using H4 support at 24122, the index managed to climb above nearby H4 resistance in the shape of July’s opening level at 24255. Also worthy of note on the H4 scale is the clear bearish pennant formation in view (24549/23963). This pattern may be altered today, though, as we head into the US job’s report!
Looking at the bigger picture, we can see weekly price appears somewhat indecisive at the moment. Hovering beneath the 2018 yearly opening level at 24660, further downside from this point would likely bring the unit towards the support area at 23059-23533. Daily movement, on the other hand, continues to linger between resistance at 24577 and support coming in at 23761. Note this support base also represents a daily Quasimodo support shown marked with a blue arrow.
Areas of consideration:
On the face of it, we do not foresee H4 price action breaching the current pennant formation ahead of today’s US job’s release. With that being the case, the team has noted to be patient. Assessing price action after the event has had its time in the spotlight could lead to a break/retest play in either direction, as highlighted on the H4 chart with blue arrows.
Today’s data points: US job’s figures.
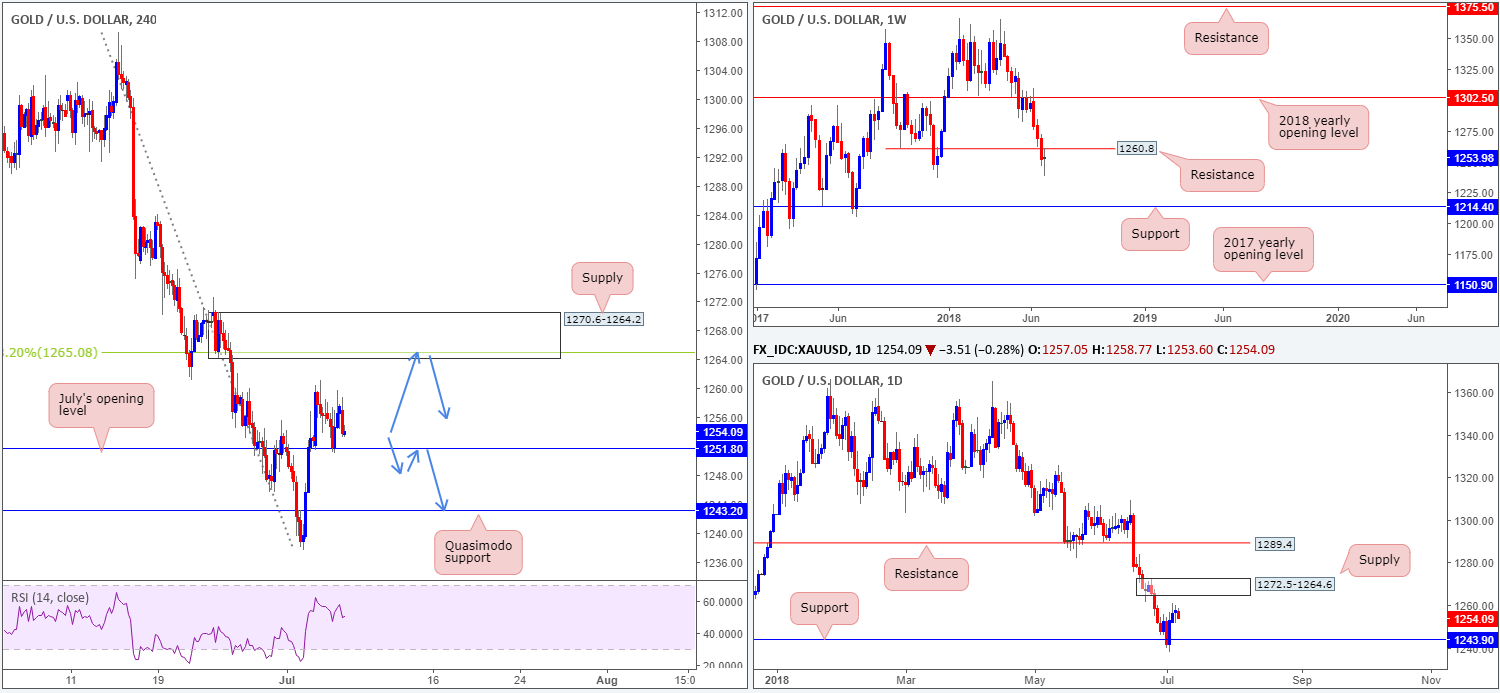
XAU/USD (Gold):
As is evident from the H4 timeframe this morning, price action retested July’s opening level at 1251.8 as support and held ground on Thursday. This was a noted level to look for longs from, but only if the unit printed a full or near-full-bodied H4 bull candle, which it didn’t. A second retest – a third if you include the initial pullback after the break higher – is a chancy move, in our opinion, even with a H4 confirming candle. Overhead, however, it is still worth noting the H4 supply zone at 1270.6-1264.2. What we like about this area is it houses a 38.2% H4 Fib resistance value at 1265.0, and is encapsulated within daily supply at 1272.5-1264.6.
Over on the weekly timeframe, bullion tested the underside of a broken weekly Quasimodo support at 1260.8 (now marked as resistance) in recent trade, likely to weigh on buyers. Further to this, daily candles are seen approaching daily supply mentioned above at 1272.5-1264.6.
Areas of consideration:
According to our read above, there is a somewhat bearish vibe in this market right now. As such, we have two potential scenarios to keep eyeballs on this morning:
- Watch for H4 price to close beneath July’s opening level at 1251.8 and look to play the retest. Waiting for a H4 bearish candle (preferably full or near-full-bodied) to form to confirm the retest is an option, targeting daily support at 1243.9/H4 Quasimodo support at 1243.2.
- Potential shorting opportunities out of the H4 supply zone mentioned above at 1270.6-1264.2. In light of the confluence involved with this zone (see above in bold), trading this area without additional candle confirmation is possible – stops placed above the top edge at 1270.6.
As a reminder, though, traders, we have the mighty NFP report scheduled for release later on today, which could overshadow the technicals!
The use of the site is agreement that the site is for informational and educational purposes only and does not constitute advice in any form in the furtherance of any trade or trading decisions.
The accuracy, completeness and timeliness of the information contained on this site cannot be guaranteed. IC Markets does not warranty, guarantee or make any representations, or assume any liability with regard to financial results based on the use of the information in the site.
News, views, opinions, recommendations and other information obtained from sources outside of www.icmarkets.com.au, used in this site are believed to be reliable, but we cannot guarantee their accuracy or completeness. All such information is subject to change at any time without notice. IC Markets assumes no responsibility for the content of any linked site. The fact that such links may exist does not indicate approval or endorsement of any material contained on any linked site.
IC Markets is not liable for any harm caused by the transmission, through accessing the services or information on this site, of a computer virus, or other computer code or programming device that might be used to access, delete, damage, disable, disrupt or otherwise impede in any manner, the operation of the site or of any user’s software, hardware, data or property.


