
Key risk events today:
OPEC-JMMC Meetings; Canada Employment Change and Unemployment Rate; US Average Hourly Earnings m/m; US Non-Farm Employment Change; US Unemployment Rate; US Prelim UoM Consumer Sentiment.
EUR/USD:
(Italics represents previous writing).
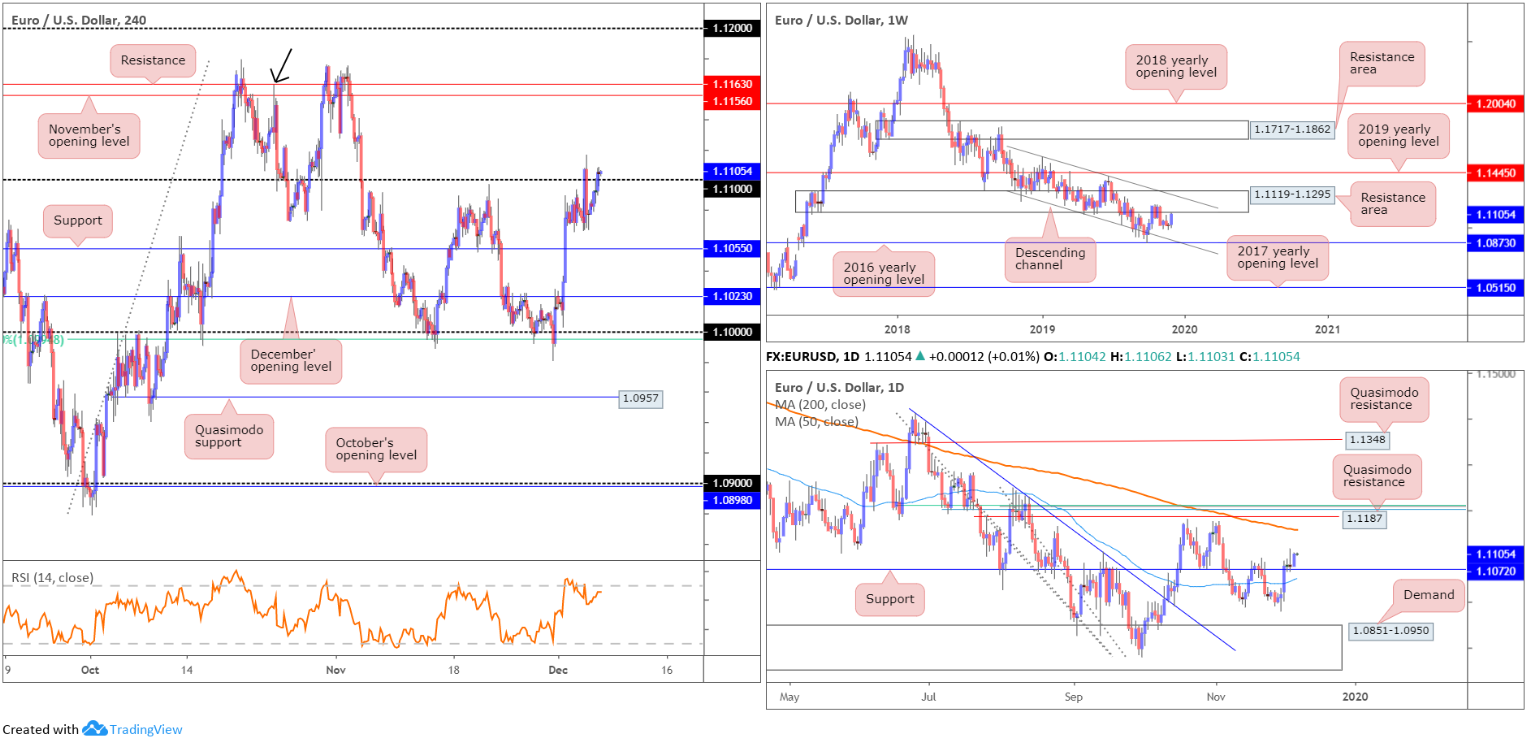
Leaving behind Wednesday’s pullback, EUR/USD re-entered bullish territory Thursday and reclaimed 1.11+ status. The buck, according to the US dollar index, continued to fall on the week, dethroning 97.50 to lows of 97.36.
As sellers face liquidation around the 1.11 point, traders’ crosshairs are likely fixed on H4 resistance coming in at 1.1163, closely shadowed by November’s opening value at 1.1156. Note 1.1156 also represents a Quasimodo resistance (black arrow).
Supporting further upside, daily price chalked up a near-full-bodied bullish candle yesterday, a few points north of support at 1.1072. Continued bidding could push price as far north as the 200-day SMA (orange – 1.1157), closely trailed by Quasimodo resistance at 1.1187. Traders may also want to acknowledge the close relationship that exists between the said SMA and the aforementioned H4 resistances.
Technical research based on the weekly timeframe, however, shows the pair trading at the underside of a long-standing resistance area at 1.1119-1.1295. Since November 2018, the pair has also remained compressed within a descending channel, moulded from a high set at 1.1569 and a low of 1.1109. Based on this scale, support is not expected to emerge until the lower boundary of the descending channel, which happens to merge closely with the 2016 yearly opening level at 1.0873. In addition to structure, the primary downtrend has been in motion since topping in early 2018 at 1.2555.
Areas of consideration:
According to the technical picture presented above, price appears to be at a crossroads. H4 and daily structure suggests further buying could be in store, whereas weekly price indicates a bearish vibe.
Although 1.11 is currently serving as support and has likely enticed buyers into the market, the close above the number is fragile, spanning no more than 4 points. Conservative buyers in this market, therefore, may wait for Wednesday’s high at 1.1116 to give way before attempting to enter long, targeting 1.1163/1.1156. Ideally, a break of 1.1116, followed up with an additional retest at 1.11 in the shape of a H4 bullish candlestick signal, would likely prove more favourable.
Longer term, as long as daily support at 1.1072 remains intact, buyers likely have the upper hand.
GBP/USD:
(Italics represent previous writing).
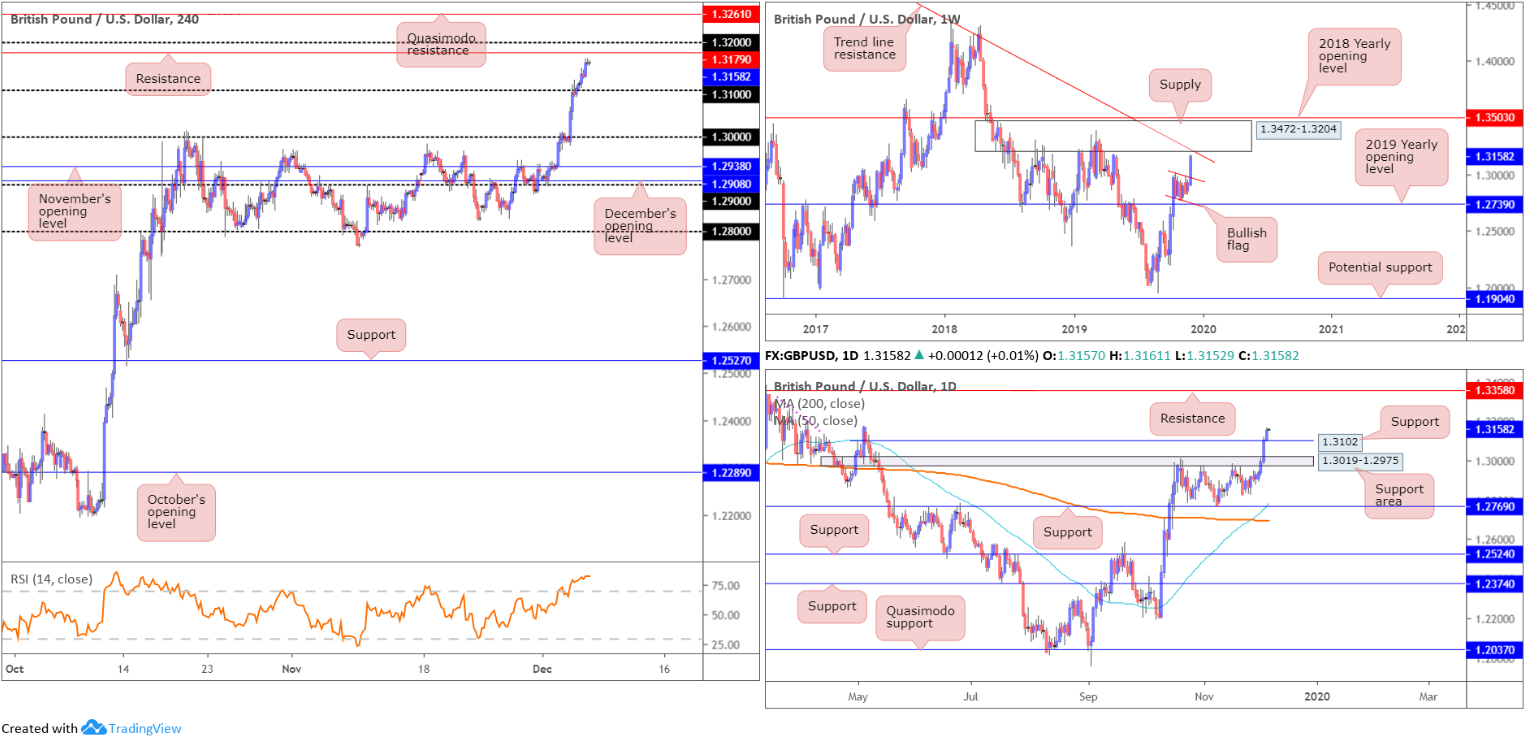
The British pound continued to flex its financial muscle against the US dollar Thursday, ascending to a fresh peak of 1.3166 and adding 0.41%. Underpinned by a clear Tory lead on Labour, with latest polls maintaining the differential at 10 points, GBP/USD trades at approximately 2.00% on the week.
Since breaking through the top edge of a bullish flag, based on the weekly timeframe, the pair has emphasised an upbeat tone. Momentum, however, may slow today/early next week as we close in on supply at 1.3472-1.3204, which happens to converge with a long-term trend line resistance, etched from the high 1.5930.
Interestingly, though, the daily picture shows promise to the upside. After violating Quasimodo resistance at 1.3102 (now a serving support), limited supply is seen on this timeframe until reaching resistance coming in at 1.3358. The pink line plotted to the left of price denotes what appears to be consumed supply.
Across the page on the H4 timeframe, 1.31 now stands as support, with the candles fast approaching resistance drawn from 1.3179, positioned close by the round number 1.32. A break of here exhibits scope for an approach towards Quasimodo resistance at 1.3261. Indicator-based traders may also wish to acknowledge the relative strength index (RSI) is seen trading high within overbought territory.
Areas of consideration:
With the 1.32 handle on the H4 timeframe boasting a close relationship with the underside of weekly supply at 1.3204, active sellers likely reside around this region. A pullback from here could see 1.31 re-enter the fight, which merges closely with daily support plotted at 1.3102. Should 1.32 make an appearance today and produce a H4 bearish candlestick signal, that may be enough for countertrend traders to pull the trigger.
A decisive close north of 1.32, on the other hand, shows the unit may be headed for H4 Quasimodo resistance at 1.3261, with the possibility of reaching as far north as daily resistance at 1.3358.
AUD/USD:
(Italics represent previous writing).
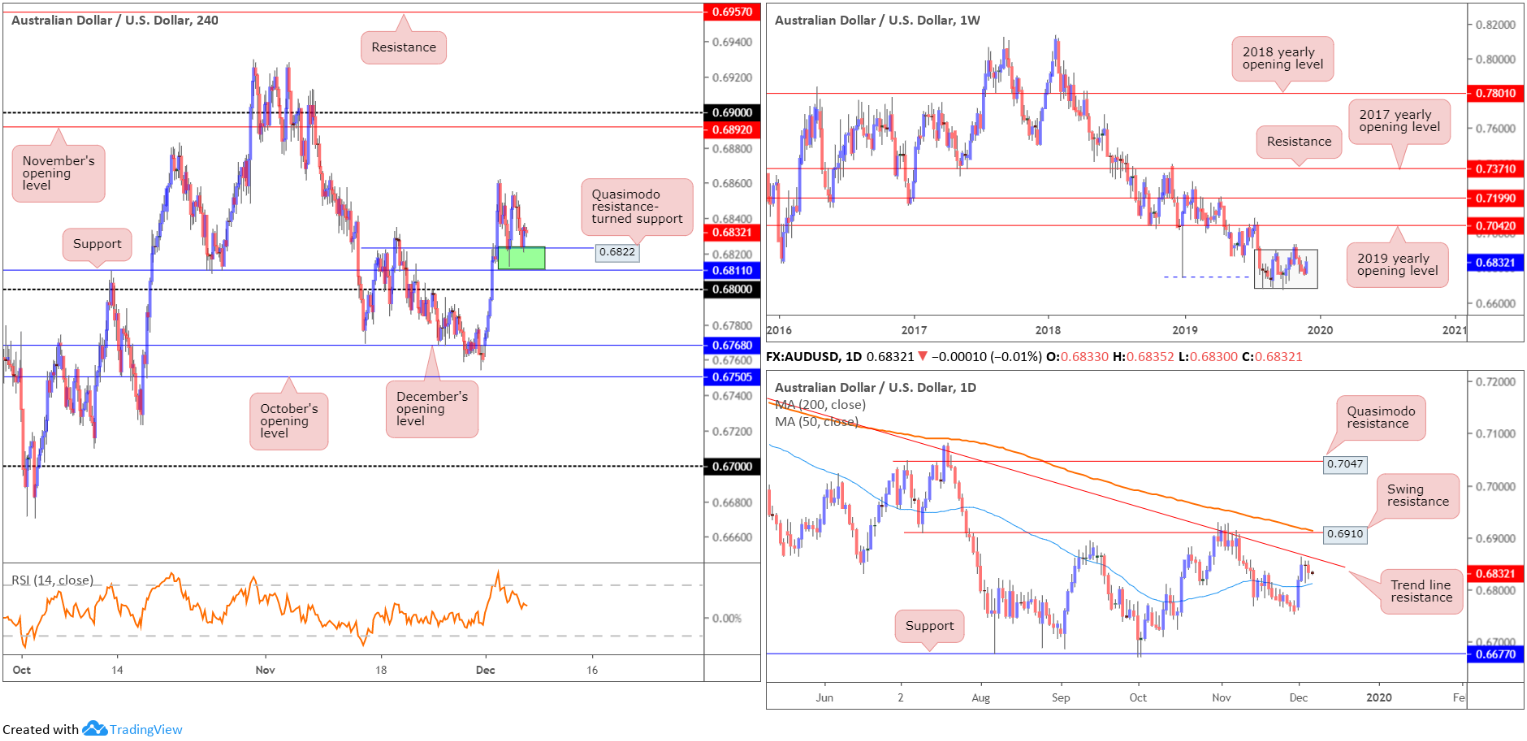
Disappointing Australian retail sales and trade balance data exerted fresh downside pressure on AUD/USD in early trade Thursday. In seasonally adjusted terms, the balance on goods and services was a surplus of $4,502m in October 2019, a decrease of $2,345m on the surplus in September 2019, according to the Australian Bureau of Statistics.
Technically, the H4 candles remain buoyed by an interesting area of support between 0.6811/0.6822 (green). Although holding ground, price has failed to reach fresh weekly peaks. Upside from here is likely hampered by daily price, hovering just south of trend line resistance, extended from the high 0.7393. A break of the daily trend line exposes a swing resistance seen at 0.6910, which, as you can see, aligns closely with the next upside targets on the H4 timeframe at the 0.69 handle, and November’s opening value at 0.6892.
With respect to the weekly timeframe, the unit remains within the walls of its current range between 0.6894/0.6677 (light grey). The primary downtrend, visible from this timeframe, has also been in play since early 2018.
Areas of consideration:
As weekly price denotes a somewhat indecisive tone, and daily price is seen ranging between a trend line resistance and the 50-day SMA (blue – 0.6812), buying from the current H4 support area lacks confluence. In fact, a whipsaw beneath this zone to 0.68 is a possibility. This would run stop-loss orders generated from buyers and provide liquidity for longs out of 0.68. To take advantage of this intraday move, this would likely entail drilling down to the lower timeframes to find an entry – a lower-timeframe bullish candlestick signal printed from 0.68 could serve as a trigger, for example.
USD/JPY:
(Italics represent previous writing).
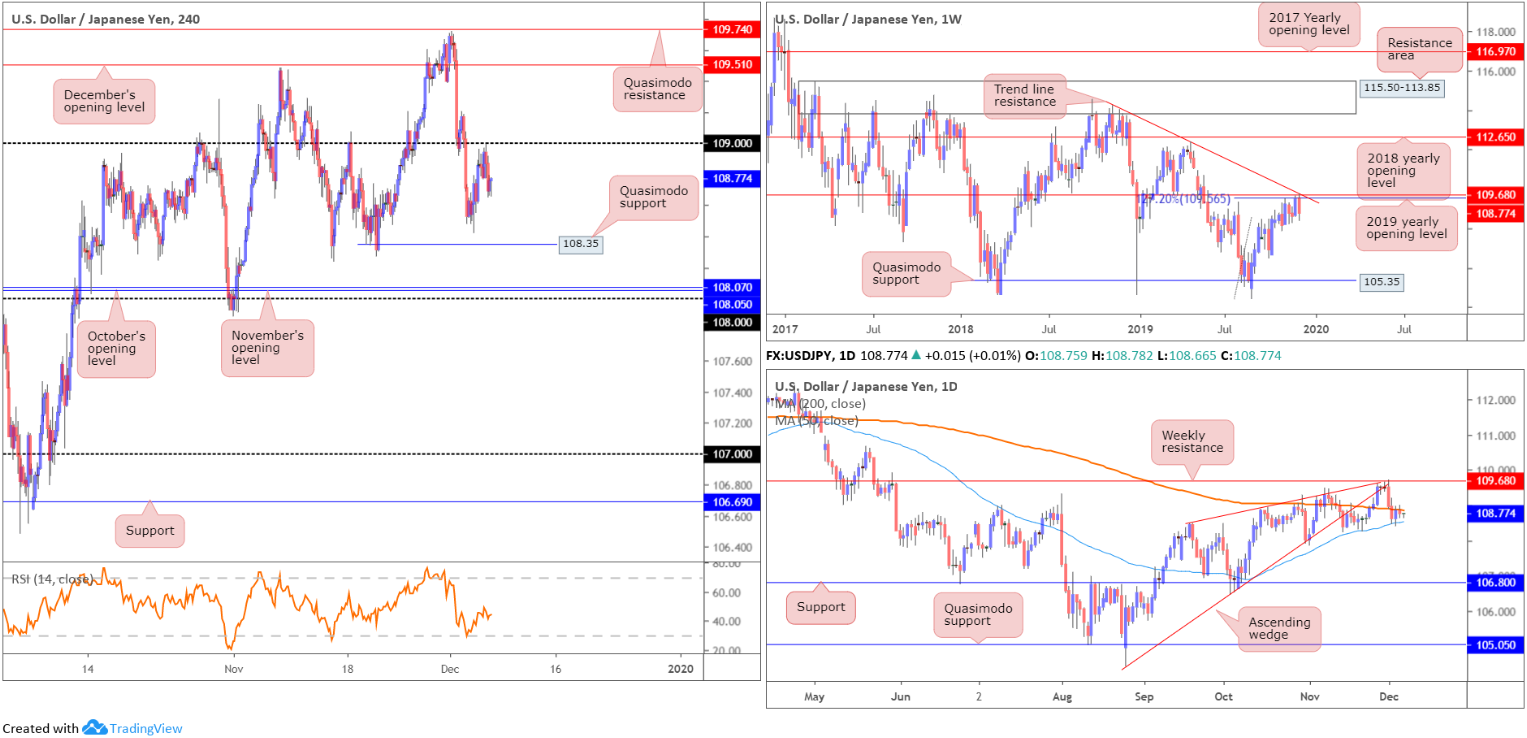
USD/JPY flows remain steady as we head into Friday’s segment, holding south of the 109 handle on the H4 timeframe. Risk appetite was reasonably solid into yesterday’s close on Wall Street, with trade talks dominating the market’s theme. Further selling from current price has Quasimodo support at 108.35 to target, closely shadowed by the 108 handle and November and October’s opening levels at 108.05 and 108.07, respectively.
The technical landscape on the weekly timeframe exhibits robust resistance in play around the 109.68 neighbourhood, a 127.2% Fibonacci ext. point at 109.56 (taken from the low 104.44) and trend line resistance, extended from the high 114.23.
A closer reading on the daily timeframe has the candles sandwiched between the 200-day SMA (orange – 108.85) and the 50-day SMA (blue – 108.53). Areas outside of this range can be seen around weekly resistance mentioned above at 109.68, and daily support coming in from 106.80.
Areas of consideration:
Although weekly price suggests further losses could on the cards, entering short in this market while daily price is in a phase of consolidation between the two said SMAs is likely to deter many traders. Once, or indeed if, a daily close south of the 50-day SMA occurs, technical selling will likely weigh on market movement. This could potentially be actionable next week.
H4 traders, however, may opt to wait until 108 gives way, as limited support is evident south of this barrier until shaking hands with 107. This leaves ample room to reduce risk to breakeven and collect favourable risk/reward.
USD/CAD:
(Italics represent previous writing).
The Canadian dollar continued to trade firm Thursday, following Wednesday’s hawkish BoC. The Canadian economy also experienced a narrower-than-expected trade deficit in the month of October, at 1.08bln vs. the expected 1.37bln.
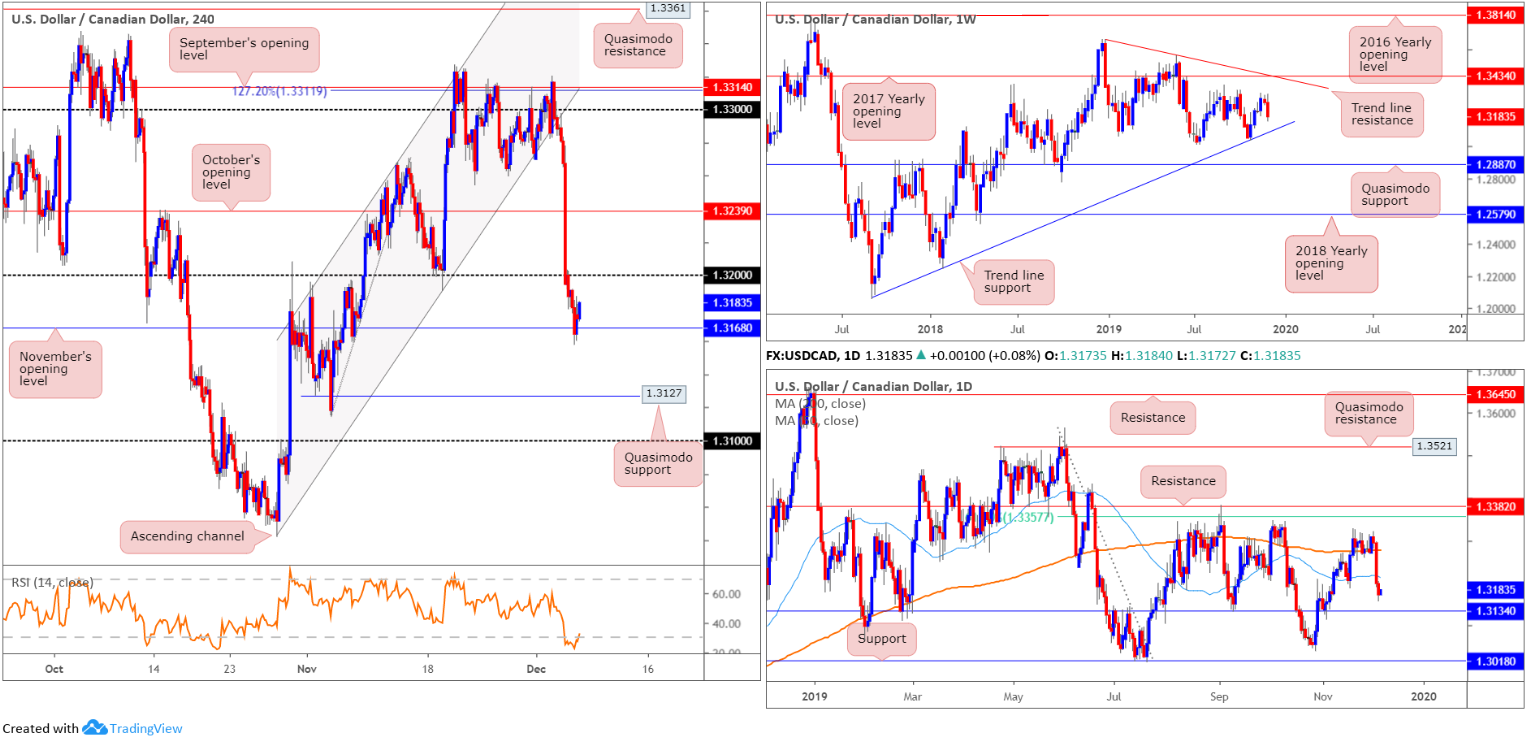
USD/CAD, as can be seen from the H4 timeframe, established support off November’s opening level at 1.3168 in recent trade, which may prompt a retest at the underside of 1.32. Beneath 1.3168, Quasimodo support lies in wait around the 1.3127 region, closely shadowed by the 1.31 handle. In addition to this, the relative strength index (RSI) is seen treading water within oversold territory.
On a wider perspective, we have daily support lurking close by at 1.3134 – a level that holds significant history as a support. South of this angle, support falls in around the 1.3018 neighbourhood. Also of interest, weekly price is closing in on trend line support, extended from the low 1.2061.
Areas of consideration:
Despite the mild recovery off 1.3168, this level, according to the higher-timeframe picture, is likely to give way, potentially opening intraday bearish scenarios to at least 1.3134, the daily support level. A H4 close south of 1.3168, preferably followed up with a lower-timeframe retest by way of a bearish candlestick signal, would likely be enough to entice intraday sellers into the market.
USD/CHF:
(Italics represent previous writing).
The US dollar concluded a shade lower against the Swiss franc Thursday, erasing 16 points, or 0.17%. Given the somewhat lacklustre performance yesterday, much of the following piece will exhibit thoughts put forward in Thursday’s technical briefing.
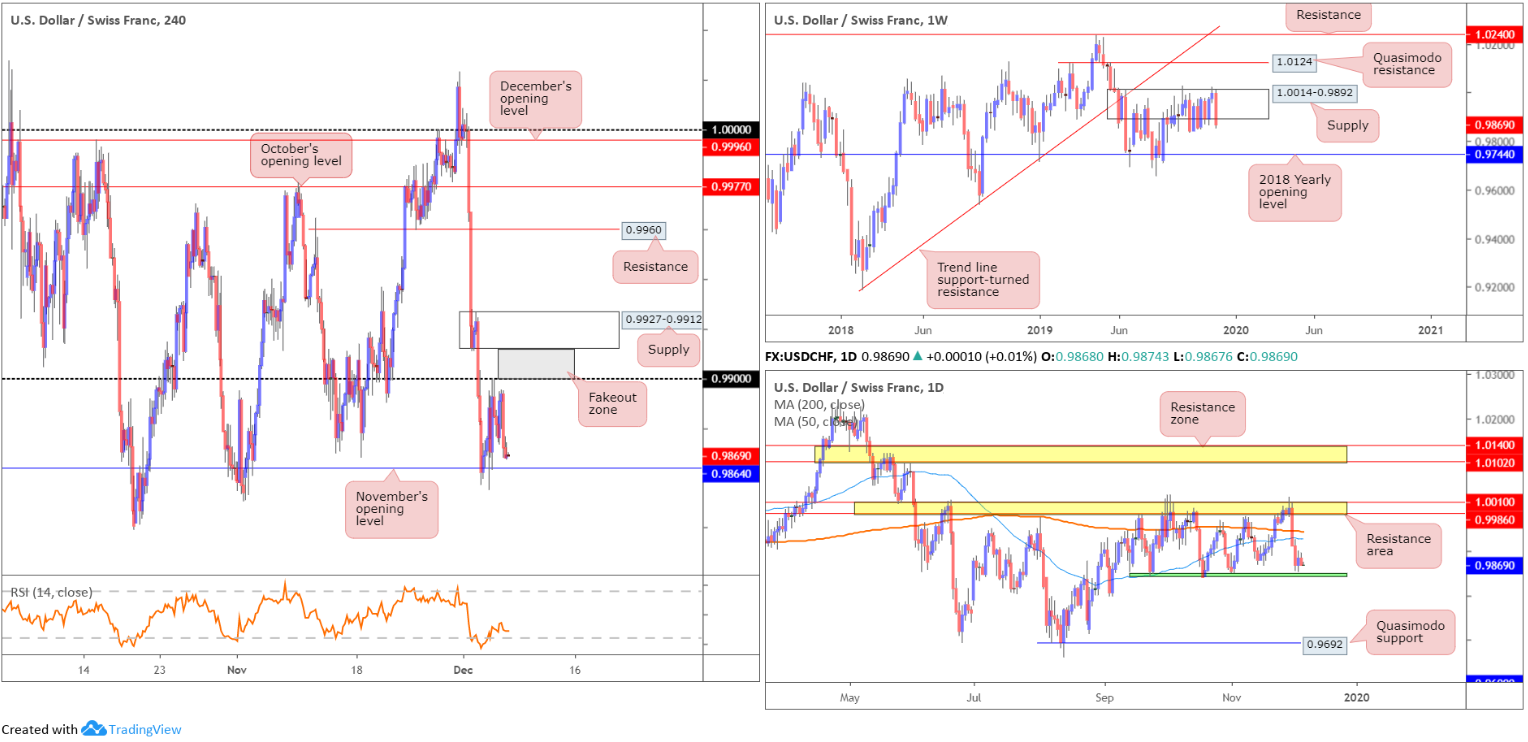
With support plotted nearby at November’s opening level at 0.9864 and resistance falling in around the 0.99 handle, a H4 range between these two barriers appear to be developing. Outside of this potential consolidation, we have fresh supply positioned at 0.9927-0.9912 and the round number 0.98 offering potential support (not visible on the screen).
On more of a broader viewing, since mid-September, daily price has been busy carving out a consolidation between support around the 0.9845ish region (green) and a resistance area at 1.0010/0.9986. Yesterday saw the unit settle at the lower end of the said range.
Technical research based on the weekly timeframe shows the pair remains consolidating within the walls of a supply zone at 1.0014-0.9892, despite whipsawing through the top edge of the said zone on two occasions. A move higher from here has Quasimodo resistance at 1.0124 in sight, followed by resistance at 1.0240 and trend line support-turned resistance, extended from the low 0.9187. To the downside, nevertheless, the 2018 yearly opening level awaits at 0.9744.
Areas of consideration:
A break through the lower edge of the H4 range today may excite intraday sellers, though 0.9845, the lower edge of the daily range, may hamper downside.
A H4 fakeout zone is present between the round number 0.99 and H4 supply at 0.9927-0.9912. It is common knowledge stop-loss orders congregate around psychological levels. Therefore, a break through 0.99 will trip buy stops from not only sellers attempting to fade 0.99, but also those attempting to catch the breakout. This provides liquidity for bigger players to sell into from the noted supply and bring price lower. As such, the current supply area remains a worthy contender for any technician’s watchlist.
Dow Jones Industrial Average:
(Italics represent previous writing).
US equities wrapped up Thursday modestly higher across the board, as traders monitored the latest news from the US/China trade negotiations. The Dow Jones Industrial Average added 28.01 points, or 0.10%; the S&P 500 advanced 4.67 points, or 0.15% and the tech-heavy Nasdaq 100 added 11.87 points, or 0.14%.
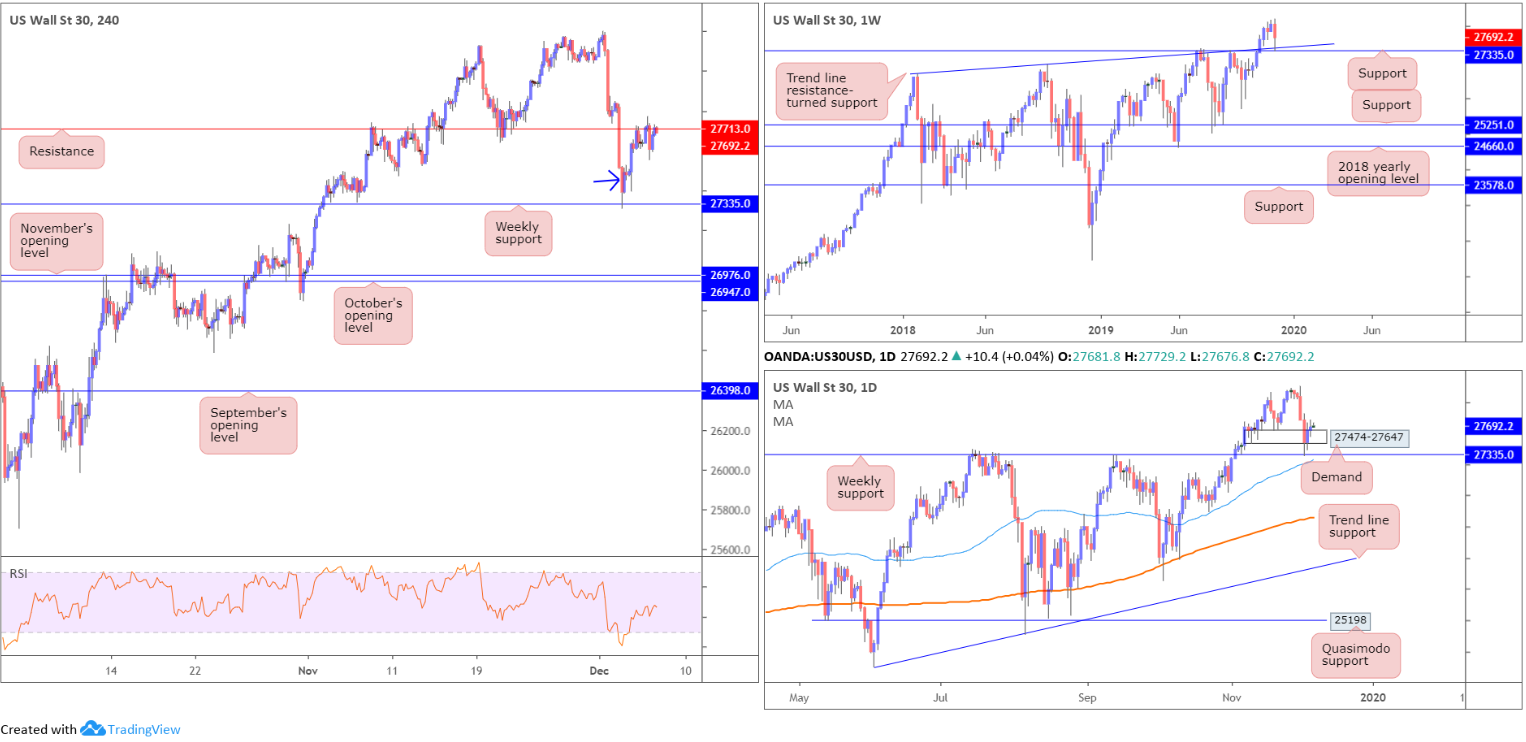
Technical research positions the H4 candles around the underside of resistance at 27713. In light of the recent lacklustre movement, those who read recent reports you may recall the following pieces:
Wednesday’s technical briefing highlighted the possibility of further buying, following weekly price retesting support coming in at 27335, which happens to align closely with trend line resistance-turned support, extended from the high 26670.
Lower on the curve, daily demand at 27474-27647 also suffered a raw whipsaw in recent movement, likely tripping sell stops. As you can see, price action drove through orders at the said demand to collect weekly buyers at the noted support level.
With weekly support also serving as a ‘floor’ on the H4 timeframe, coupled with H4 price forming an inside candlestick formation (blue arrow), price rallied and touched gloves with H4 resistance at 27713.
Areas of consideration:
Buying the said H4 inside candle pattern was noted as a possible entry long into this market, targeting the said H4 resistance. Well done to any readers who managed to jump aboard this move. Reducing risk to breakeven and removing a portion of the position off the table is certainly an option now. Leaving a slice of the position running is also something to consider, given both weekly and daily timeframes exhibit scope to explore higher ground.
XAU/USD (GOLD):
(Italics represent previous writing).
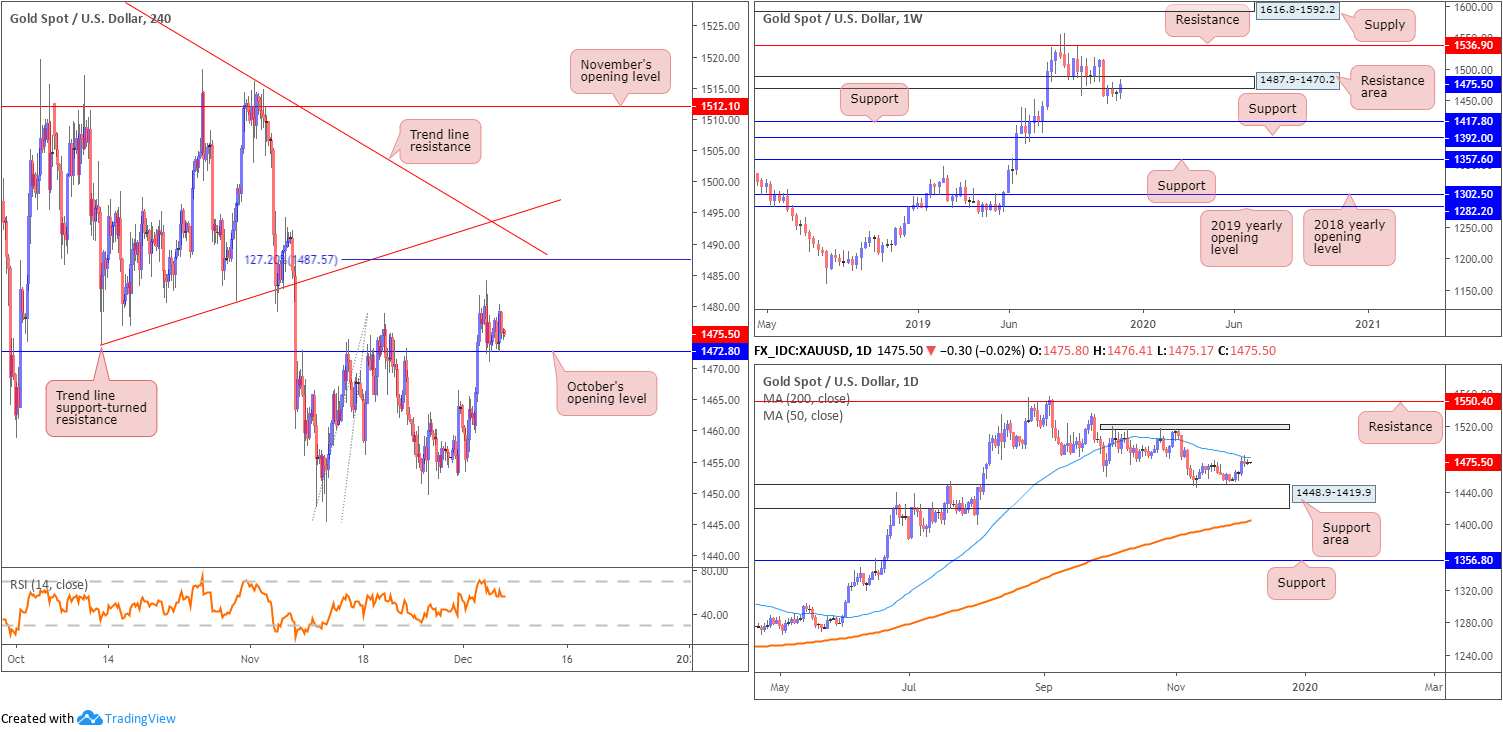
XAU/USD spot finished Thursday pretty much unmoved, reinforced by H4 support at 1472.8: October’s opening level.
After scoring a fresh weekly high at 1484.1, bullion turned lower and retested October’s opening level. As evident from the chart, the pair remains stable off 1472.8, which could prompt a run higher today, targeting Wednesday’s high, followed by a 127.2% Fibonacci ext. point at 1487.5, closely shadowed by two converging trend line resistances (1473.8/1557.1).
Higher-timeframe movement reveals daily price tested the underside of a 50-day SMA (blue – 1482.2) and has held ground. This follows a rebound from nearby support area coming in at 1448.9-1419.9. Should buyers overthrow the said SMA, tops sited around the 1518.8 point are in view.
The story on the weekly timeframe reveals price action driving higher into a resistance area at 1487.9-1470.2. Note the top edge of this zone coincides closely with the two aforementioned H4 trend line resistances.
Areas of consideration:
Entering long from H4 support at 1472.8, although appealing on this scale, faces resistance both on the weekly timeframe out of 1487.9-1470.2, and also the 50-day SMA on the daily timeframe.
Assuming the higher-timeframe picture represents an accurate view, a H4 close south of 1472.8 could be a move worth keeping an eye out for. A H4 close beneath this base could be enough to drag price towards the top edge of the current daily support area at 1448.9. Conservative traders, however, may opt to wait and see if a retest at the underside of 1472.8 occurs, before pulling the trigger. This helps recognise seller intent and offers traders entry and risk levels to work with.
The accuracy, completeness and timeliness of the information contained on this site cannot be guaranteed. IC Markets does not warranty, guarantee or make any representations, or assume any liability regarding financial results based on the use of the information in the site.
News, views, opinions, recommendations and other information obtained from sources outside of www.icmarkets.com.au, used in this site are believed to be reliable, but we cannot guarantee their accuracy or completeness. All such information is subject to change at any time without notice. IC Markets assumes no responsibility for the content of any linked site.
The fact that such links may exist does not indicate approval or endorsement of any material contained on any linked site. IC Markets is not liable for any harm caused by the transmission, through accessing the services or information on this site, of a computer virus, or other computer code or programming device that might be used to access, delete, damage, disable, disrupt or otherwise impede in any manner, the operation of the site or of any user’s software, hardware, data or property.


