
EUR/USD:
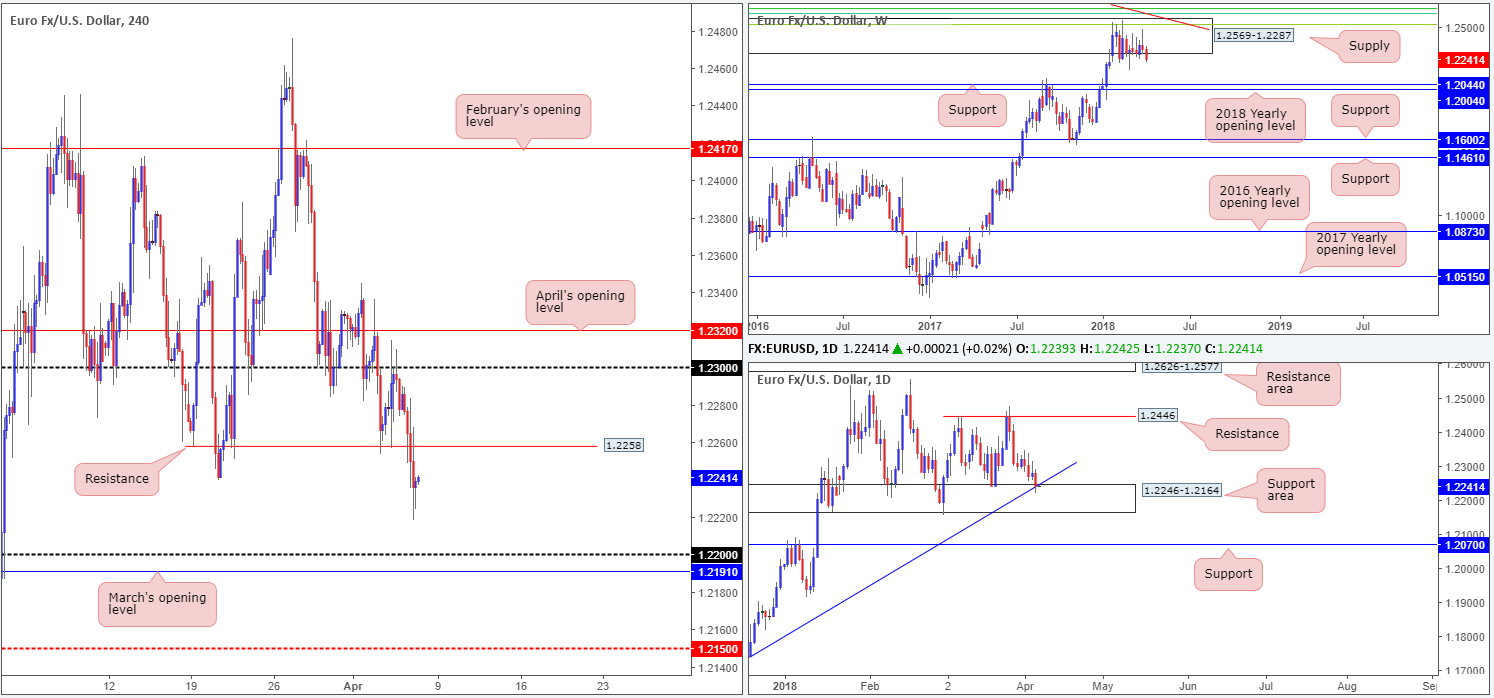
The US dollar advanced against the majority of its G10 peers on Thursday. This – coupled with a string of less-than-stellar economic releases out of the Eurozone – pressured the euro to lower ground. H4 support at 1.2258 and the March 20 low at 1.2240 were breached. It was only once we entered US trade did we see the H4 candles begin to stabilize off lows of 1.2218.
In terms of the higher timeframes, weekly price is seen reflecting a reasonably strong bearish note at the moment. Price recently exited beyond the lower edge of a major-league weekly supply at 1.2569-1.2287, which has held price captive since late January. Downside targets from this angle fall in around the weekly support band at 1.2044, shadowed closely by the 2018 yearly opening level at 1.2004. On the other side of the field, nevertheless, daily movement recently checked in with a daily support area coming in at 1.2246-1.2164 that communicates beautifully with a long-term daily trend line support etched from the low 1.0569. This area, like the weekly supply zone, has also capped market action since late January. Technically speaking, this is likely the reason behind support being found on the H4 timeframe during US trading yesterday.
Potential trading zones:
Medium/long-term moves are somewhat restricted given weekly flow suggesting lower prices and daily action looking to cement another rebound from its daily support area.
As we head into NFP Friday, Short-term plays will likely be governed by the recently engulfed support at 1.2258 as a potential resistance, as well as the 1.22 handle and March’s opening level at 1.2191 as possible supports. Traders might also want to note that both H4 supports are positioned within the walls of the current daily support area.
Data points to consider today: US job’s figures; Fed Chair Powell speech.
GBP/USD:
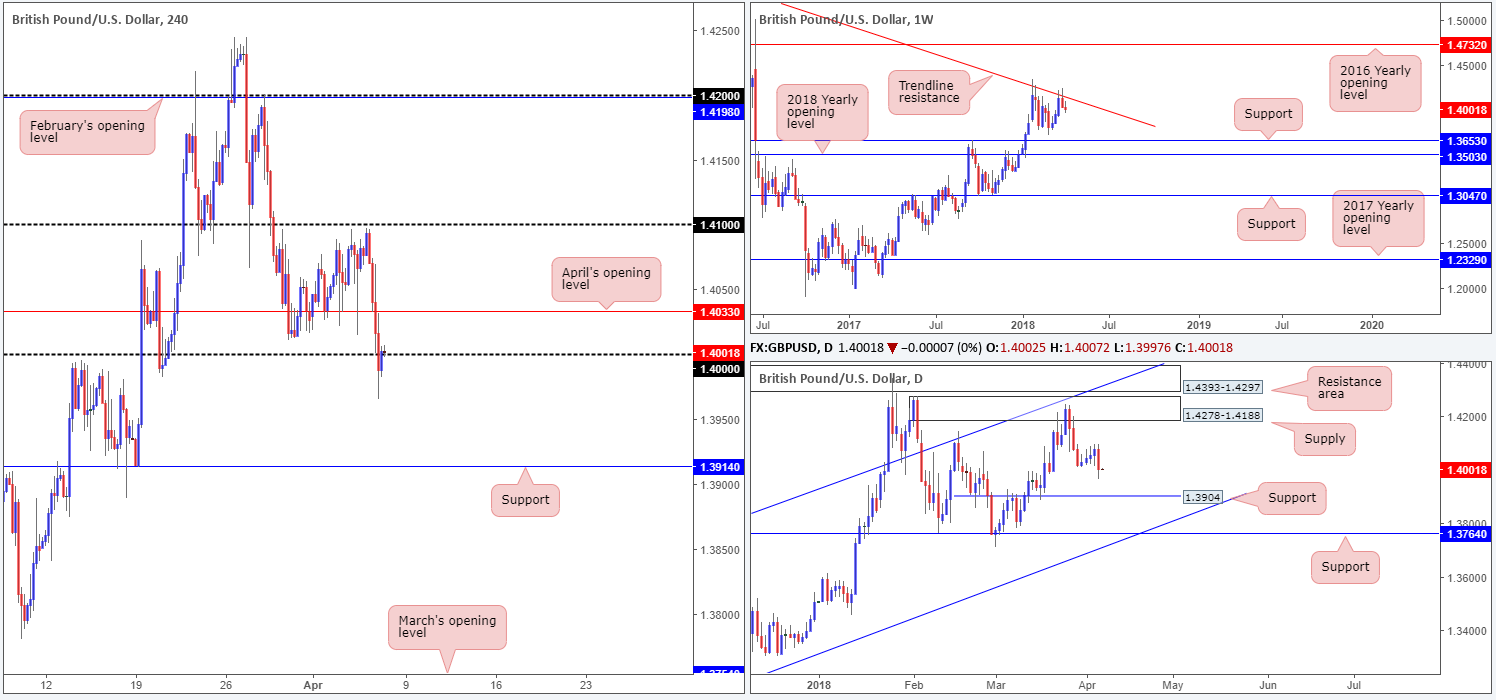
On the back of a stronger US dollar and a disappointing UK services PMI (tumbled to an almost two-year low), the British pound was hit with some relatively heavy selling on Thursday. April’s opening level seen on the H4 timeframe at 1.4033 initially rebounded price amid early London hours (see M30 chart for a clearer picture). Upon cracking this level, however, the path south was free to challenge the key figure 1.40, and challenge it did! Aggressively punching to a session low of 1.3965, we feel it is safe to say that a large portion of stop-loss orders beneath 1.40 have been triggered. In the event that 1.40 fails to hold ground, the next port of call seen below can be found at 1.3914.
Weekly movement is seen trading blows with a weekly trend line resistance taken from the high 1.5930. Having seen this line force price in excess of 500 pips lower in early January, there’s a chance we may see history repeat itself here. On the other side of the spectrum, daily flow, following yesterday’s selloff, appears to be eyeing the daily support level at 1.3904.
Potential trading zones:
Although the 1.40 figure is trying its upmost to hang in there, we feel it may have had its time. Weakened buyers, along with overhead pressure from both weekly and daily structure, are likely to force things lower today.
From a technical perspective, a strong retest seen to the underside of 1.40 in the shape of a full or near-full-bodied H4 bear candle would, in our humble opinion, be enough evidence to suggest a short play, targeting H4 support at 1.3914/daily support at 1.3904. Though, before taking this trade, do bear in mind that today’s action could get messy given NFP action is scheduled for release later on today.
Data points to consider today: BoE Gov. Carney speech; US job’s figures; Fed Chair Powell speech.
AUD/USD:
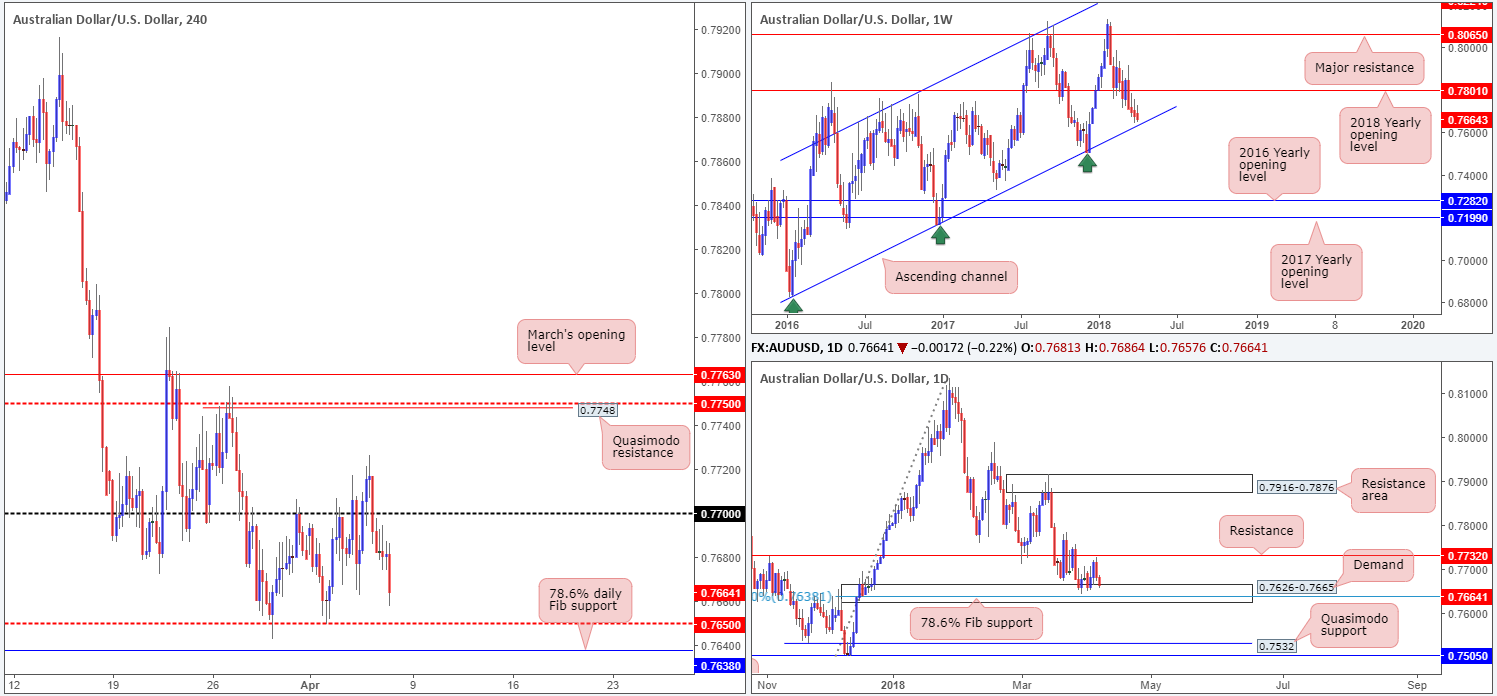
Thursday’s Australian trade balance figure posted a stronger-than-expected surplus in February. The after-effects of this report saw the Australian dollar bid higher, though the move was a relatively short-lived one. Sliding gold prices, along with demand for the greenback, quickly pressured the commodity currency back into negative territory, sub 0.77 on the H4 timeframe.
As of current pricing, the H4 candles are poised to challenge the nearby H4 mid-level support at 0.7650. Although this has held the unit higher on two separate occasions in recent weeks, the 78.6% daily Fib support seen just beneath it at 0.7638 is an incredibly interesting level. Not only is it encapsulated within a daily demand base at 0.7626-0.7665, it also intersects with a long-term weekly channel support taken from the low 0.6827.
Potential trading zones:
As highlighted above, the 78.6% daily Fib support at 0.7638 is of interest. With stop-loss orders plotted beneath the daily demand, a long from 0.7638 could prove to be a reasonably big move owing to the fact that we’re utilizing higher-timeframe areas. With that in mind, the initial upside target falls in at 0.77, followed closely by a daily resistance seen at 0.7732.
Data points to consider today: US job’s figures; Fed Chair Powell speech.
USD/JPY:
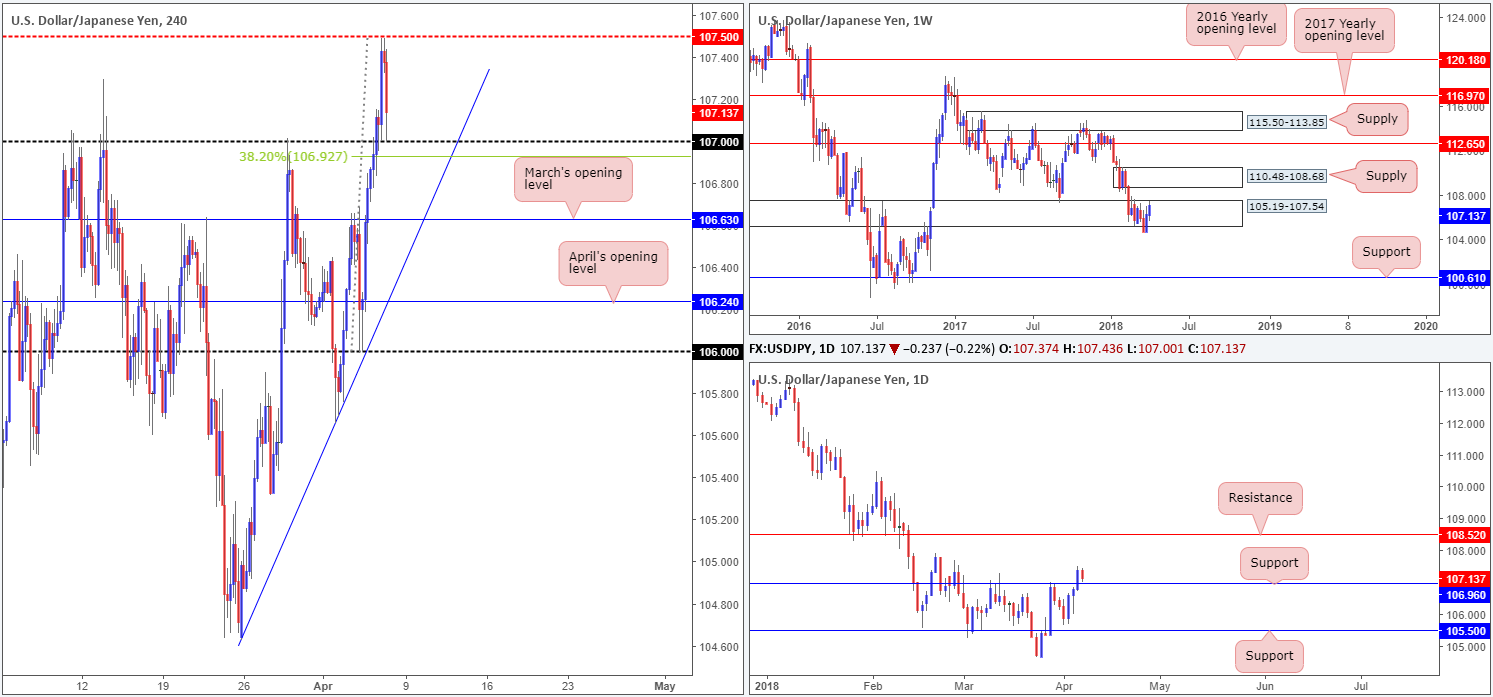
The safe-haven yen, as you can see, sagged under the weight of a reasonably well-bid US dollar on Thursday. Backed by another healthy gain in US equities, the USD/JPY pressed through orders at 107 and eventually clocked a high of 107.49, just shy of the H4 mid-level resistance at 107.50.
In recent hours, however, we’ve seen the pair pullback to the 107 handle amid talks of trade between US and China. 107 (positioned just ahead of a daily resistance-turned support at 106.96), as you can see, though, is currently holding steady.
Elsewhere, daily movement looks primed to retest its recently broken resistance as support at 106.96, while weekly action probes the upper edge of 105.19-107.54. On the weekly timeframe, as of now, it looks as though last week’s rotation back to the upside was the result of a fakeout beneath 105.19-107.54. This could prompt further USD buying and eventually bring the unit up to a weekly supply zone pegged at 110.48-108.68.
Potential trading zones:
From a technical standpoint, the 107 handle is likely to hold firm. Besides having the backing of a daily support nearby at 106.96 (closely linked with a 38.2% H4 fib support at 106.92), further buying is likely on the weekly timeframe.
Ultimately, though, we would like to see some form of additional H4 candle confirmation, before expressing full confidence in 107. A H4 pin-bar formation or a reasonably well-sized H4 rotation candle (full or near-full-bodied form) is preferable.
Data points to consider today: US job’s figures; Fed Chair Powell speech.
USD/CAD:
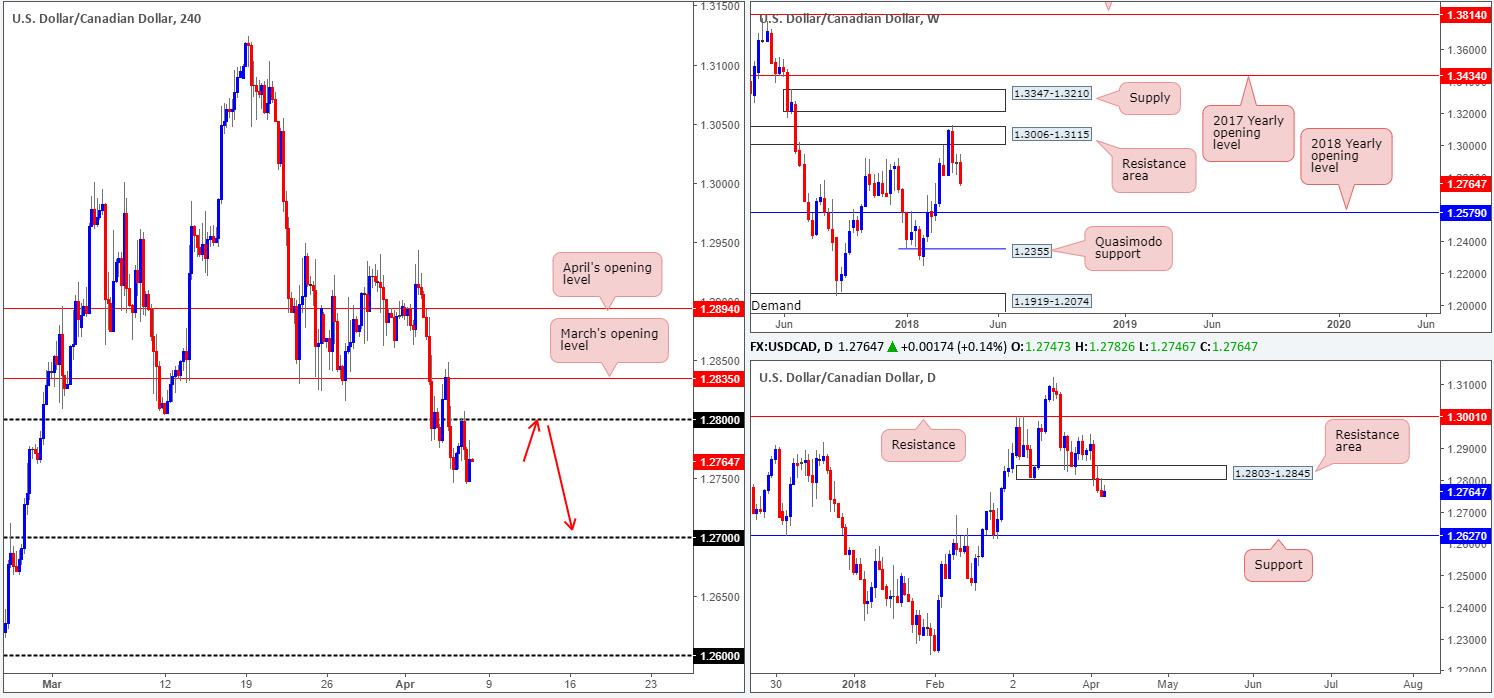
In recent trade, the USD/CAD failed to capitalize on its early move north on Thursday, despite demand for the US dollar. The Canadian dollar continued to ride the positive wind of NAFTA commentary, as the pair faded 1.28 on the H4 timeframe and clocked a fresh low of 1.2744.
Recent movement, as far as we can see, is clear for lower prices. The firm retest of 1.28 has placed 1.27 on the radar for intraday traders, despite price currently bouncing from 1.2750ish right now. On the weekly timeframe, further downside is still very much a strong possibility. Continued selling from current prices shows room to press as far south as the 2018 yearly opening level at 1.2579. Turning the focus over to the daily timeframe, we can see that recent action retested the underside of a recently broken daily demand area at 1.2803-1.2845, in the shape of a nice-looking daily bearish pin-bar formation. The next port of call beyond here can be seen in the shape of a daily support level at 1.2627.
Potential trading zones:
Despite all three timeframes pointing to a decline, there is unfortunately not much to shout about in terms of resistance on the H4 timeframe. A second retest of 1.28 that holds firm, therefore, is of interest (as per the red arrows). However, traders need to keep in mind that today’s US/Canadian employment figures could cause technicals to take a back seat, should you look to short 1.28.
Data points to consider today: US and Canadian job’s figures; CAD Ivey PMI and Fed Chair Powell speech.
USD/CHF:
The US dollar rose against its Swiss counterpart for a fourth consecutive day on Thursday, driven by a stronger dollar across the board.
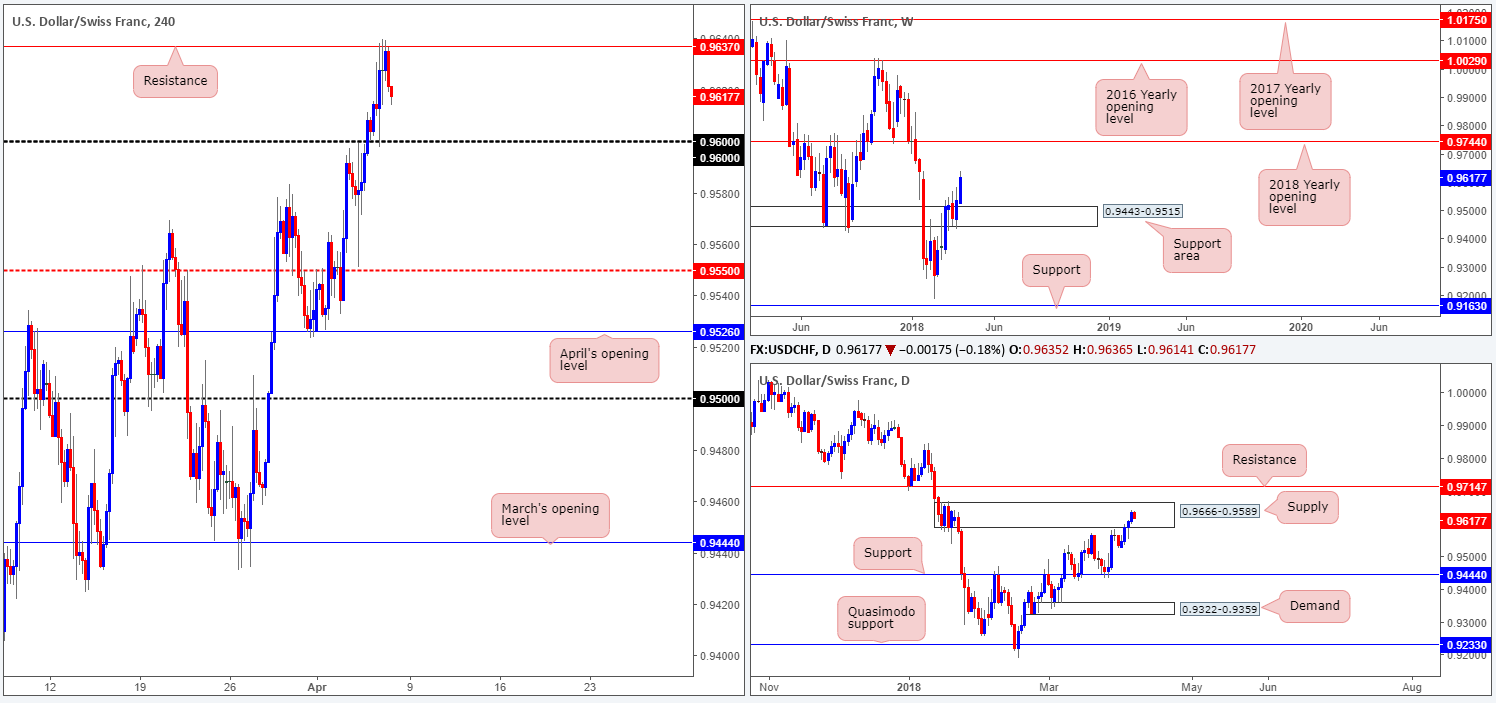
Ahead of today’s US employment numbers, we can see that H4 price established a firm grip of 0.9637 (a H4 resistance level) amid yesterday’s sessions. At this stage, the odds of a retest being seen at the 0.96 handle are high, in our humble view.
Supporting the current H4 resistance is a robust daily supply zone positioned at 0.9666-0.9589. So far, though, daily action has yet to register any meaningful movement from this area. This could have something to do with the fact that last week’s action established a base of support off of a weekly area marked at 0.9443-0.9515 in the shape of a strong-looking weekly bullish engulfing candle.
Potential trading zones:
Short term, the 0.96 handle has potential to rebound price today. Although a long from here has the backing of weekly direction, traders need to keep in mind that buying here places one in direct conflict with the current daily supply.
Longer term, however, this, like its inversely correlated cousin, the EUR/USD, is a challenging market to trade. Irrespective of which direction one selects, you’ll face opposition from higher-timeframe structure.
Data points to consider today: US job’s figures; Fed Chair Powell speech.
DOW 30:
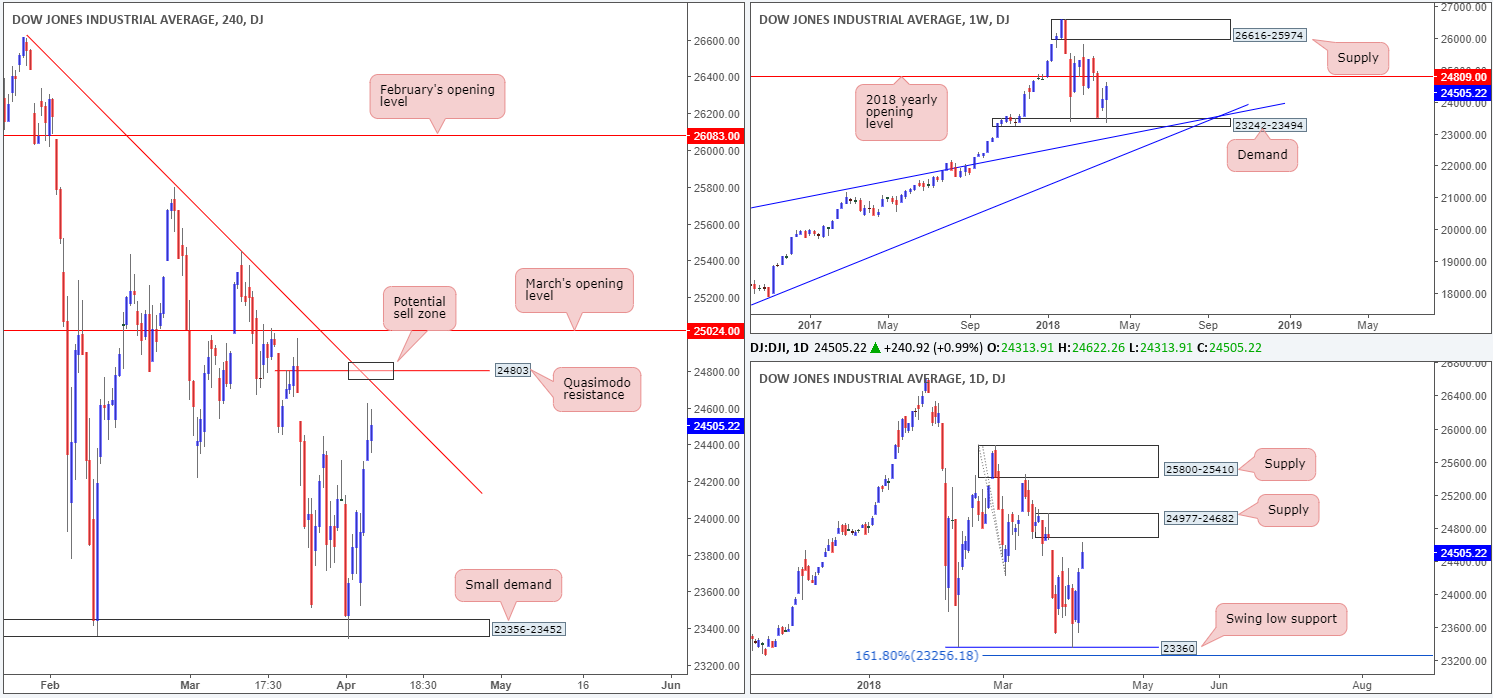
US equities continued to extend higher on Thursday, following US President Donald Trump’s top economic adviser Larry Kudlow saying the administration was involved in a negotiation with China rather than a trade war.
Up nearly 1%, the DJIA’s H4 candles now eye a H4 Quasimodo resistance level coming in at 24803, which happens to merge closely with a H4 trend line resistance extended from the high 26608. What this latest move also accomplished was positioning daily price within striking distance of daily supply at 24977-24682. It is worth noting that the current H4 Quasimodo resistance is located within this daily supply, as is the 2018 yearly opening level printed on the weekly timeframe at 24809.
Potential trading zones:
Given the location of the aforementioned H4 Quasimodo resistance level, we feel shorts from this angle are high probability. We would, however, recommend placing stop-loss orders above March’s opening level on the H4 timeframe at 25024. This, in turn, clears the top edge of the current daily supply and also avoids any fakeout that may take place up to March’s open level.
Data points to consider today: US job’s figures; Fed Chair Powell speech.
GOLD:
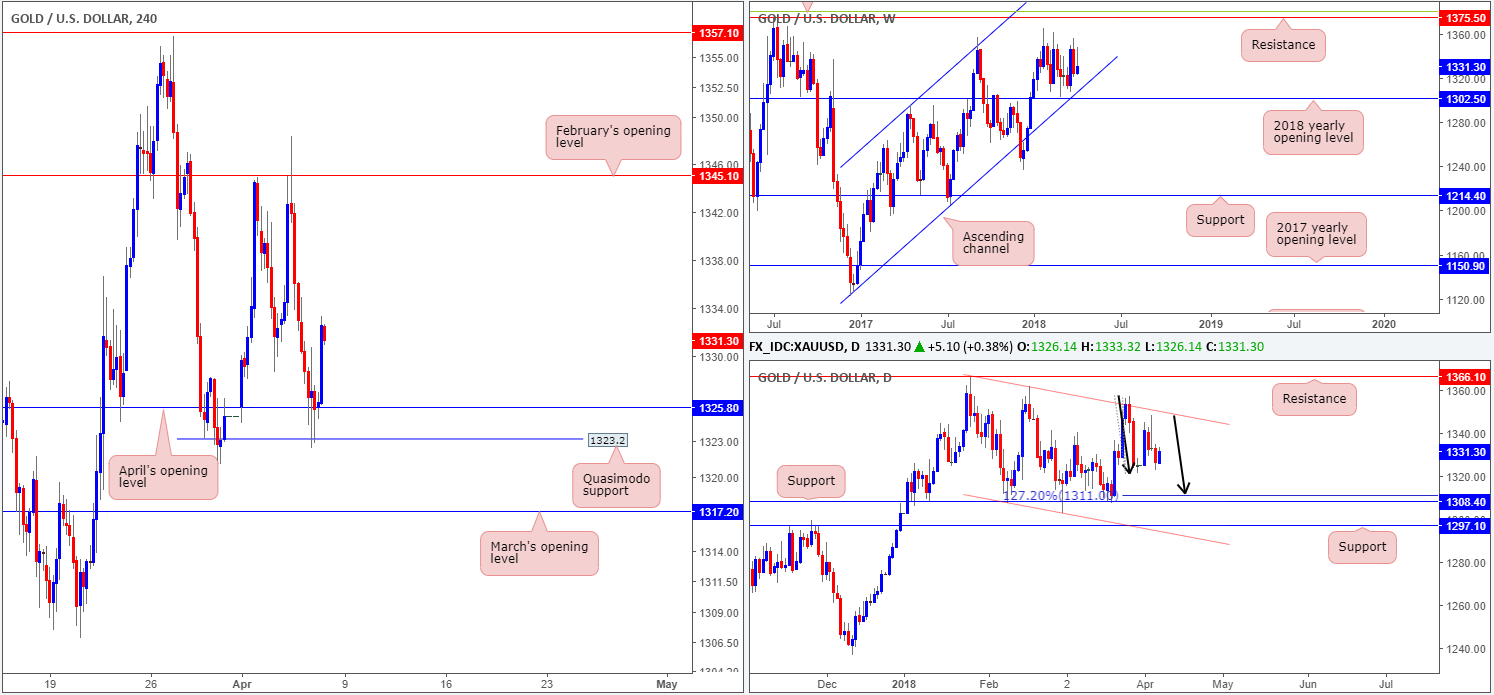
Heading into today’s NFP figures, the price of gold stamped in an impressive fakeout through April’s opening level at 1325.8 that tapped a H4 Quasimodo support at 1323.2, before advancing higher. Assuming that the bulls maintain their presence, further upside is possible until we reach February’s opening level at 1345.1.
Unfortunately there’s not much one can garner from the higher timeframes right now. Weekly price remains floating between the 2018 yearly opening level at 1302.5 (fuses closely with a long-term weekly channel support etched from the low 1122.8) and weekly resistance pegged at 1375.5/38.2% weekly Fib resistance at 1381.0. Meanwhile, daily movement is also seen trading in no man’s land between a daily channel resistance extended from the high 1366.0 and a daily support pegged at 1308.4. One interesting point to be mindful of, however, is a potential daily AB=CD 127.2% Fib ext. completion point that terminates just north of the noted daily support (see black arrows) at 1311.0.
Potential trading zones:
With the higher timeframes not really offering much in terms of tradable structure at this time, and H4 action showing limited support and resistance in play, the team has noted that this market may be best left on the back burner until after today’s NFP event.
This site has been designed for informational and educational purposes only and does not constitute an offer to sell nor a solicitation of an offer to buy any products which may be referenced upon the site. The services and information provided through this site are for personal, non-commercial, educational use and display. IC Markets does not provide personal trading advice through this site and does not represent that the products or services discussed are suitable for any trader. Traders are advised not to rely on any information contained in the site in the process of making a fully informed decision.
This site may include market analysis. All ideas, opinions, and/or forecasts, expressed or implied herein, information, charts or examples contained in the lessons, are for informational and educational purposes only and should not be construed as a recommendation to invest, trade, and/or speculate in the markets. Any trades, and/or speculations made in light of the ideas, opinions, and/or forecasts, expressed or implied herein, are committed at your own risk, financial or otherwise.
The use of the site is agreement that the site is for informational and educational purposes only and does not constitute advice in any form in the furtherance of any trade or trading decisions.
The accuracy, completeness and timeliness of the information contained on this site cannot be guaranteed. IC Markets does not warranty, guarantee or make any representations, or assume any liability with regard to financial results based on the use of the information in the site.
News, views, opinions, recommendations and other information obtained from sources outside of www.icmarkets.com.au, used in this site are believed to be reliable, but we cannot guarantee their accuracy or completeness. All such information is subject to change at any time without notice. IC Markets assumes no responsibility for the content of any linked site. The fact that such links may exist does not indicate approval or endorsement of any material contained on any linked site.
IC Markets is not liable for any harm caused by the transmission, through accessing the services or information on this site, of a computer virus, or other computer code or programming device that might be used to access, delete, damage, disable, disrupt or otherwise impede in any manner, the operation of the site or of any user’s software, hardware, data or property.


