
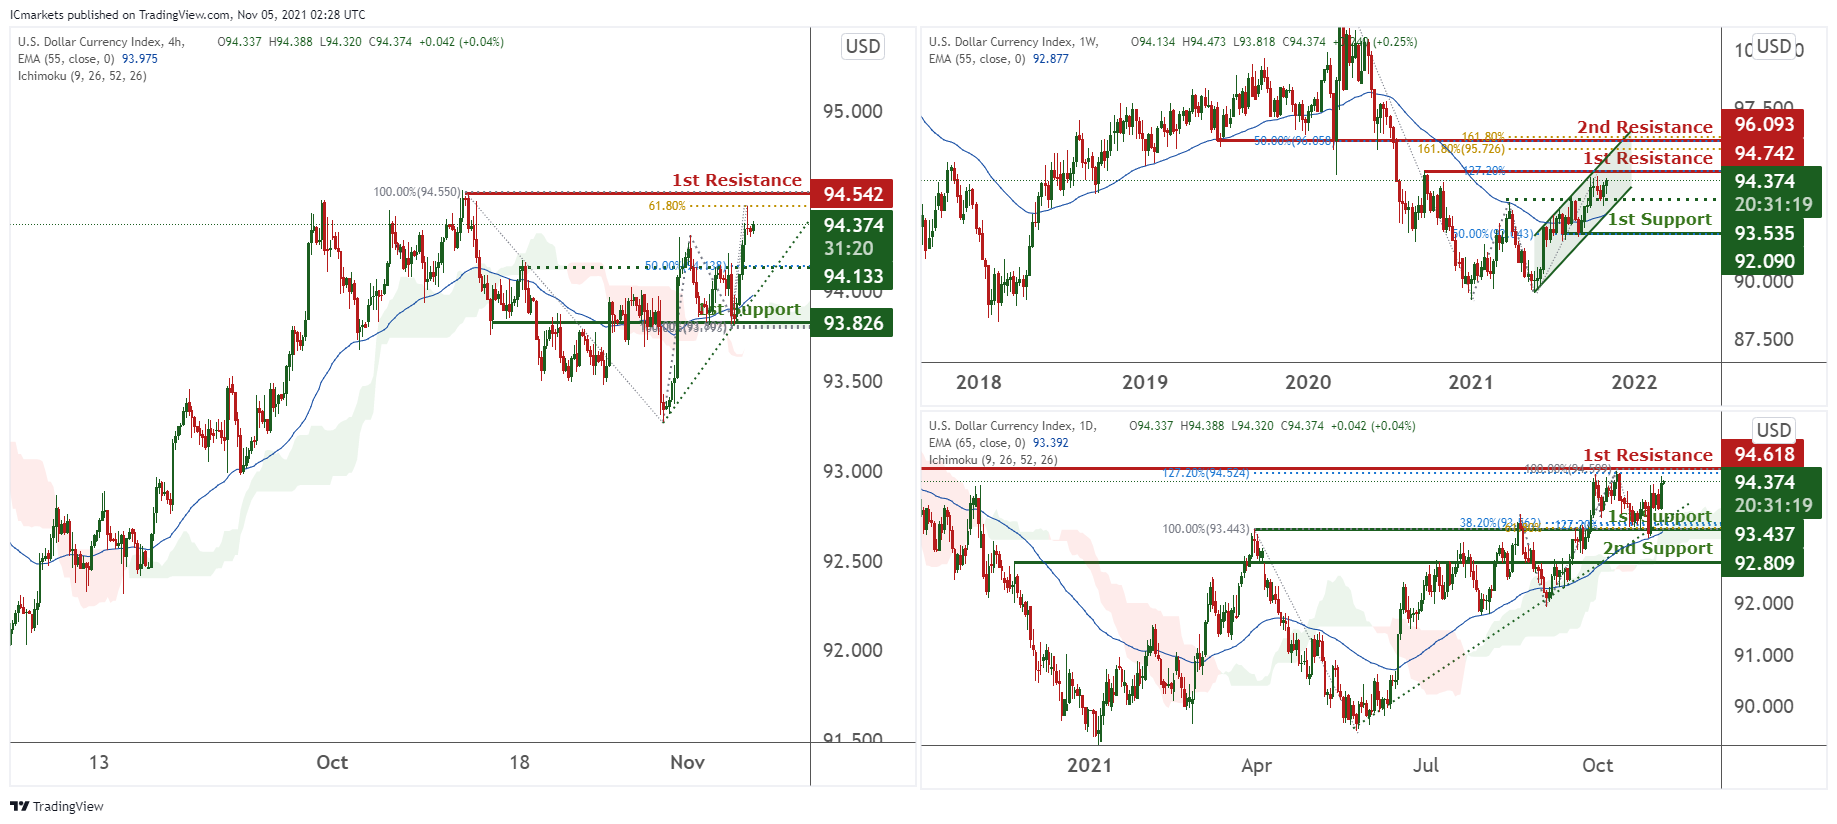
DXY:
On the weekly timeframe, prices are consolidating in a bullish channel. We see potential for prices to climb higher towards our 1st resistance at 94.742 in line with the 127.2% Fibonacci extension. Technical indicators are showing bullish momentum. Alternatively, if prices retest our intermediate support at 93.535, it might reverse towards our 1st support at 92.090 in line with 50% Fibonacci retracement.
On the daily, prices are on a bullish momentum. We see potential for a small pullback from our 1st resistance at 94.742 in line with 127.2% Fibonacci extension towards our 1st support at 93.437 which is an area of Fibonacci confluences and in line with our ascending trendline before prices climbing further. Technical indicators are showing bullish momentum.
On the H4 timeframe, prices are on a bullish momentum. Prices to retest our intermediate support at 94.133 in line with 50% Fibonacci retracement and watch the level for any potential reversals. Technical indicators are showing bullish momentum. If prices breaks our intermediate support at 94.133, it might dip towards our 1st support at 93.826.
Areas of consideration:
- H4 time frame, 1st resistance at 94.542
- H4 time frame, intermediate support at 94.133
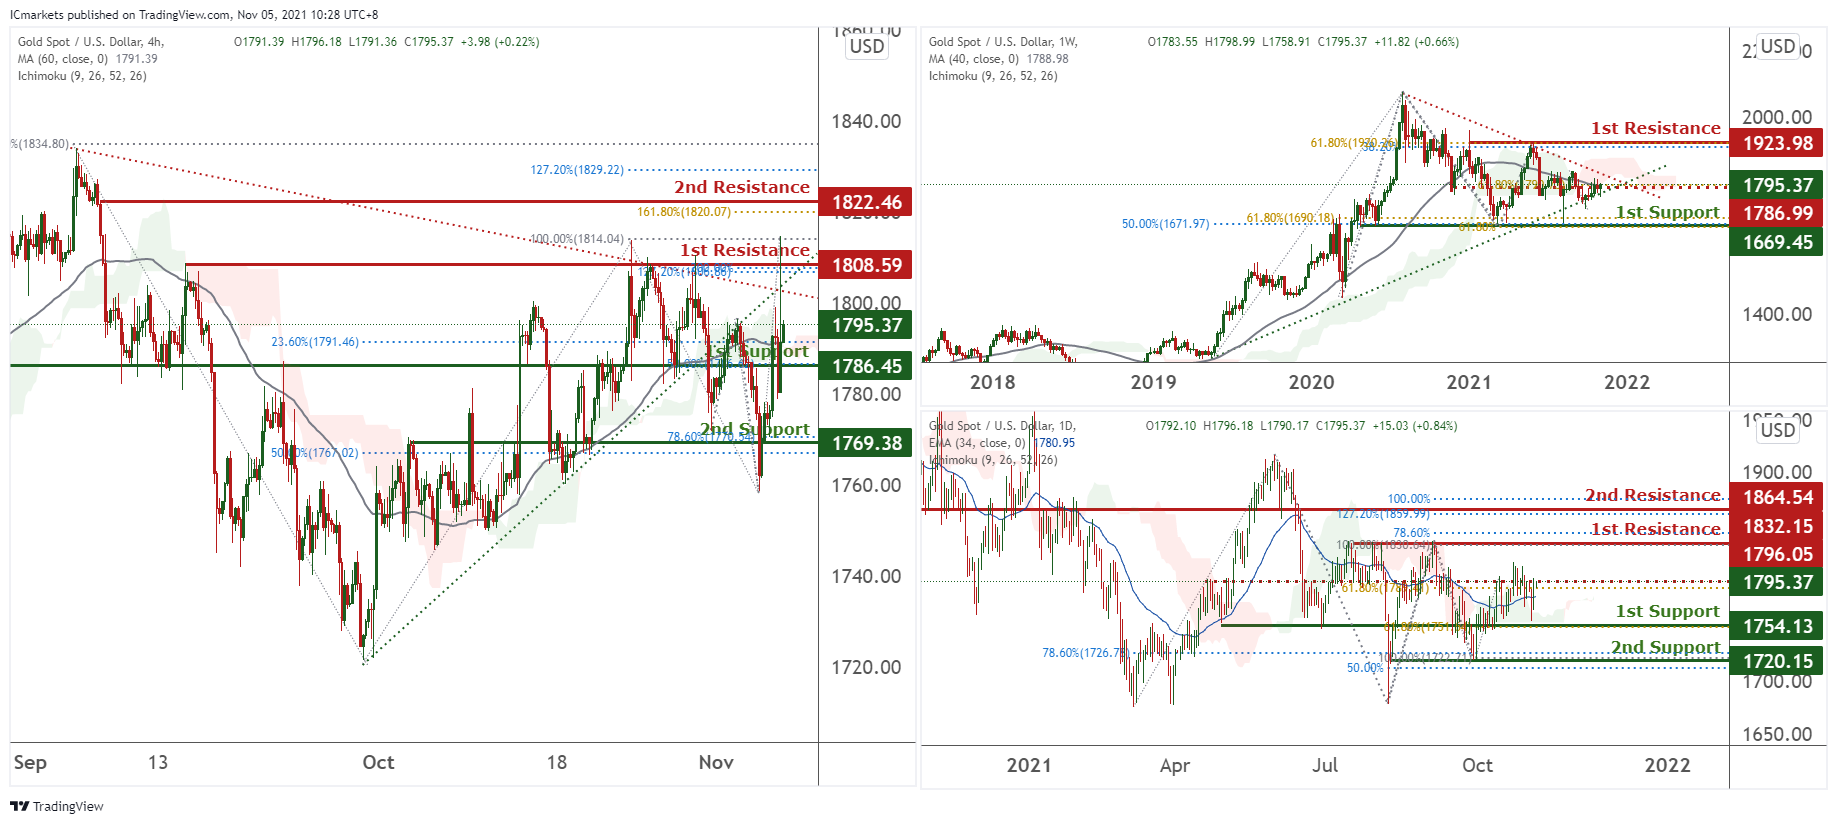
XAU/USD (GOLD):
On the Weekly, prices are consolidating in a triangle and are currently testing at our intermediate resistance. Prices have the potential to dip from our intermediate resistance in line with 61.8% Fibonacci retracement towards our 1st support at 1669.45 in line with 50% and 61.8% Fibonacci retracement. Technical indicators are showing bearish momentum. Alternatively, prices might climb towards our 1st resistance at 1923.98 in line with 50% and 61.8% Fibonacci retracement.
On the Daily, prices have recently reversed off our intermediate resistance at 1796.05 in line with 61.8% Fibonacci retracement. As technical indicators are showing mixed signals, we prefer to remain neutral for now.
On the H4 chart, prices have recently broken our triangle and are hovering in the middle of our 1st support at 1786.45 and 1st resistance at 1808.59. As technical indicators are showing mixed signals, we prefer to remain neutral for now.
Areas of consideration:
- 4h 1st support at 1786.45
- 4h 1st resistance at 1808.59
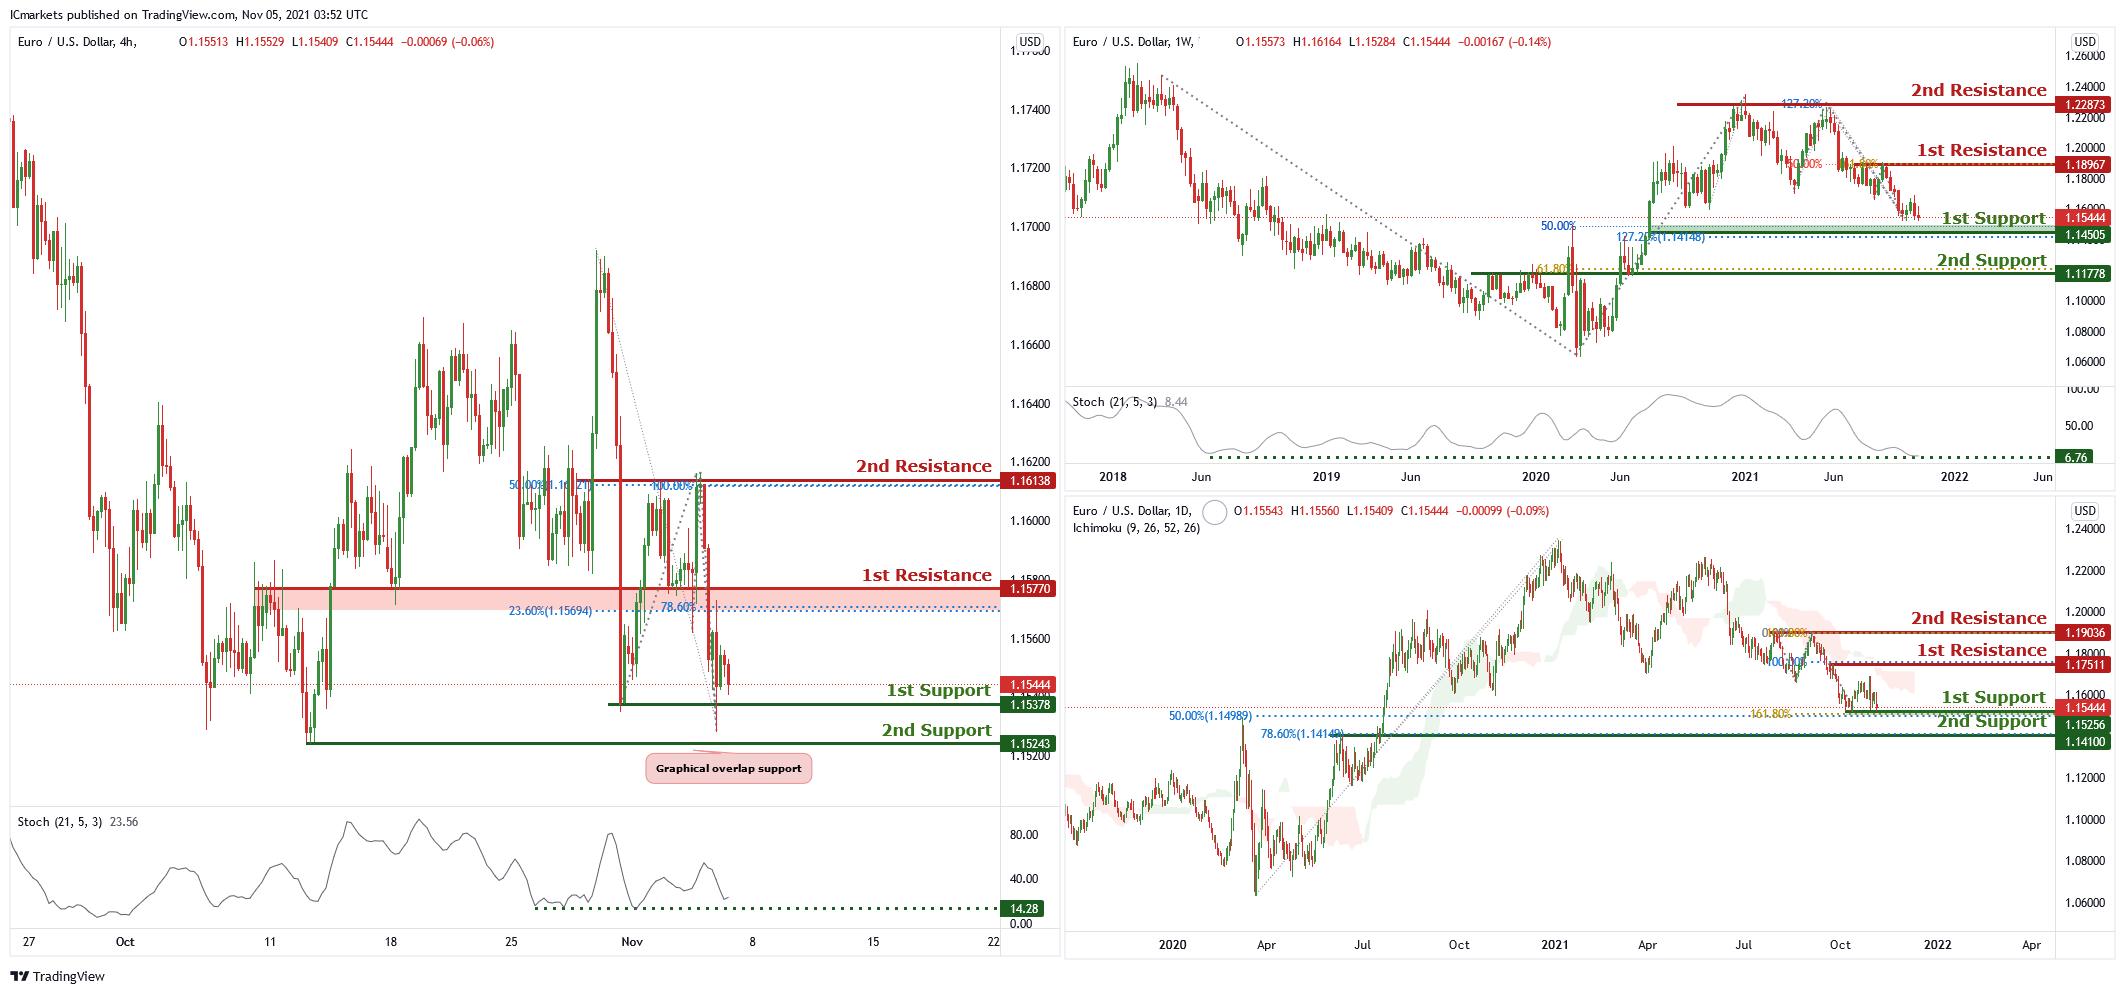
EUR/USD:
On the weekly chart, price is near the first support level of 1.14505 which is also 50% Fibonacci retracement and 127.2% Fibonacci projection. Price can potentially bounce from the first support to the first resistance level of 1.18967 which is 50% Fibonacci retracement and 61.8% Fibonacci projection. Our bullish bias is supported by technical indicators.
On the daily chart price is at the first support level of 1.15439 which is also 161.8% Fibonacci projection and 50% Fibonacci retracement. If price were to break the first support level, it can potentially dip to the 2nd support level of 1.141 which is 78.6% Fibonacci retracement. Our bearish bias is supported by the ichimoku cloud indicator as price is trading under it.
On the daily chart price has recently bounced from the first support level of 1.15378 which is also the graphical swing low level. Price can potentially go up to the first resistance level of 1.15770 which is 23.6% Fibonacci retracement and 78.6% Fibonacci projection. Our bullish bias is supported by the stochastic indicator as it is near support level.
Areas of consideration :
H4 1st support – 1.15378
H4 2nd support – 1.5243
H4 1st resistance – 1.15770
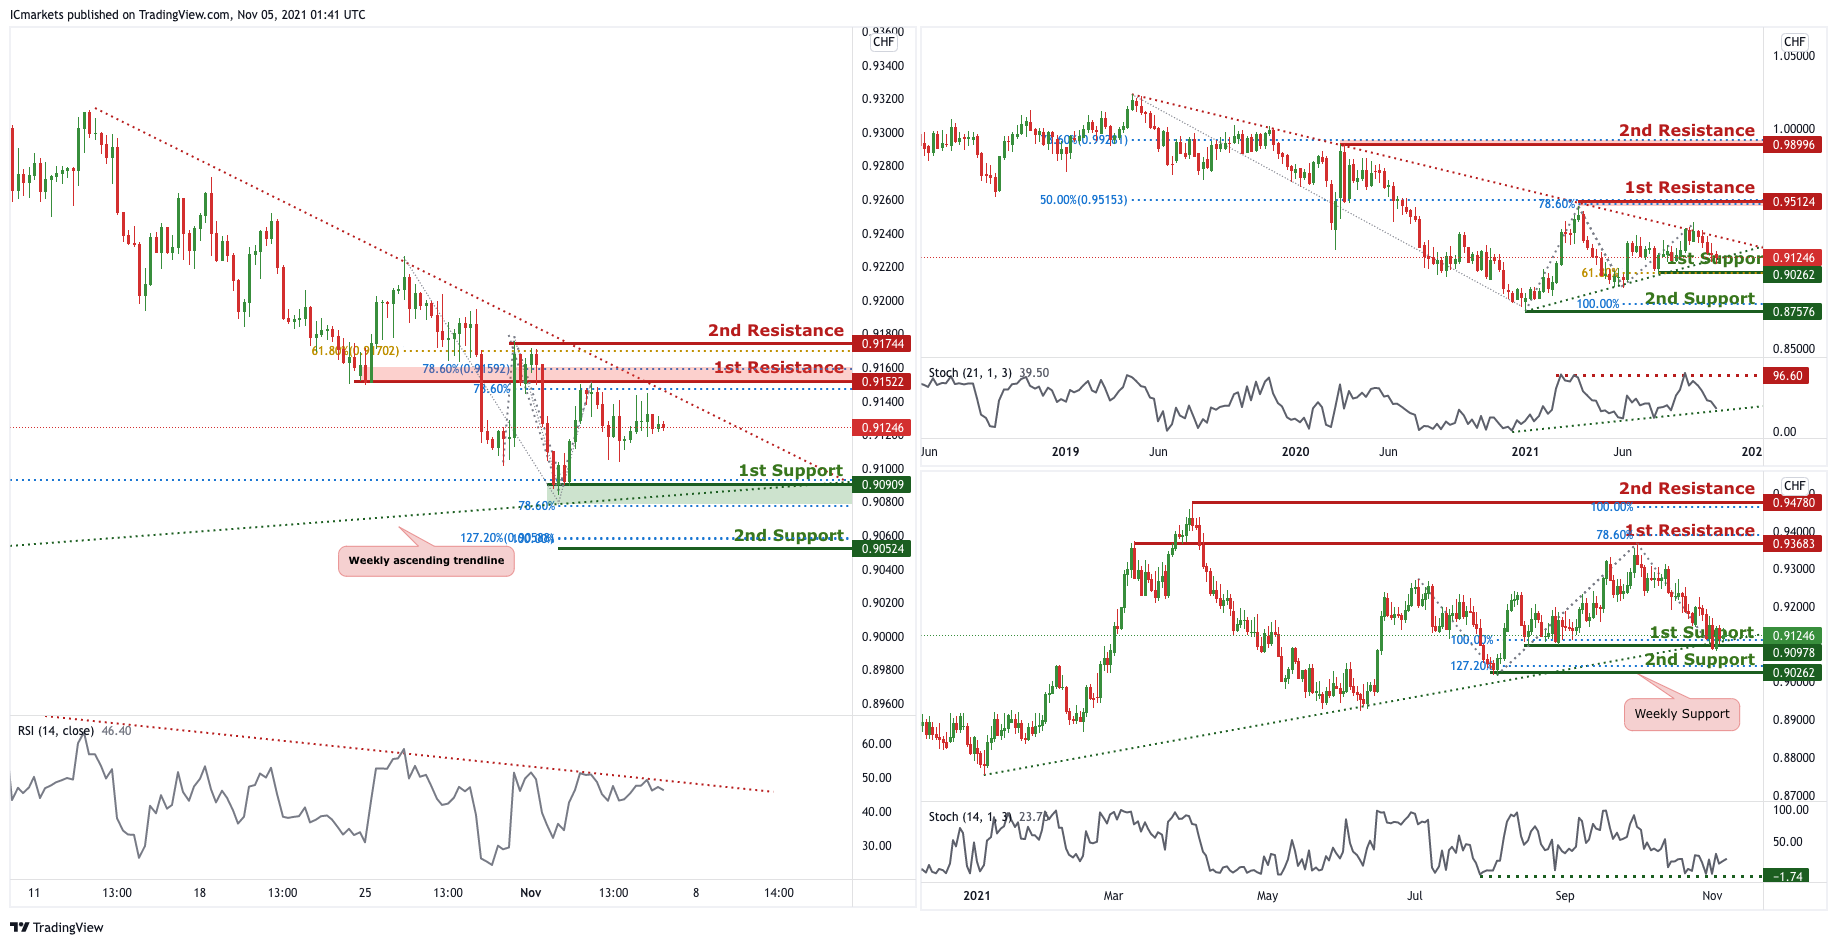
USD/CHF:
On the weekly, price is holding above ascending trendline support however, it is also at the descending trendline resistance, price might bounce up and push towards the descending trendline resistance as the stochastic indicator showing %K line abiding to the ascending trendline support. Price is also between 1st resistance at 0.95124 and 1st support at 0.90262. Traders should watch these levels closely for a break to see prices swing higher or drop lower. On the Daily, price is seen to have a short-term bullish momentum. We can expect price to bounce off from the 1st Support in line with 100% Fibonacci projection and ascending trendline support. Our short-term bullish bias is further supported by the stochastic indicator where the %K line bounced off at the support level
On the H4 timeframe, price is now abiding to a descending trendline resistance, signifying bearish momentum. We can now expect price to make a drop from the 1st resistance in line with 78.6% Fibonacci retracement and 78.6 % Fibonacci projection towards the 1st Support in line with 78.6% Fibonacci projection. Our bearish bias is further supported by the RSI indicator where it is at the descending trendline resistance.
Areas of consideration:
- Watch 1st Support at 0.90909
- Watch 1st Resistance at 0.91522
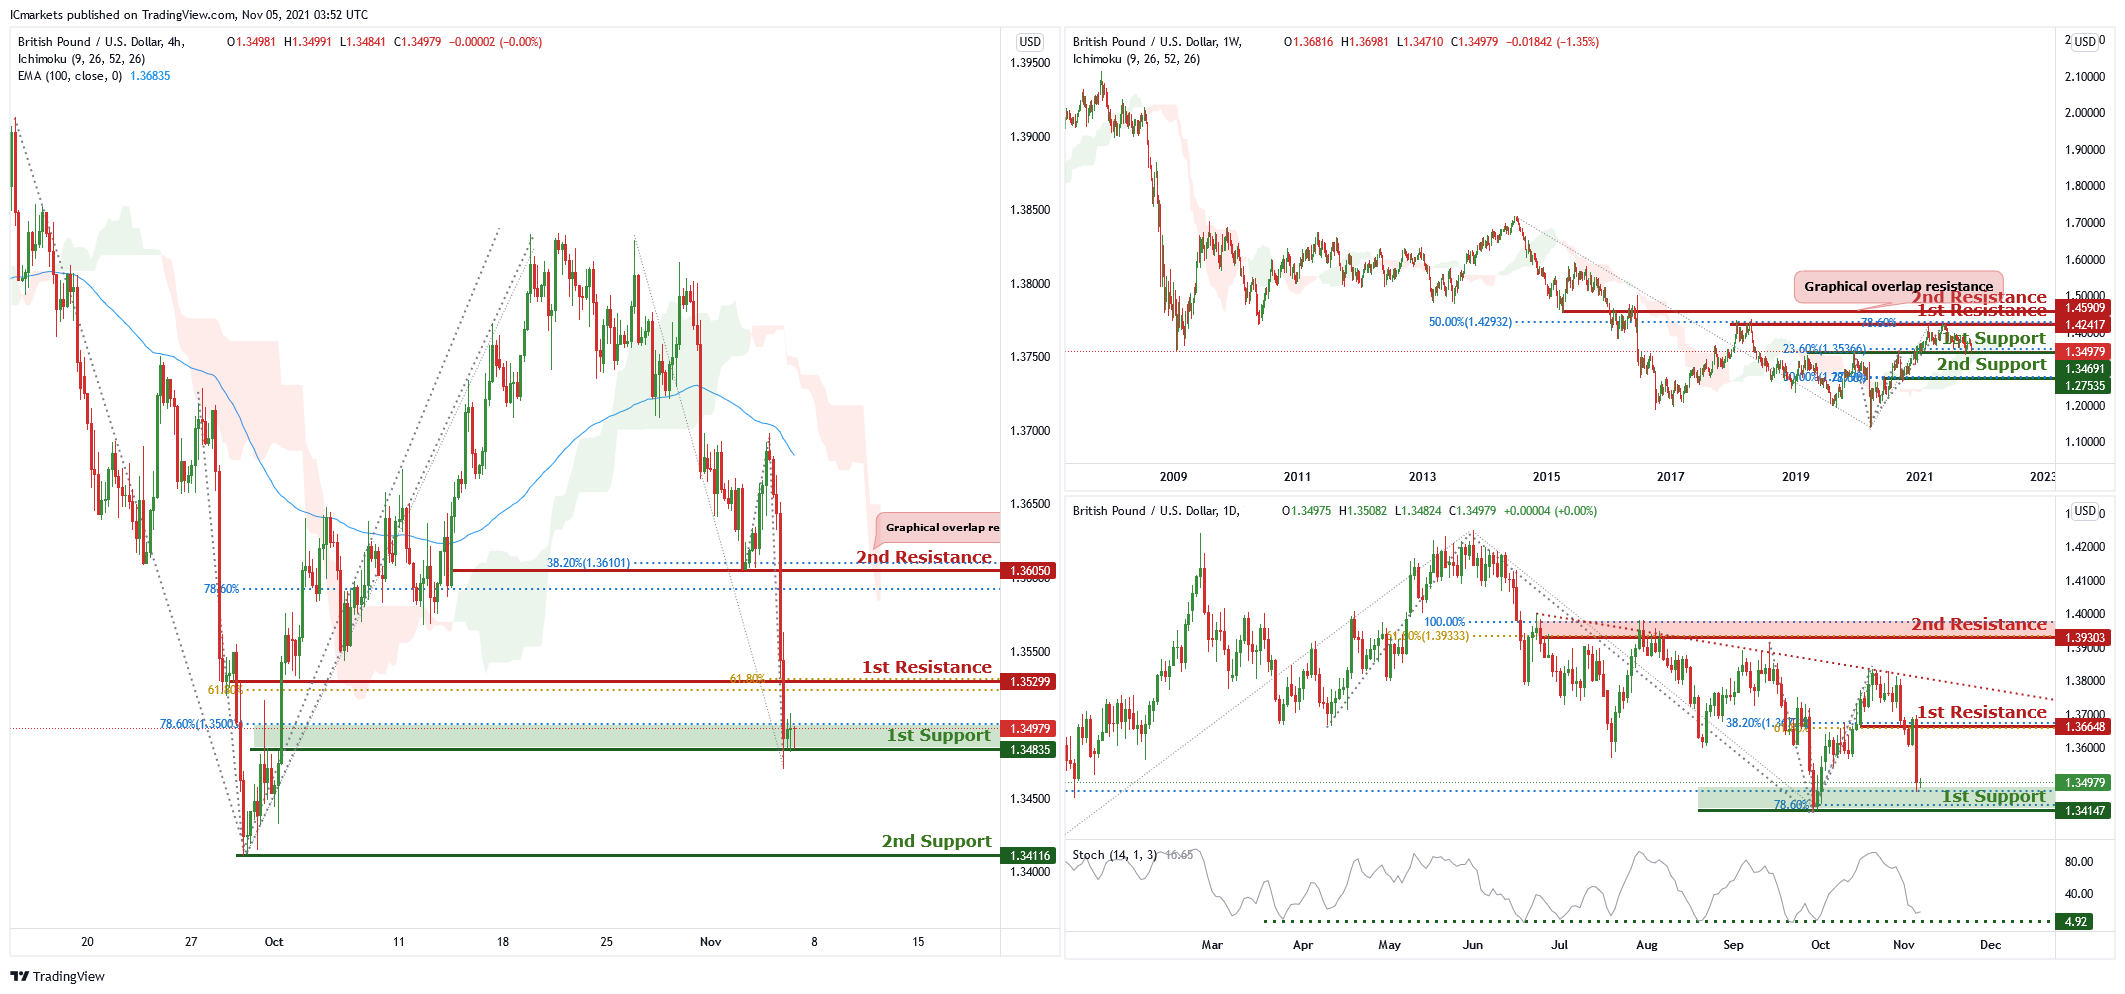
GBP/USD:
On the weekly chart, price is hovering near the first support level of 1.34691 which is 23.6% Fibonacci retracement. Price can potentially bounce from first support level to first resistance of 1.42417 which is also 78.6% Fibonacci projection and 50% Fibonacci retracement. Our bullish bias is further supported by the ichimoku cloud indicator.
On the daily chart, price is trading in a descending trendline and is near the first support level of 1.34147 which is also 50% Fibonacci retracement and 78.6% Fibonacci projection. Price can potentially bounce from the first support level to that of first resistance of 1.36648 which is also 38.2% Fibonacci retracement and 61.8% Fibonacci projection. Our bullish bias is supported by a stochastic indicator as it is near support level.
On the H4 chart, price is at first support level of 1.34835 which is 78.6% Fibonacci retracement level. Price can potentially dip to the 2nd support level of 1.34116 which is also the graphical swing low level. Our bullish bias is supported by the ichimoku cloud indicator and EMA as price is trading below it.
Areas of consideration:
H4 first support – 1.34835
H4 first resistance – 1.35299
H4 second support – 1.34116
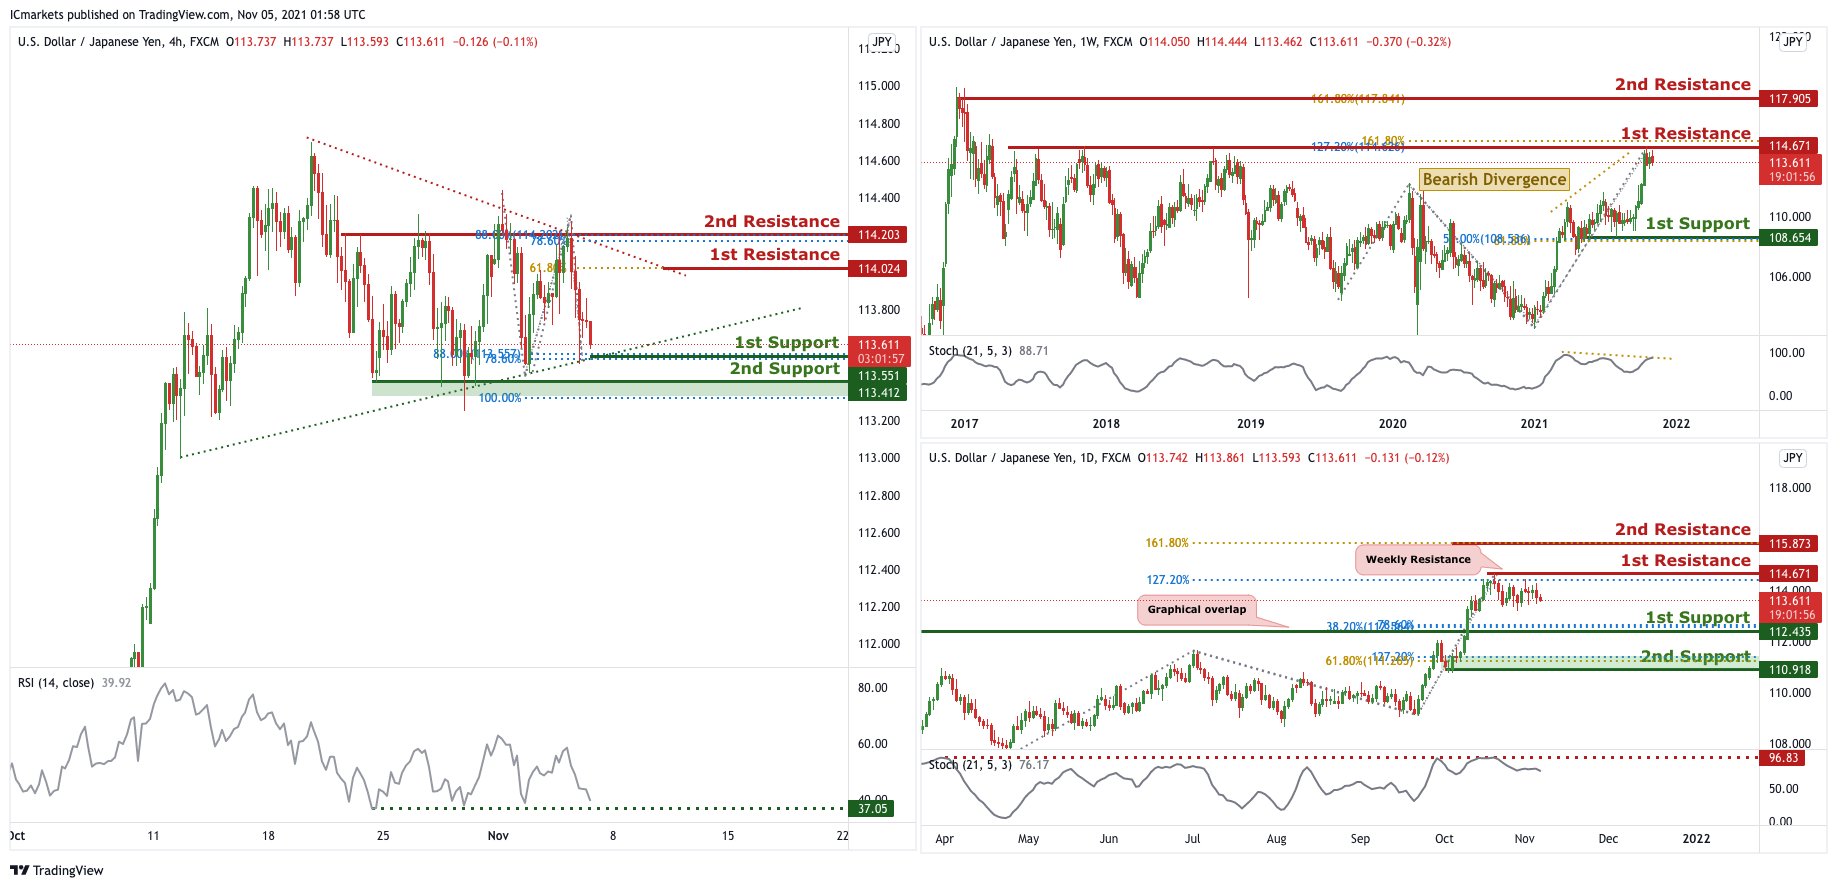
USD/JPY
On the Weekly timeframe, we can see that price is approaching the 1st resistance in line with horizontal swing highs and 127.2% FIbonacci Retracement and 161.8% Fibonacci Projection. We can expect the price to drop from the 1st Resistance towards the 1st Support in line with 61.8% Fibonacci projection and 50% Fibonacci retracement. Our short-term bearish momentum is further supported by the stochastic %K line holding below the descending trendline resistance and bearish divergence spotted. On the Daily timeframe, in reference to last week’s analysis, price indeed dropped from the 1st Resistance in line with 127.2% Fibonacci projection and weekly resistance. We are expecting price to push further down to the 1st Support in line with 127.2% Fibonacci projection and 61.8% Fibonacci retracement. Our short-term bearish bias is further supported by the stochastics %K line that touched the resistance level and dropped.
On the H4 timeframe, price is currently reacting in a triangle and a bullish pennant pattern. We can expect price to bounce from 1st support in line with 88% Fibonacci retracement and 78.6% Fibonacci projection towards the 1st Resistance level in line with 61.8% Fibonacci projection. Our short-term bullish bias is further supported by RSI approaching the support level.
Areas of consideration:
- H4 1st resistance level 114.024
- H4 1st support level 113.613
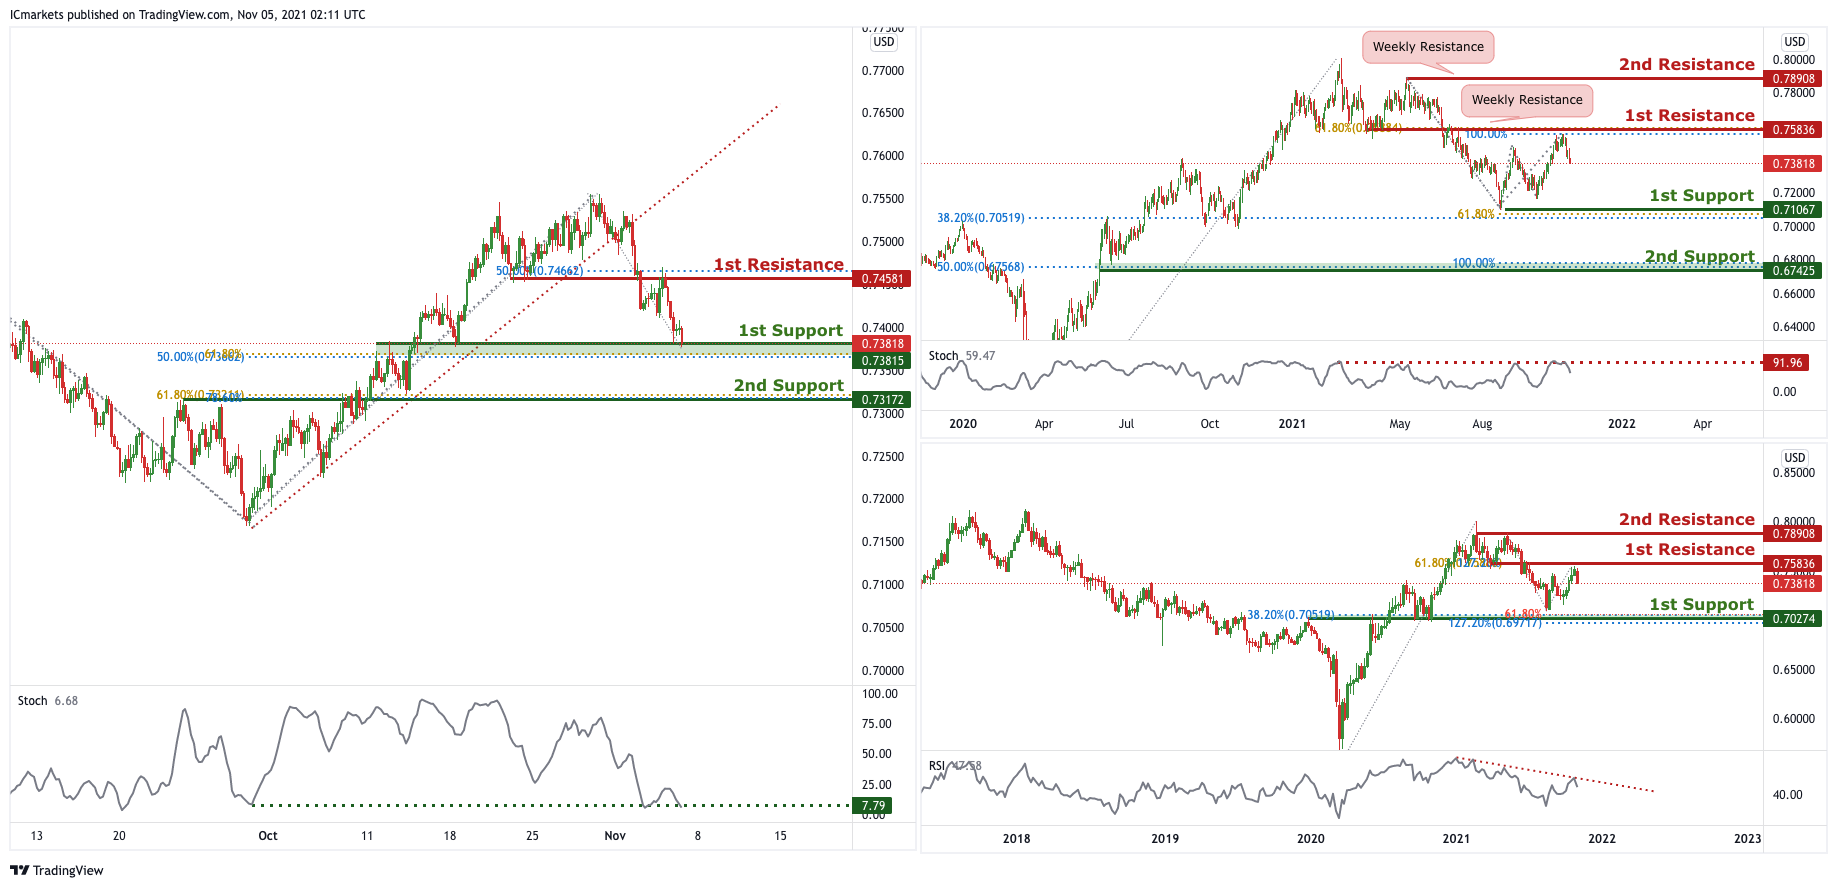
AUD/USD:
In reference to last week’s analysis, on the weekly, price indeed dropped from the 1st Resistance in line with 61.8% Fibonacci projection and 127.2% Fibonacci retracement towards the 1st support in line with 127.2% Fibonacci retracement and 61.8% Fibonacci projection. Our bearish bias is further supported by the RSI indicator abiding to a descending trendline.. On the Daily, the price is at the 1st Resistance, we can expect price to drop from there in line with 61.8% Fibonacci retracement and 100% Fibonacci projection towards the 1st Support in line with 61.8% Fibonacci projection and previous swing low. Our bearish bias is further supported by the stochastic indicator where the %K line dropped from the resistance level.
On the H4, we can see that price broke past the ascending trendline support, signifying a bearish trend momentum. We can expect price to make a short-term bullish bounce from the 1st Support in line with the 50% Fibonacci retracement and 61.8% Fibonacci projection towards the 1st Resistance in line with 50% Fibonacci retracement. Our short-term bullish support is further supported by a stochastic indicator where the %K line is at the support level.
Areas of consideration:
- H4 1st resistance level 0.74581
- H4 1st support level 0.73815
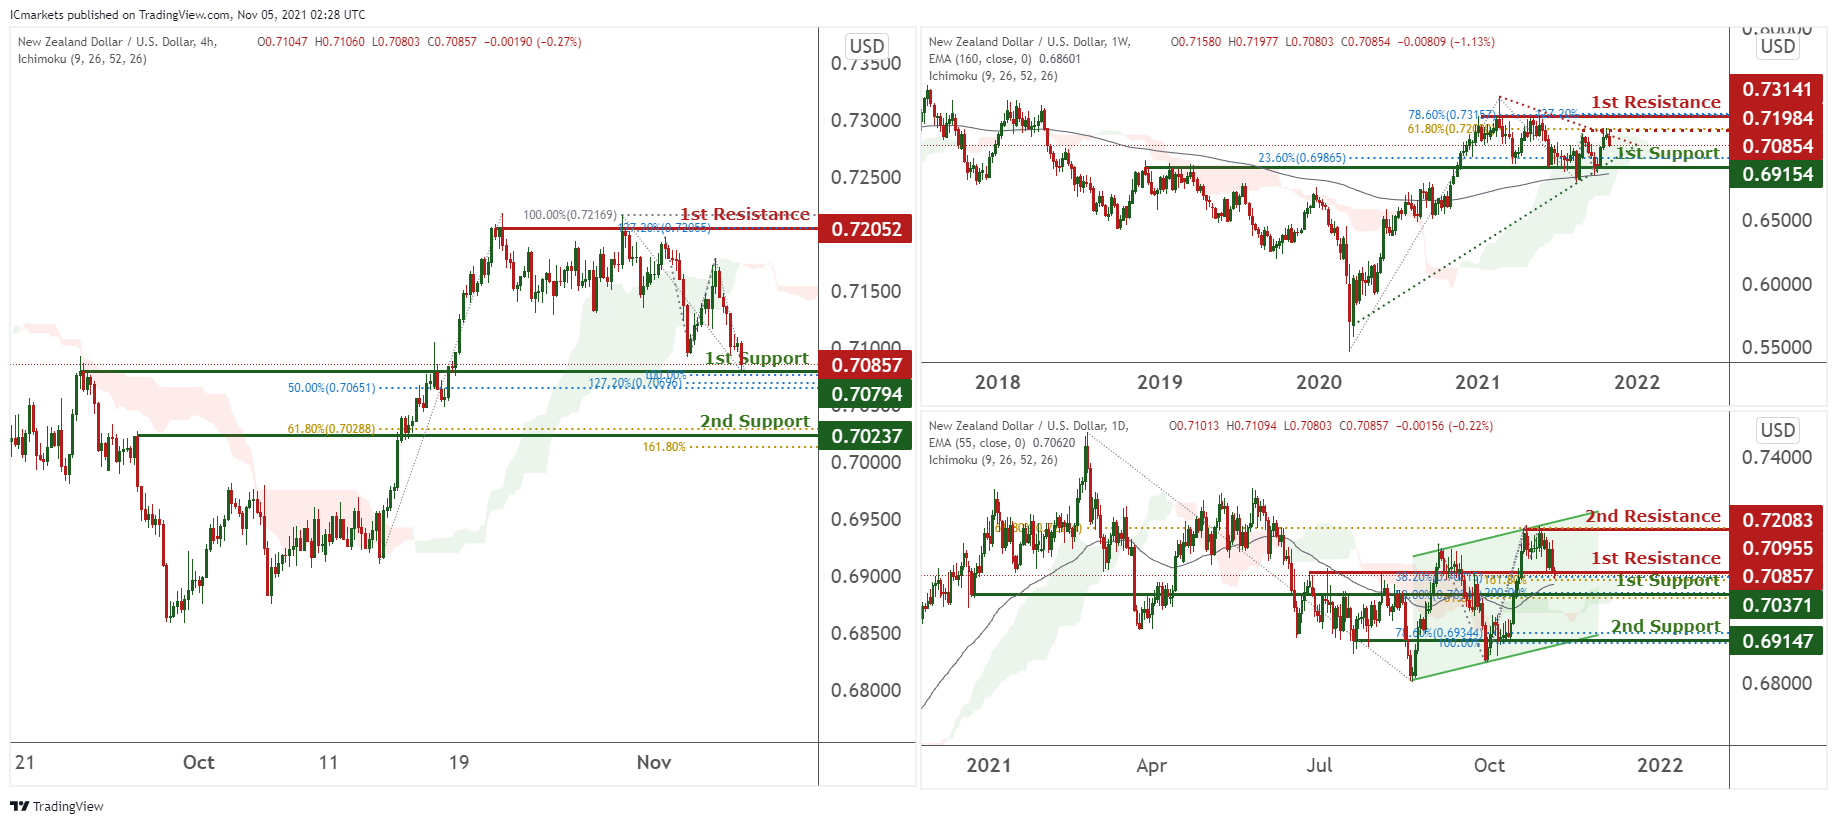
NZD/USD:
On the weekly, prices are consolidating in a triangle and have recently reversed off our intermediate resistance at 0.71984 in line with 61.8% Fibonacci retracement. We see potential for prices to dip towards our 1st support at 0.69154 in line with 23.6% Fibonacci retracement. Technical indicators are showing bearish momentum.
On the daily, prices are consolidating in a bullish channel. We see potential prices to bounce at our 1st support at 0.70371in line with 50%, 61.8% Fibonacci retracement and 200% Fibonacci projection. Technical indicators are showing bullish momentum.
On the H4 timeframe, prices have recently tested our 1st support at 0.70794 which is an area of Fibonacci confluences and has the potential for further dips towards our 2nd support at 0.70237 in line with 61.8% Fibonacci retracement and 161.8% Fibonacci extension. Technical indicators are showing bearish momentum.
Areas of consideration:
- H4 time frame, 1st resistance at 0.72052
- H4 time frame, 1st support at 0.70794
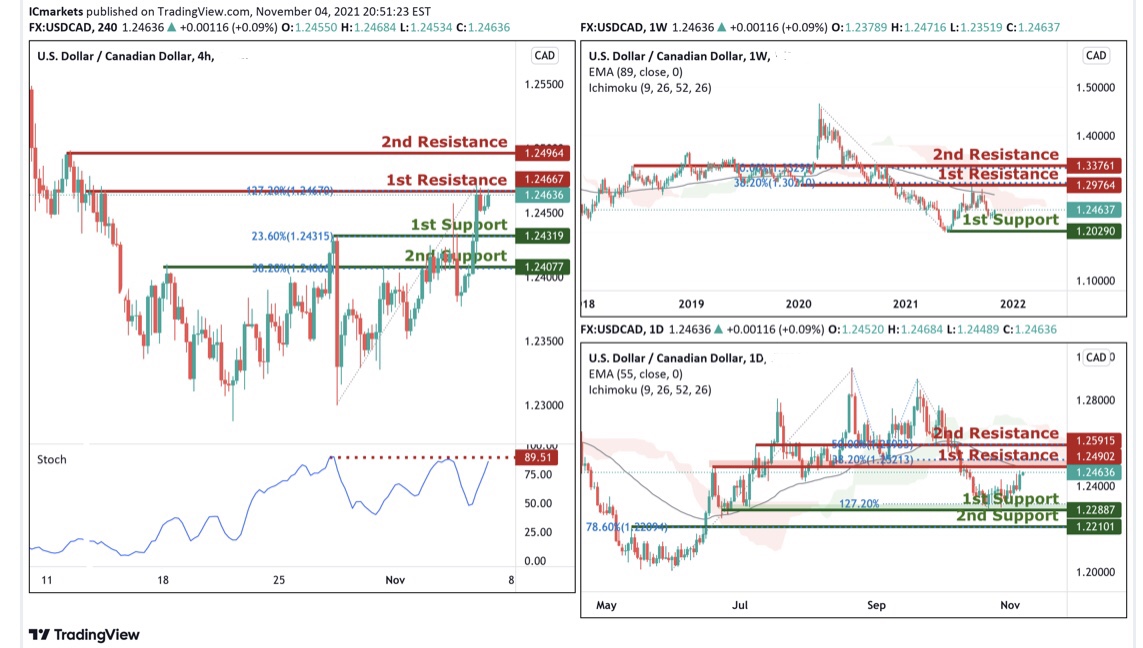
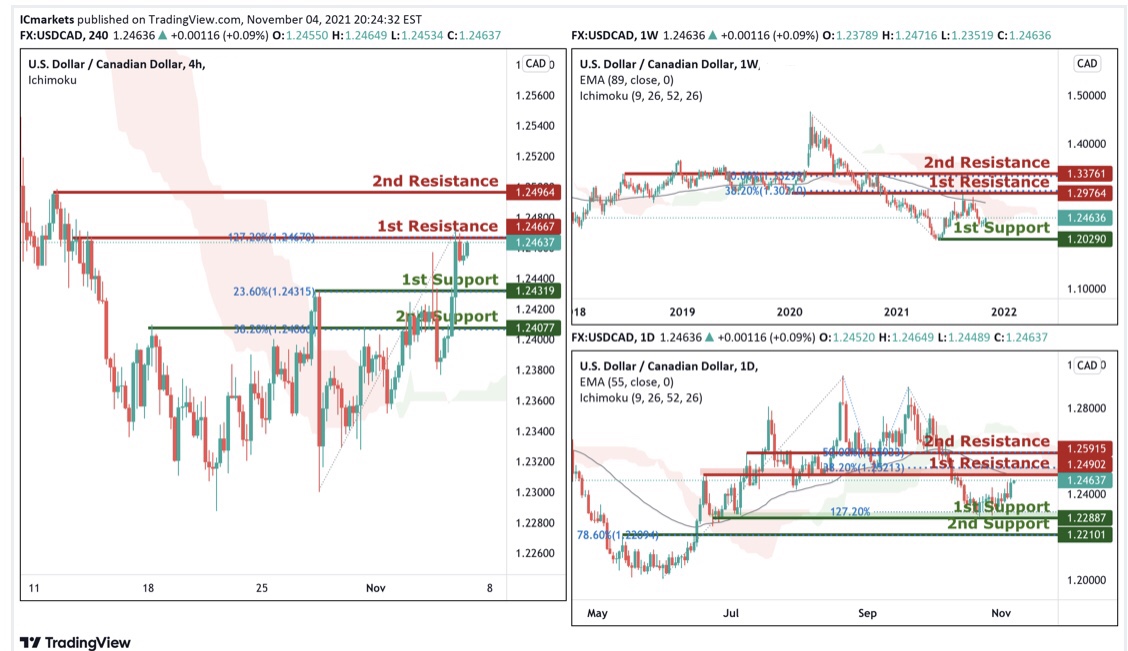
USD/CAD:
On the Weekly timeframe, price tested and reacted below long term moving average and also both 38.2% Fibonacci retracement level at 1.29764. As long as the price is holding below this level, we could potentially see the price facing further bearish pressure in the long term or at least to 1st support at 1.2090 in line with our horizontal swing low support.
On the Daily, price has been testing our 1st support at 1.22887 in line with 127.2% Fibonacci extension and graphical overlap support for a few days. With price moving below our moving average and ichimoku indicator, we have a bearish bias that price may possibly break 1st support and head for 2nd support at 1.22101 in line with the 78.6% Fibonacci retracement and graphical overlap support. Alternatively, it may rise to 1st resistance at 1.24092 in line with our graphical overlap resistance.
On the H4, with price approaching both our graphical swing high resistance and the resistance on the stochastics indicator, we are expecting to see price dip from 1st resistance at 1.24667 in line with the 127.2% Fibonacci extension to 1st support at 1.24319 in line with the 23.6% Fibonacci retracement levels and graphical overlap resistance and possibly to our 2nd support at 1.24077 in line with the 38.6 Fibonacci retracement and graphical overlap support. Alternatively, we may see price break structure at 1st resistance and head for 2nd resistance at 1.24964 in line with our graphical swing high resistance.
Areas of consideration:
- H4 time frame, support at 24319
- H4 time frame, resistance at 24667
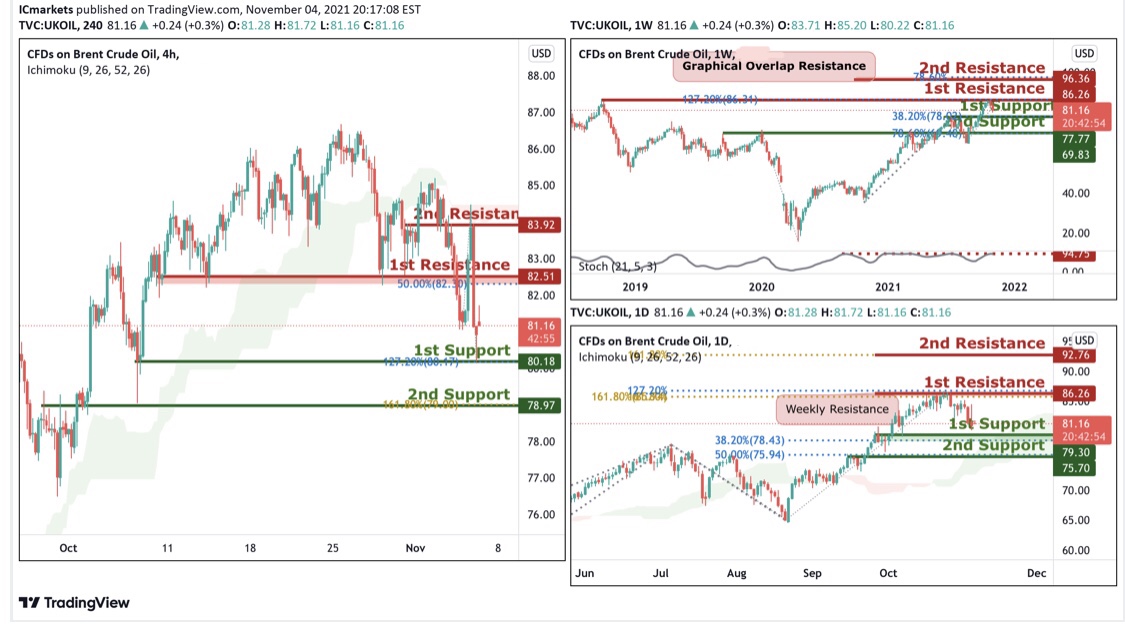
OIL:
On Weekly timeframe, we are likely to see prices drop from the 1st resistance at 86.26 in line with the 127.2% Fibonacci retracement to 1st support at 77.77. Otherwise, price may break 1st resistance and make a new high at 2nd resistance at 96.36. Our bearish bias can be supported by the resistance on the stochastic indicator.
On the Daily timeframe, as price is holding above the moving average, we are likely to see price move further up to the 2nd resistance at 92.76 in line with the 161.8% Fibonacci retracement. Otherwise it may head to 1st support first at 79.30 in line with the 38.2% Fibonacci retracement.
On the H4 timeframe,with price moving below the ichimoku cloud, we are expecting a bearish continuation from our 1st resistance at 82.51 in line with the 50% Fibonacci retracement level to 1st support at 80.18 in line with our horizontal swing low support and 127.2% Fibonacci extension level and possibly our 2nd support at 78.97 in line with our 161.8% Fibonacci extension levels and graphical swing low support. Alternatively, price may break 1st resistance structure and head for 2nd resistance at 83.92 which is in line with our swing high resistance.
Areas of consideration:
- H4 time frame, 1st resistance of 14
- H4 time frame, 1st support of 37
Dow Jones Industrial Average:
On the Weekly, price has been trading sideways between our 1st support at 37270 in line with the 23.6% Fibonacci retracement and 1st resistance at 37021 in line with a 161.8% Fibonacci extension and 100% Fibonacci projection. As there are no good risk reward levels, we prefer to remain neutral at this current juncture.
On the Daily chart, with stochastic showing that price has reached a resistance, we are expecting to see price fall from 1st resistance at 36124 in line with the 127.2% Fibonacci extension and the 161.8% Fibonacci extension level and horizontal overlap support to 1st support at 35492 in line with our 61.8% Fibonacci retracement. Alternatively, price may break 1st resistance structure and head for 2nd resistance at 37021 in line with the weekly resistance.
On the H4, with price approaching the resistance of the stochastics indicator indicating a reversal, we are biased that price will dip from 1st resistance at 36148 in line with two 161.8% Fibonacci extension level and 61.8% Fibonacci projection level to 1st support at 35975 in line with the 61.8% Fibonacci retracement level. Alternatively, we may see price break 1st resistance and head for 2nd resistance at 36276 in line with 127.2% Fibonacci extensions and 100% Fibonacci projection.
Areas of consideration:
- 4H resistance at 36148
- 4H support at 35975
The accuracy, completeness and timeliness of the information contained on this site cannot be guaranteed. IC Markets does not warranty, guarantee or make any representations, or assume any liability regarding financial results based on the use of the information in the site.
News, views, opinions, recommendations and other information obtained from sources outside of www.icmarkets.com.au, used in this site are believed to be reliable, but we cannot guarantee their accuracy or completeness. All such information is subject to change at any time without notice. IC Markets assumes no responsibility for the content of any linked site.
The fact that such links may exist does not indicate approval or endorsement of any material contained on any linked site. IC Markets is not liable for any harm caused by the transmission, through accessing the services or information on this site, of a computer virus, or other computer code or programming device that might be used to access, delete, damage, disable, disrupt or otherwise impede in any manner, the operation of the site or of any user’s software, hardware, data or property.


