
Waiting for lower timeframe confirmation is our main tool to confirm strength within higher timeframe zones, and has really been the key to our trading success. It takes a little time to understand the subtle nuances, however, as each trade is never the same, but once you master the rhythm so to speak, you will be saved from countless unnecessary losing trades. The following is a list of what we look for:
- A break/retest of supply or demand dependent on which way you’re trading.
- A trendline break/retest.
- Buying/selling tails/wicks – essentially we look for a cluster of very obvious spikes off of lower timeframe support and resistance levels within the higher timeframe zone.
- Candlestick patterns. We tend to stick with pin bars and engulfing bars as these have proven to be the most effective.
We typically search for lower-timeframe confirmation between the M15 and H1 timeframes, since most of our higher-timeframe areas begin with the H4. Stops are usually placed 1-3 pips beyond confirming structures.
EUR/USD:
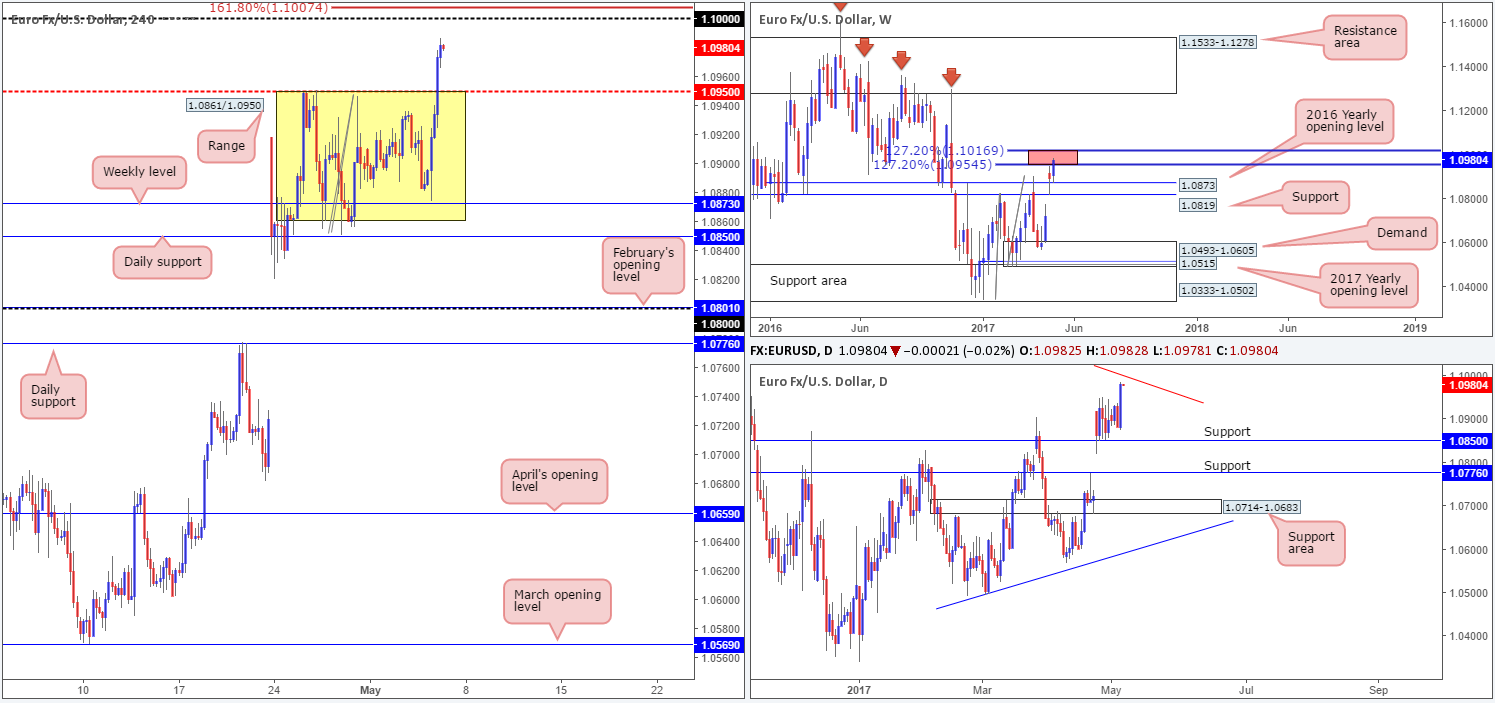
Going into the early hours of yesterday’s US segment, the single currency gathered momentum and broke above a multi-day H4 range fixed between 1.0861/1.0950. With the major now seen within striking distance of the large psychological number 1.10, where do we go from here? Well, technically speaking, 1.10 looks as if it could be an ideal neighborhood to consider shorting from. Apart from this level likely being watched by the majority of the market, we can also see that it converges beautifully with a 161.8% Fib ext. at 1.1007 drawn from the low 1.0851. In addition to this, we also have weekly action trading between two 127.2% Fib extensions (red zone) at 1.1016/1.0954 taken from the lows 1.0340/1.0493, and daily price is currently seen lurking just ahead of a trendline resistance extended from the high 1.1616.
Our suggestions: Shorting from 1.10, in our opinion, is a no brainer, since stops can comfortably be placed above the upper 127.2% Fib ext. level at 1.1016 on the weekly chart. However, traders are advised to pay attention to economic news today, as we have some heavy-hitters on the horizon!
Data points to consider: US Average hourly earnings, Non-farm employment change and Unemployment rate at 1.30pm. FOMC member Fischer speaks at 4.30pm. Fed Chair Yellen also takes the stage, as well as FOMC member Evans at 6.30pm GMT+1.
Levels to watch/live orders:
- Buys: Flat (stop loss: N/A).
- Sells: 1.10 region (stop loss: 1.1020).
GBP/USD:
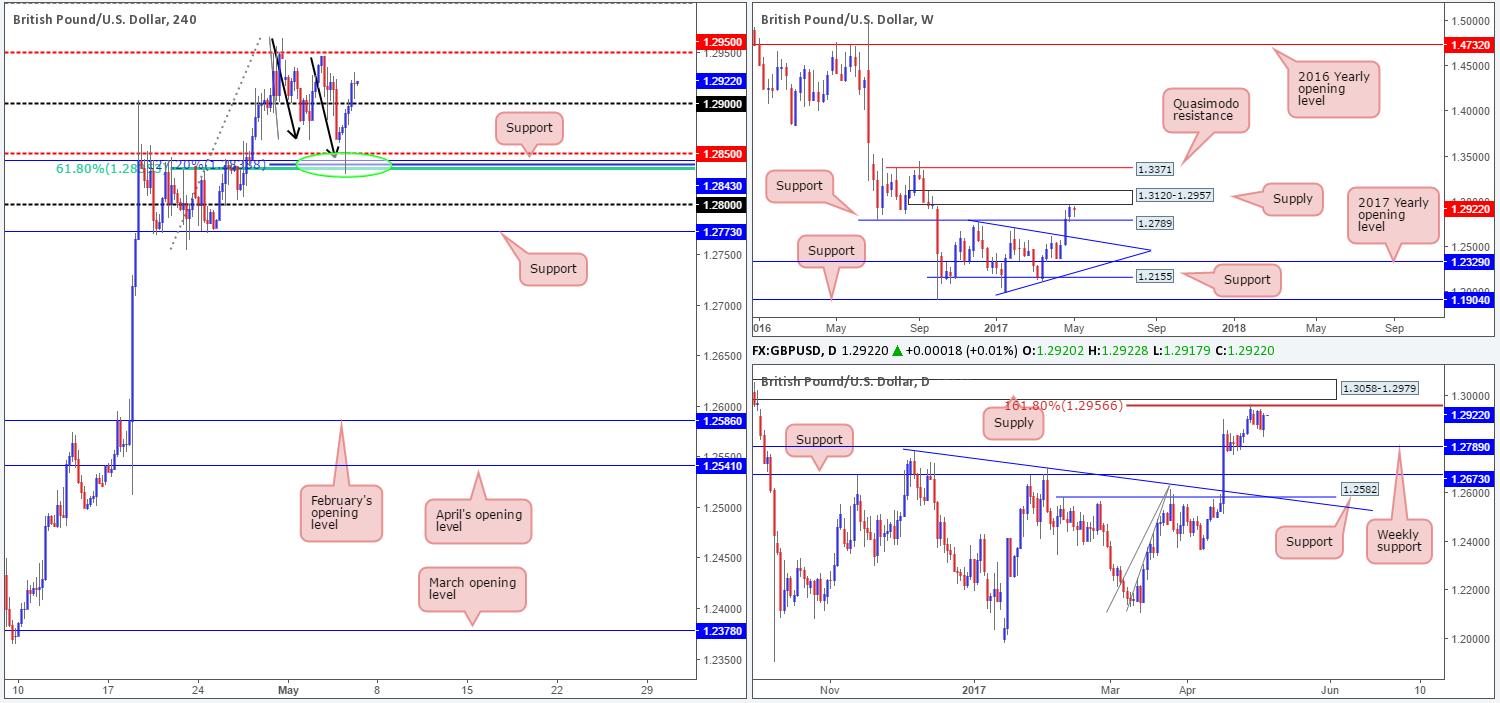
This is why we absolutely love areas of convergence! In Thursday’s report our team highlighted the H4 mid-level support at 1.2850 as a potential buy zone. We liked this area because it fused with a H4 61.8% Fib support at 1.2835, a H4 support at 1.2843 and a 127.2% H4 AB=CD (black arrows) Fib ext. at 1.2838 (taken from the high 1.2965). Unfortunately, we missed this long opportunity as we were unable to pin down a lower-timeframe confirming signal. Well done to any of our readers who managed to jump aboard here!
Moving forward, we can see that the 1.29 handle has recently been taken out which could encourage further buying up to the H4 mid-level resistance at 1.2950. Buying, however, could be a challenge. Not only is weekly supply at 1.3120-1.2957 now seen within striking distance, we also have the 161.8% daily Fib ext. at 1.2956 taken from the low 1.2108 to contend with. Therefore, rather than looking to buy this market, one may want to consider selling 1.2950!
Our suggestions: The H4 mid-level resistance at 1.2950, coupled with the daily 161.8% Fib ext. at 1.2956 and the underside of weekly supply at 1.2957, gives traders a high-probability zone to short from. One could be aggressive and take this level without waiting for additional confirmation, or take the conservative route and wait and see if H4 price prints a reasonably sized bearish candle (preferably a full-bodied candle).
Data points to consider: US Average hourly earnings, Non-farm employment change and Unemployment rate at 1.30pm. FOMC member Fischer speaks at 4.30pm. Fed Chair Yellen also takes the stage, as well as FOMC member Evans at 6.30pm GMT+1.
Levels to watch/live orders:
- Buys: Flat (stop loss: N/A).
- Sells: 1.2950 region ([waiting for a reasonably sized H4 bear candle to form before pulling the trigger is advised] stop loss: ideally beyond the candle’s wick).
AUD/USD:
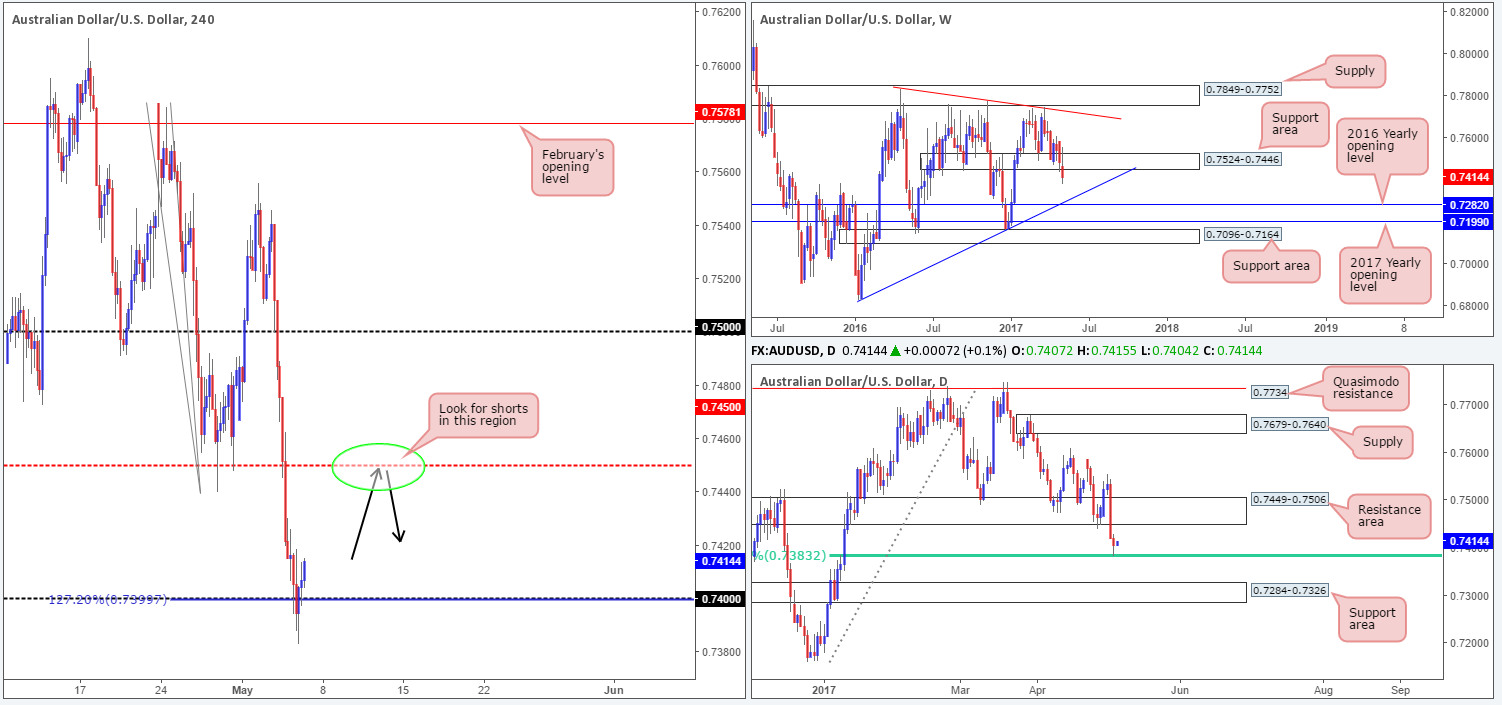
Following the break of the daily support area at 0.7449-0.7506 on Wednesday, the sell-side of this market continued to weigh down on this pair yesterday. However, the bulls have begun to make some noise around the 0.74 neighborhood. Notice on the H4 chart that there’s a near-perfect 127.2% Fib ext. convergence with this number, and over on the daily chart we have a long-term 61.8% Fib support in play at 0.7832 (drawn from the low 0.7159). Collectively, these levels could help lift the commodity currency up to at least the 0.7450 region today.
Our suggestions: Despite both the H4 and daily charts suggesting longs could be an option, weekly price continues to reflect a bearish stance as there’s little support seen until we connect with trendline support extended from the low 0.6827. Personally, we feel the better opportunity lies up at the 0.7450 barrier given its connection to the daily resistance area at 0.7449-0.7506, and current weekly direction.
Data points to consider: RBA monetary policy statement at 2.30am. US Average hourly earnings, Non-farm employment change and Unemployment rate at 1.30pm. FOMC member Fischer speaks at 4.30pm. Fed Chair Yellen also takes the stage, as well as FOMC member Evans at 6.30pm GMT+1.
Levels to watch/live orders:
- Buys: Flat (stop loss: N/A).
- Sells: 0.7450 neighborhood ([waiting for a reasonably sized H4 bear candle to form before pulling the trigger is advised] stop loss: ideally beyond the candle’s wick).
USD/JPY:
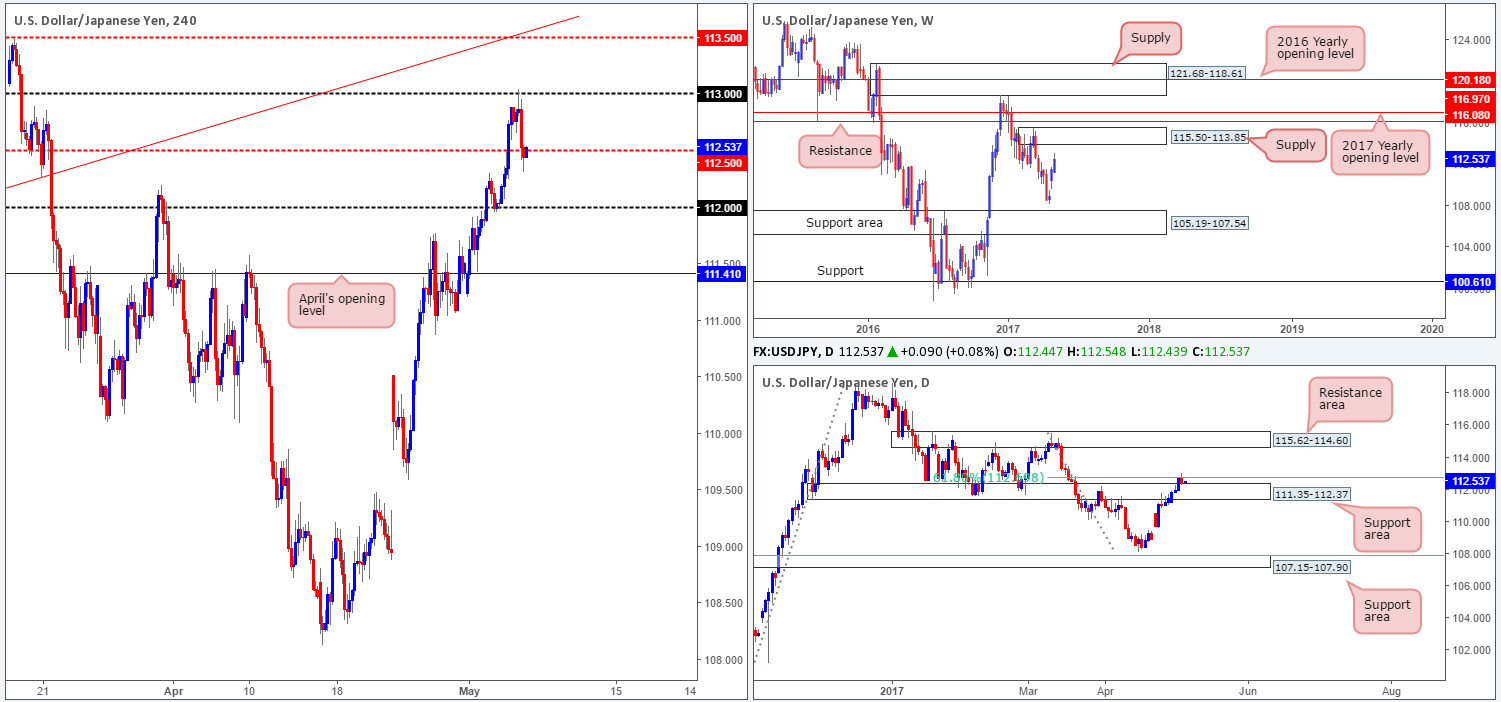
Unable to sustain gains beyond the 113 handle, the USD/JPY reversed yesterday and went on to test the H4 mid-level support at 112.50. Apart from 113, this recent downside move could have had something to do with the daily 61.8% Fib resistance at 112.69 drawn from the high 115.50. Despite this, buyers remain in a strong position at the moment. Not only do we have a daily support area at 111.35-112.37 in play right now, we also see room on the weekly chart for price to advance up to supply coming in at 115.50-113.85.
Our suggestions: For our team to become buyers in this market, the 61.8% daily Fib resistance at 112.69 will need to be taken out. Even better would be a H4 close above 113. That way, the path should be free up to the H4 mid-level resistance at 113.50 and trendline resistance extended from the low 111.68, followed closely by the said weekly supply.
Data points to consider: US Average hourly earnings, Non-farm employment change and Unemployment rate at 1.30pm. FOMC member Fischer speaks at 4.30pm. Fed Chair Yellen also takes the stage, as well as FOMC member Evans at 6.30pm GMT+1.
Levels to watch/live orders:
- Buys: Watch for H4 price to close above 113 and then look to trade any retest seen thereafter ([waiting for a reasonably sized H4 bullish candle to form following the retest is advised] stop loss: ideally beyond the candle’s tail).
- Sells: Flat (stop loss: N/A).
USD/CAD:
Starting from the top this morning, the weekly candles currently look poised to attack the 2016 yearly opening level at 1.3814. Down on the daily timeframe, however, price remains trading within the walls of a supply zone coming in at 1.3859-1.3700. Upside momentum, of course, could certainly diminish from within here, but we’re hoping to see the 2016 yearly opening level come into the picture beforehand.
A closer look at price action on the H4 timeframe shows that the bulls are currently tackling the mid-level resistance at 1.3750. Buy stops have likely been consumed around this region, which could prompt further buying up to the 1.38 handle.
Our suggestions: To our way of seeing things, entering long (medium/long term) is not a viable option at present. Shorts on the other hand, are. However, given our conservative nature, we would not be looking to commit until price has connected with the above noted 2016 yearly opening level (essentially around the 1.38 region). The reason being is that this line firmly positioned within the said daily supply and thus allows the trader to conservatively place stops above this area.
Data points to consider: US Average hourly earnings, Non-farm employment change and Unemployment rate at 1.30pm. FOMC member Fischer speaks at 4.30pm. Fed Chair Yellen also takes the stage, as well as FOMC member Evans at 6.30pm. Canadian employment figures also scheduled for release at 1.30pm GMT+1.

Levels to watch/live orders:
- Buys: Flat (stop loss: N/A).
- Sells: 1.3814/1.38 region is an ideal place for shorts since this area requires no additional confirmation (stop loss: conservative at 1.3861).
USD/CHF:
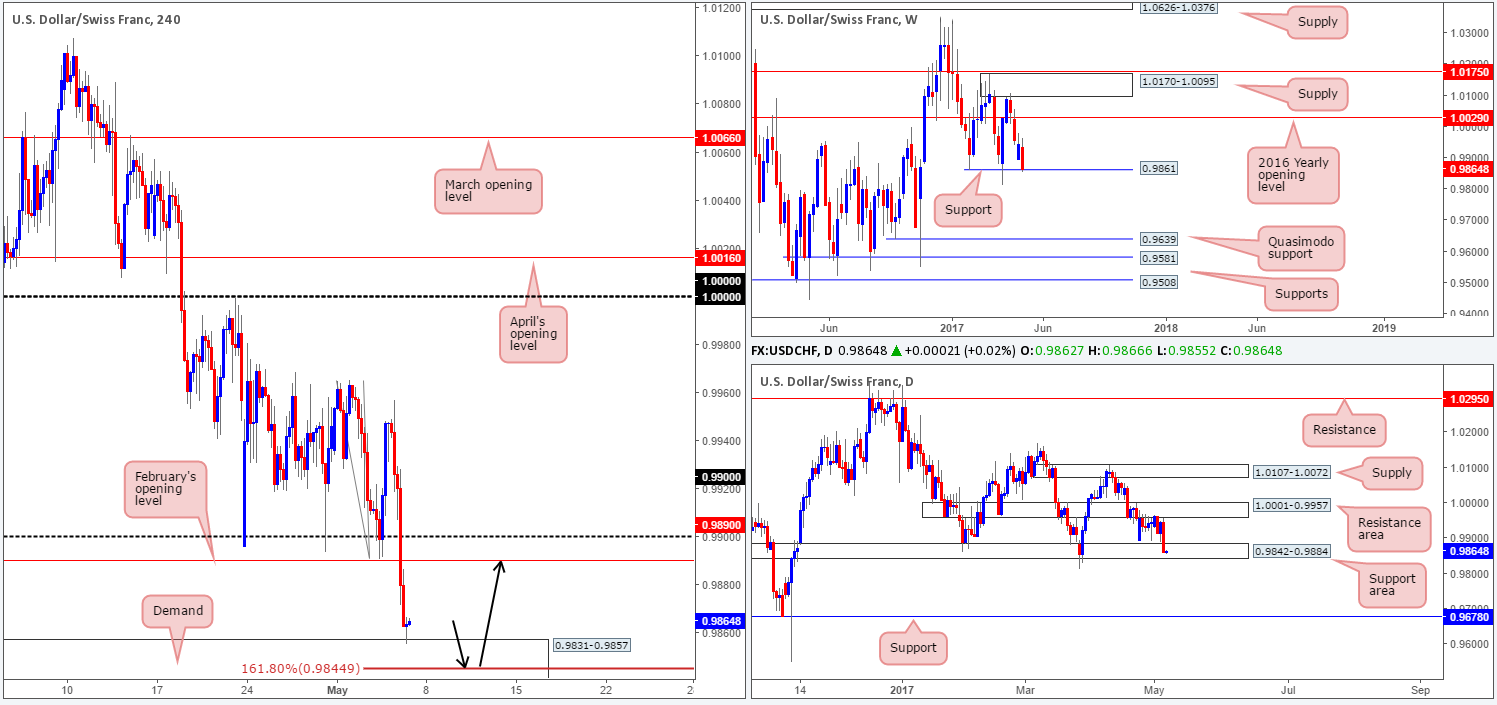
With the EUR/USD seen advancing to fresh highs, it was no surprise to see the USD/CHF had recently clocked fresh lows. Breaking through February’s opening level at 0.9890, the H4 candles recently interacted with demand penciled in at 0.9831-0.9857.
Based on this recent movement, we see two possible scenarios taking place:
- H4 bulls continue to push higher from the current demand base and retest February’s opening level as resistance.
- H4 price digs a little lower to test the 161.8% Fib ext. at 0.9844 (taken from the high 0.9965) seen within the said demand and rallies higher.
Why are we so bullish? Weekly action is in the process of testing a support level coming in at 0.9861 and daily flow recently checked in with a support area at 0.9842-0.9884.
Our suggestions: Personally, we favor the 0.9844 neighborhood for longs (see black arrows) solely on the basis that it has a better risk/reward ratio up to February’s opening level. In addition to this, traders may also want to take into account that the market boasts correlation confluence seeing as the EUR is expected to tumble from around the 1.10 mark.
Data points to consider: US Average hourly earnings, Non-farm employment change and Unemployment rate at 1.30pm. FOMC member Fischer speaks at 4.30pm. Fed Chair Yellen also takes the stage, as well as FOMC member Evans at 6.30pm GMT+1.
Levels to watch/live orders:
- Buys: 0.9844 is a nice area to consider longs from without the need for additional confirmation, given its connection to the higher timeframes (stop loss: 0.9829).
- Sells: Flat (stop loss: N/A).
DOW 30:
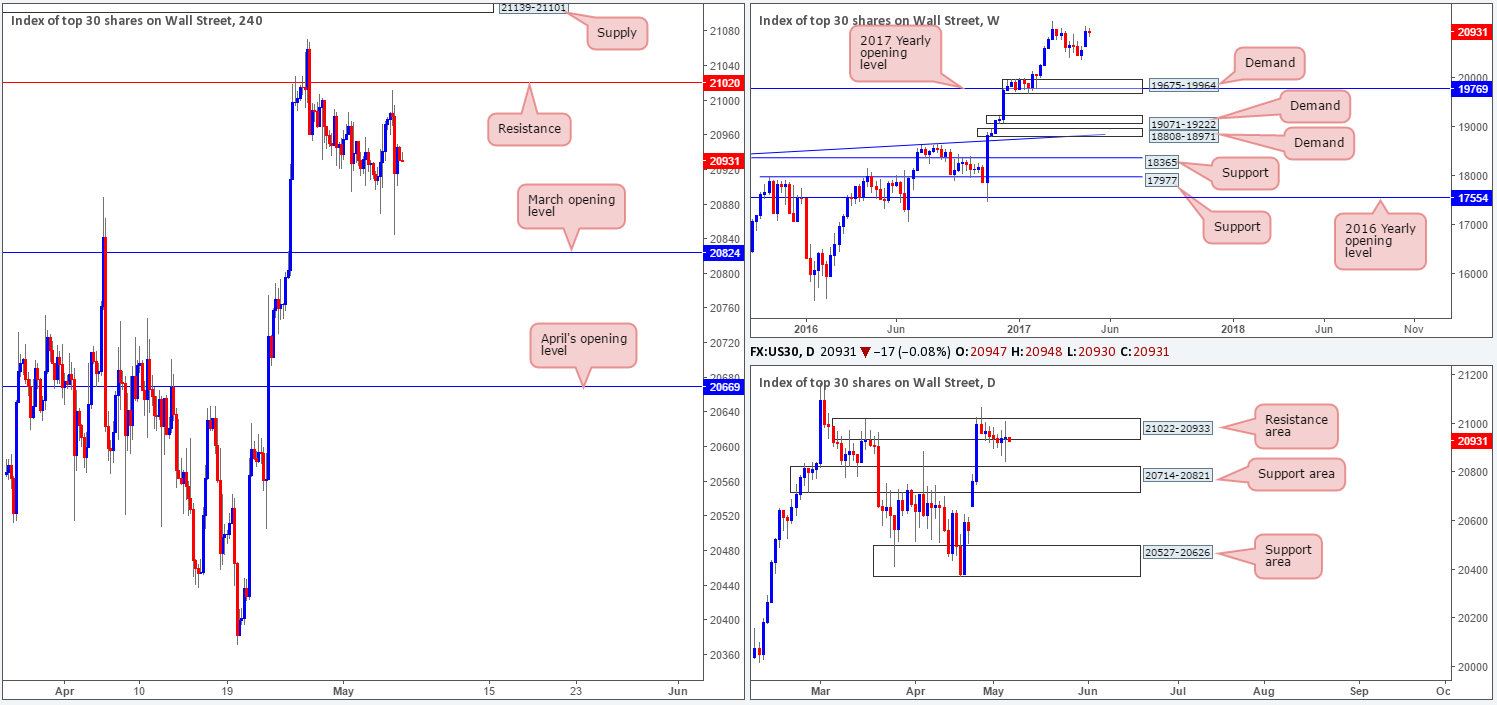
US equities are little changed this morning, despite the index ranging over 160 points. Daily price remains capped by the resistance area at 21022-20933, and H4 action came within a cat’s whisker of clipping the resistance level pegged at 21020. On the other hand, weekly flow still looks poised to continue marching higher which could eventually see the market reach a new record high.
Our suggestions: Overall, we’re not too impressed with the DOW’s technical structure at the moment. However, given where price is positioned on the weekly chart, we do eventually expect the unit to punch higher and continue trending northbound.
Data points to consider: US Average hourly earnings, Non-farm employment change and Unemployment rate at 1.30pm. FOMC member Fischer speaks at 4.30pm. Fed Chair Yellen also takes the stage, as well as FOMC member Evans at 6.30pm GMT+1.
Levels to watch/live orders:
- Buys: Flat (stop loss: N/A).
- Sells: Flat (stop loss: N/A).
GOLD:
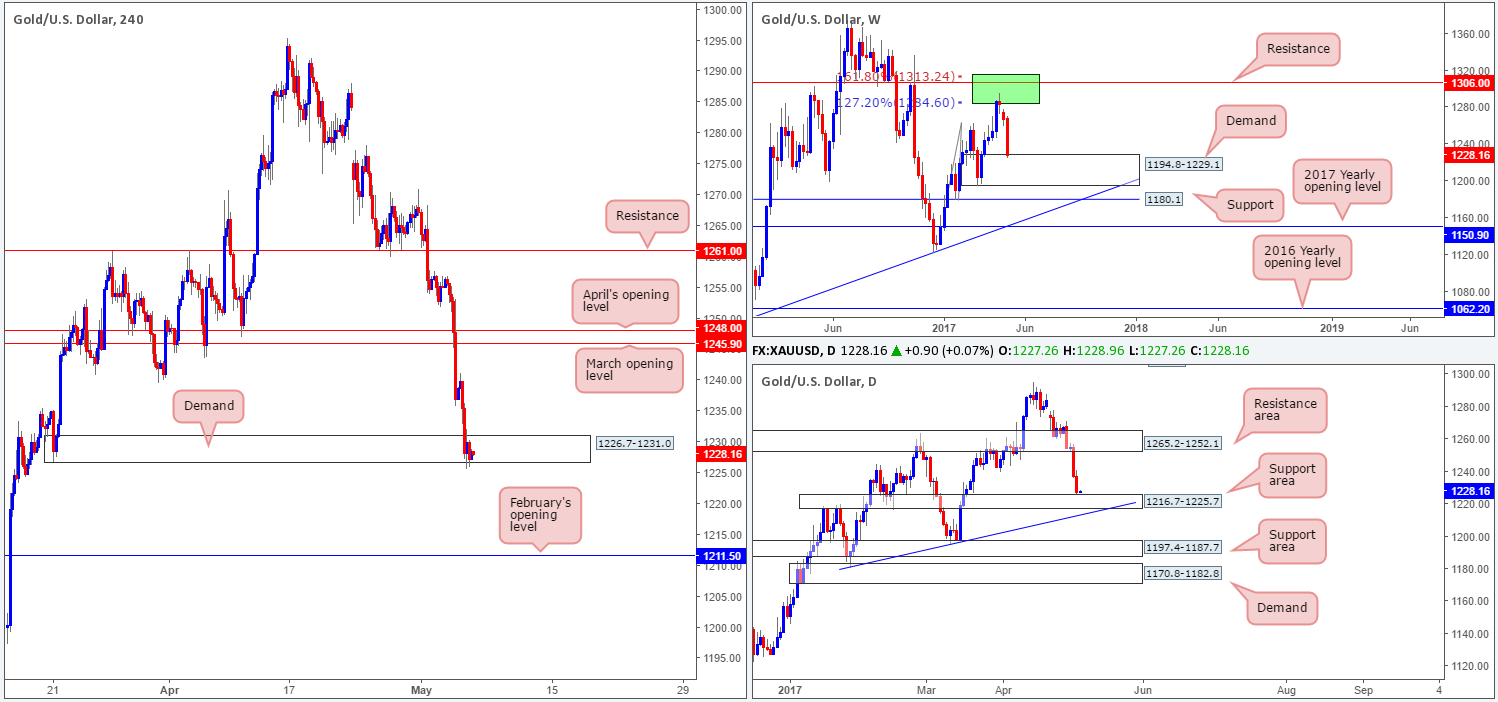
In recent trading, we’ve seen the yellow metal dragged down to weekly demand at 1194.8-1229.1, which happens to also boast additional support from a daily support zone coming in at 1216.7-1225.7.
Turning our attention over to the H4 candles, bullion is currently seen testing a demand base at 1226.7-1231.0. So far, however, the bulls have yet to register anything noteworthy. Beyond this area, we see little support until price reaches February’s opening base line at 1211.5.
Our suggestions: Looking for longs around the current H4 demand base is an option given its relationship with both weekly demand and the daily support area. Still, there’s always that chance that the market may drop lower to test February’s opening line, which is located below the daily support zone but still within the walls of weekly demand.
Therefore, we see two options here:
- Attempt to enter long around the current H4 demand and target March’s opening level at 1245.9 as your initial take-profit target.
- Wait and see if H4 price breaks through the current demand and attacks February’s opening line, which would make the current demand (at that point it’d be a resistance area) your initial take-profit area.
Personally, we favor the former owing to the H4 demand being set nearby BOTH weekly and daily structures (see above). However, for us to get involved here, we are going to need to see some effort from the bulls first. A full-bodied bullish candle printed from this area would be ideal!
Levels to watch/live orders:
- Buys: 1226.7-1231.0 ([waiting for a reasonably sized H4 bull candle to form before pulling the trigger is advised] stop loss: ideally beyond the candle’s tail).
- Sells: Flat (stop loss: N/A).


