
EUR/USD:
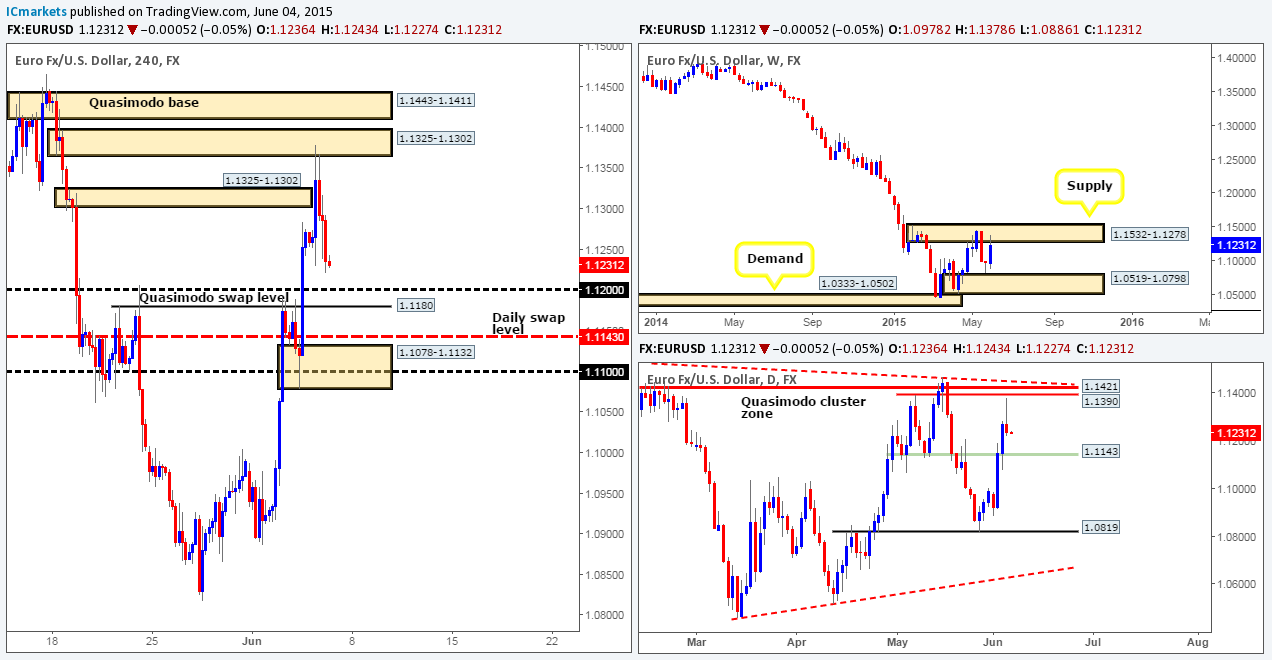
Weekly view – From a long-term standpoint, the downtrend on this pair is still very much intact. It’s only once/if we see a close above the current weekly supply area at 1.1532-1.1278 will we be convinced the trend may be shifting direction.
Daily view: The daily timeframe shows that price did indeed continue to rally, which, as you can see, came within a stone’s throw away from connecting with the daily Quasimodo cluster zone at 1.1390/1.1421 (located deep within the aforementioned weekly supply area) before aggressively selling off.
4hr view: From this scale, we can see that the Euro launched itself north during the early hours of the London session. This consequently destroyed the 4hr supply area at 1.1325-1.1302(converges beautifully with the aforementioned daily Quasimodo cluster zone) , and as a result continued north to tag in a small 4hr supply area at 1.1325-1.1302, before heavily selling off for the rest of the day.
With price now seen nearing the Quasimodo swap/round-number area at 1.1180/1.1200, a lot of traders are likely thinking ‘buy’, and they could very well be correct. However, we’d much rather wait to see if price connects with the daily swap area seen below at 1.1143 before we consider any type of long trade. The reason for why simply comes from seeing price trading from higher timeframe resistances at the moment (see above) which show room for further selling.
On a side note here guys, please do not forget it is NFP day today and heavy market moves are likely so be mindful of trading around this time!
Levels to watch/live orders:
- Buys: 1.1143 region [Tentative – confirmation required] (Predicative stop-loss orders seen at: dependent on where one confirms this area).
- Sells: Flat (Predicative stop-loss orders seen at: N/A).
GBP/USD:
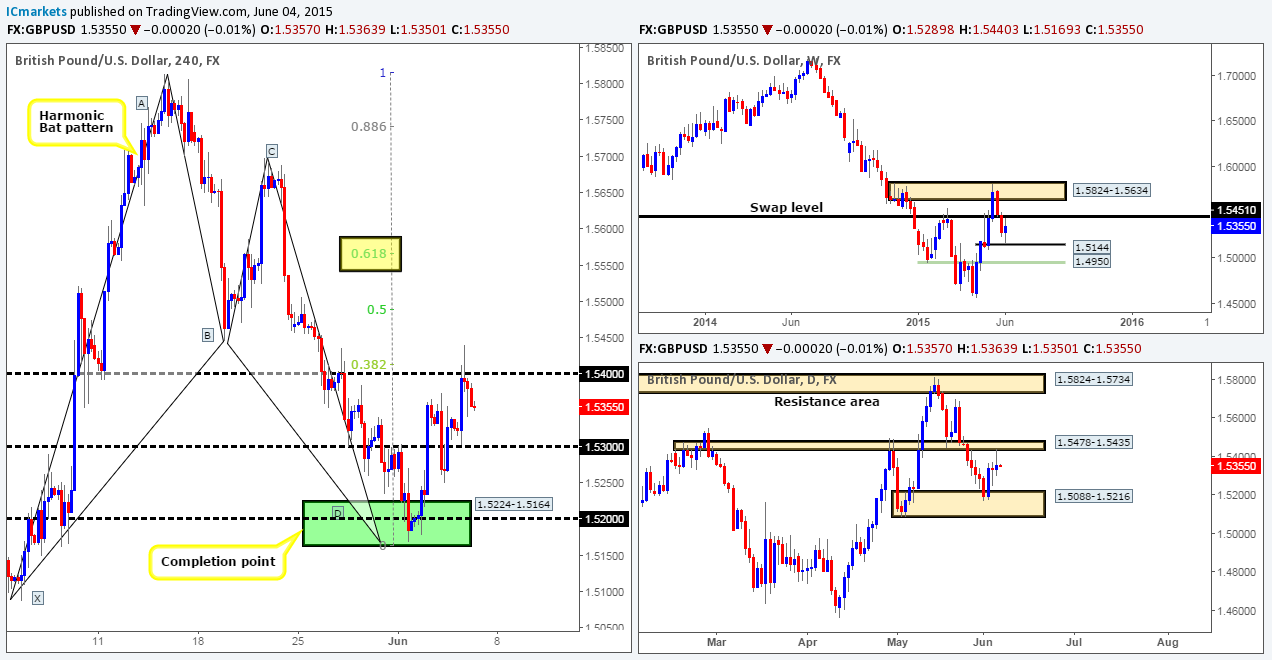
Weekly view – Following the rebound seen from the 1.5144 region, price recently connected with the lower limits of a long-term weekly swap level at 1.5451.
Daily view: Once again, the volatility seen during yesterday’s session was quite heavy. This saw the GBP hit a daily swap area seen at 1.5478-1.5435, which forced the market to close only 19 pips above yesterday’s closing price.
4hr view: For those who read yesterday’s report on the GBP, you may recall that we are currently long (1.5228) this pair from the top side of the 4hr Harmonic Bat completion area seen in green at 1.5224-1.5164 (located around the upper limits of the aforementioned daily demand area). We also mentioned that if price hit 1.5400 (converges with 0.382 – A-D retracement), we’d likely look to move our stop to breakeven and take some profit, which is what we have done. 70% of our position has already been liquidated and our stop-loss order is firmly sitting at breakeven plus five pips. Essentially, we’re in a risk-free trade and will either let this position stop us out at breakeven or rally to our final take profit level set around the 1.5550 mark – the 0.618 Fibonacci retracement level.
With regards to today’s potential movement, we are expecting price to consolidate ahead of the NFP release. Numbers to keep an eye on during the announcement are 1.5300 and 1.5400. A sustained move above 1.5400 going into the weekend will of course be a fantastic result for us.
Levels to watch/ live orders:
- Buys: 1.5228 [Live – 70% of position has now been liquidated] (Predicative stop-loss orders seen at: set at breakeven plus five pips).
- Sells: Flat (Predicative stop-loss orders seen at: N/A).
AUD/USD:
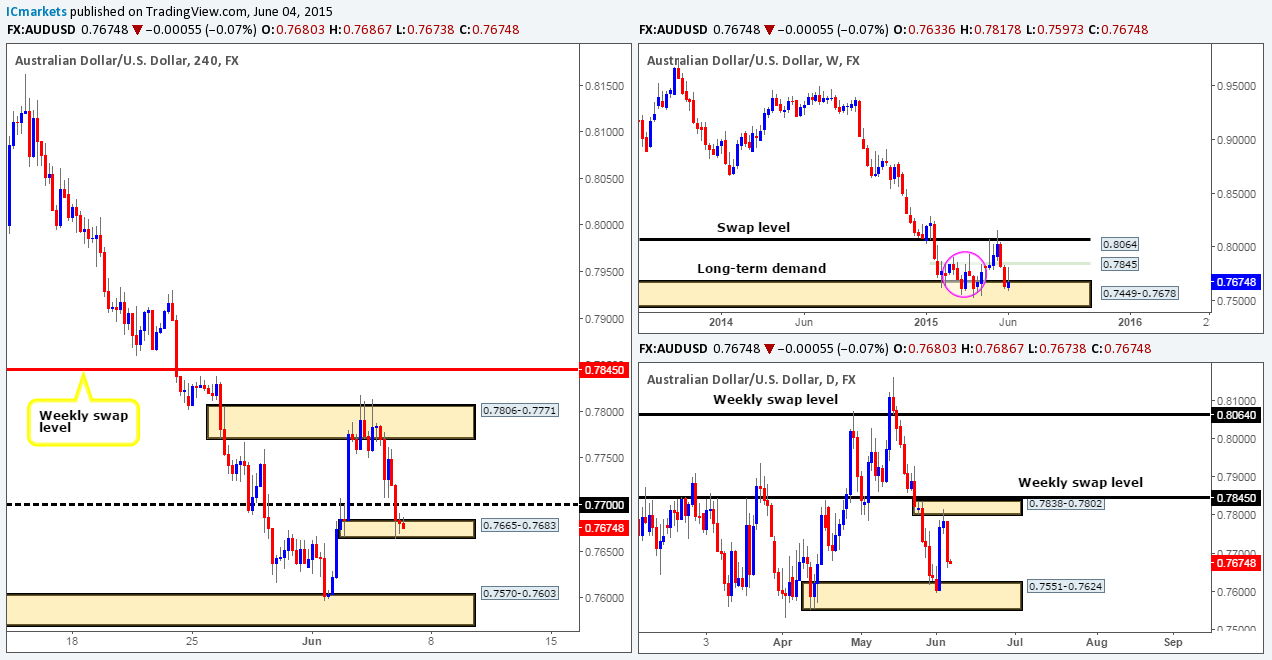
Weekly view – Long term, the trend on this pair is still southbound in our opinion, and will remain that way until we see a convincing push above 0.8064.
Current action on the other hand, shows that price is now trading within a long-term weekly demand area coming in at 0.7449-0.7678. Judging by the sloppy reaction seen (pink circle – 02/02/15-06/04/15) at this zone a few months earlier, however, things could potentially get messy here once again.
Daily view: The daily timeframe reveals that price heavily sold off from the small daily supply area seen at 0.7838-0.7802 during yesterday’s session. In the event that price continues to fall today, it is likely we’ll see the buyers and sellers go toe-to-toe around daily demand at 0.7551-0.7624.
4hr view: The AUD/USD pair’s recent descent saw price absolutely obliterate 0.7700 and slam dunk itself into a small 4hr demand area at 0.7665-0.7683. Buying from this 4hr zone is not really something our team would be comfortable taking part in due to potential resistance sitting just above at 0.7700. A break above and confirmed retest of 0.7700 would be a different story entirely, as the path north will then likely be clear up to at least 0.7750, or even the 4hr supply base that was recently faked, 0.7806-0.7771.
Assuming that the current 4hr demand area is engulfed later on today, this could stimulate a decline towards 4hr demand at 0.7570-0.7603 (located within the aforementioned daily demand area).Should this occur, we’d then need to see price retest this area as supply and display some form of lower timeframe confirmation signal (Pin bar, trendline break etc…) before we consider risking capital.
Levels to watch/ live orders:
- Buys: Flat (Predicative stop-loss orders seen at: N/A).
- Sells: Flat (Predicative stop-loss orders seen at: N/A).
USD/JPY:
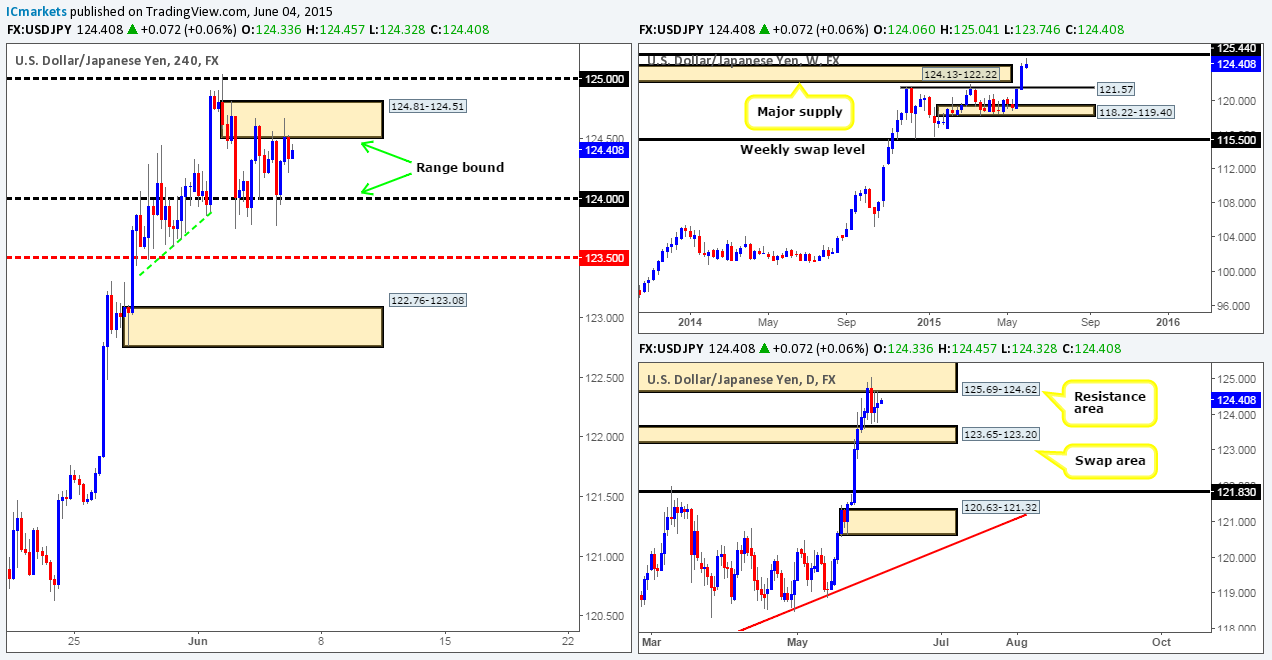
Weekly view – Essentially, the outlook on this pair remains positive. It is only once we see a close below the weekly swap level 115.50 will we be convinced the trend may be shifting.
Following the recent break above weekly supply at 124.13-122.22, active sellers appear to be entering the market forty pips from below a major weekly swap level coming in at 125.44. Should further selling be seen from here, we see very little supportive pressure coming into the market until 121.57 – a weekly swap level.
Daily view: The daily timeframe shows that price continues to trade in between a daily resistance area seen at 125.69-124.62 (surrounds the aforementioned weekly swap level) and a daily swap zone at 123.65-123.20.
4hr view: During yesterday’s sessions, we can see that the market continued to trade between 124.00 and the 4hr supply area at 124.81-124.51. Trading within this current ranging band which stretches only fifty pips is not something we would feel comfortable participating in as it’s the last trading day of the week, and the mighty NFP announcement later on will likely force price to breakout from this 4hr consolidation.
However, even once a decision is made within this 4hr range, traders will need to be very careful as beyond these two zones, areas of support and resistance are sitting close by. Just below the 124.00 number, 1.2350 is waiting to provide support to the market. Conversely, just above the 4hr supply zone, lurks round-number resistance at 125.00
Therefore, with everything taken into consideration, we have decided to remain flat on this pair until at least thirty or so minutes after the NFP data has been released.
 Levels to watch/ live orders:
- Buys: Flat (Predicative stop-loss orders seen at: N/A).
- Sells: Flat (Predicative stop-loss orders seen at: N/A).
USD/CAD:
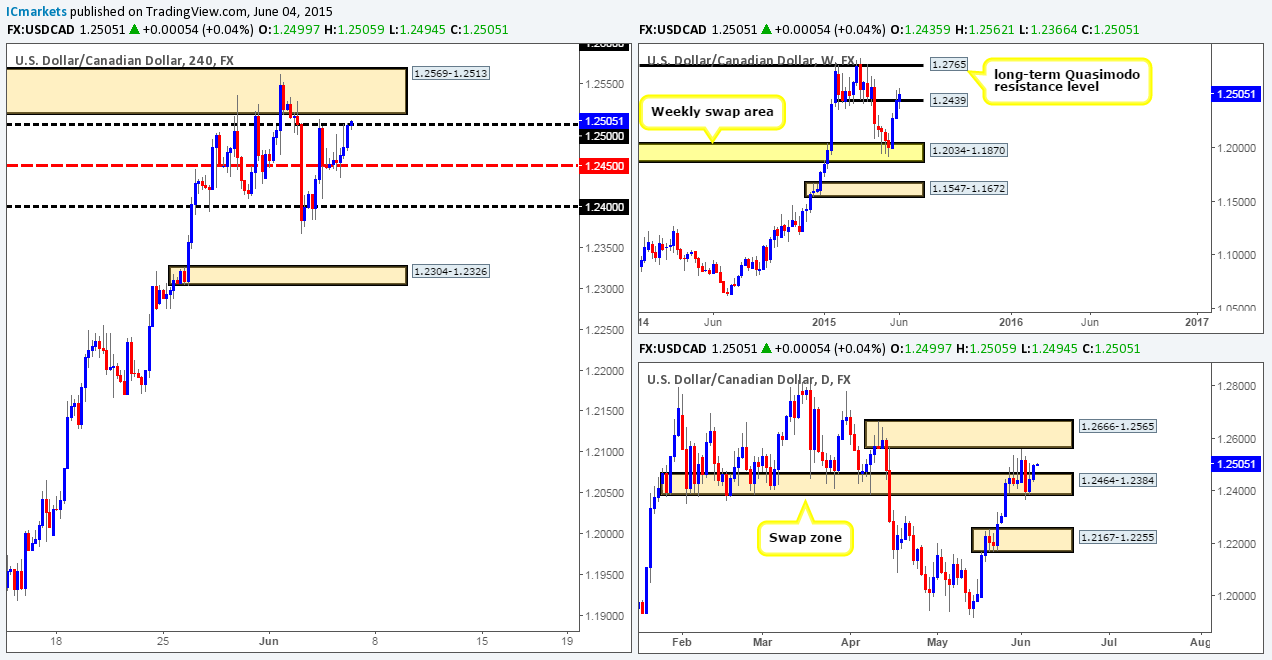
Weekly view – Overall, the trend on this pair is still pointing north. A break below the weekly swap area 1.2034-1.1870 would be required to invalidate this bias. Current action, however, shows that the buyers seem to be the more dominant force at this time around the weekly swap (resistance) level coming in at 1.2439.
Daily view: From this angle, we can see that price is now trading mid-range between a weak-looking daily swap (demand) area seen at 1.2464-1.2384 and a daily supply area at 1.2666-1.2565.
4hr view: After price shook hands with the mid-level number 1.2450 yesterday, a rally was seen mid-way through the London session, which as you can see continued going into the U.S session. This move consequently saw price connect with the round number 1.2500, which, at the time of writing, has seen very little interest from the sellers.
With everything taken into consideration, we do not see any immediate opportunity to trade this pair today. Granted, one could look to short the combined round number/4hr supply area at 1.2500/1.2569-1.2513, but with price having already tested this zone several times already, and weekly buying pressure being seen around the aforementioned weekly swap level, we intend to steer clear of shorts from this area. Therefore, unless we see more favorable price action following the NFP release, we will remain flat.
Levels to watch/ live orders:
- Buys: Flat (Predicative stop-loss orders seen at: N/A).
- Sells: Flat (Predicative stop-loss orders seen at: N/A).
USD/CHF:
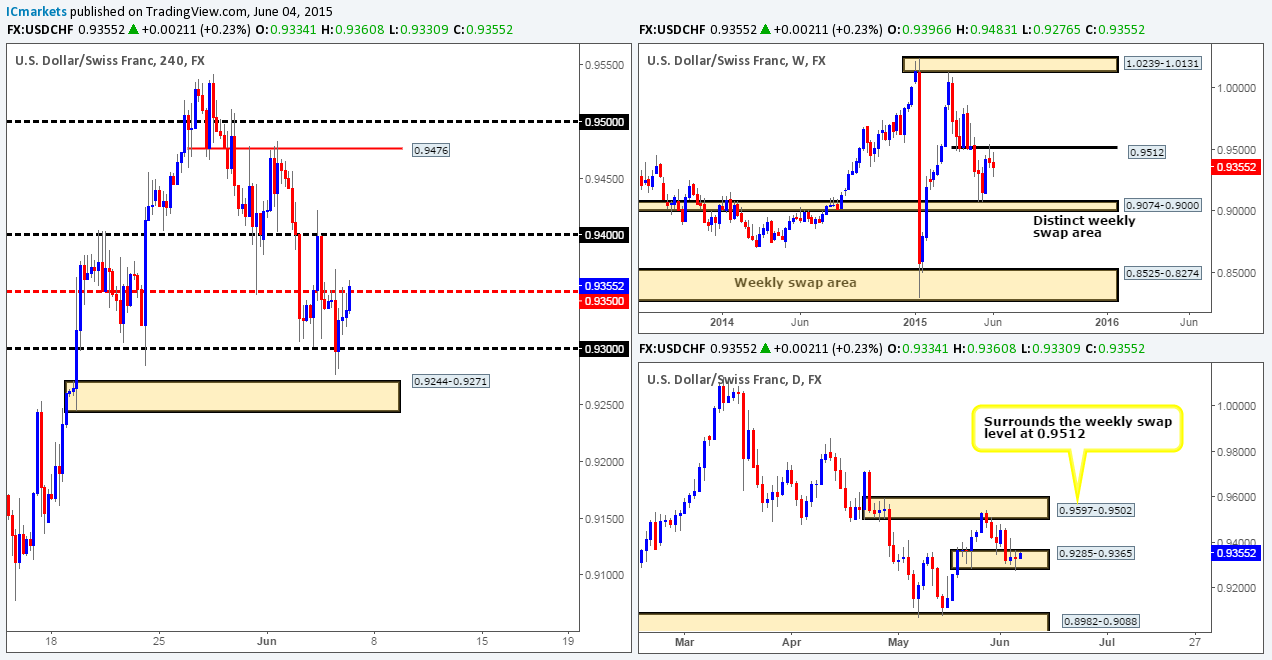
Weekly view – Following last week’s rebound from the weekly swap level 0.9512, follow-through selling has been seen. Provided that the sellers can maintain this position, it is possible we may see price attack the weekly swap area seen at 0.9074-0.9000 sometime in the next few weeks.
Daily view: From this angle, we can see price remains trading within the daily demand area base at 0.9285-0.9365. A small break below this zone was seen during yesterday’s session, however, which, in our opinion, could mean one of two things. The first, it could have been a stop run to accumulate liquidity (sell stops) for a push higher. Secondly, it may have been continuation spike – essentially the same as a stop run but with a different intention. Considering the location of price on the weekly timeframe at the moment (see above), we favor the latter.
4hr view: The 4hr timeframe shows that the USD/CHF pair collapsed around the London open, resulting in a deep fakeout below the round number 0.9300. Following this, price rallied for the remainder of the day up to the mid-level number 0.9350. In the event that price manages to close above this level today, which it looks like it is going to, we may have a potential intraday long opportunity.
The close above 0.9350 would likely attract further buying towards 0.9400. To take advantage of this move, one could either buy at the close of the current candle, effectively buying the breakout, or if you’re conservative like us, wait to see if price retests 0.9350 as support, and buy with lower timeframe confirming price action. However, we must stress the importance of risk/reward here. Since your first take-profit hurdle falls in at around fifty pips – 0.9400,
If one cannot find an entry with a stop allowance of 15-20 pips we would personally pass on the trade.
Levels to watch/ live orders:
- Buys: Flat (Predicative stop-loss orders seen at: N/A).
- Sells: Flat (Predicative stop-loss orders seen at: N/A).
US 30:
Weekly view – Overall, this index is still in a very strong uptrend. A push below the weekly support level 16051 would be required to invalidate this bias.
The latest coming in from this timeframe, however, shows that relatively strong resistance came into the market recently from the 18279 region. In the event that the sellers continue to push this market south, we may see price challenge the weekly swing low 17556.
Daily view: Yesterday’s action reveals that the DOW sold off, resulting in price taking out the daily trendline extended from the low 17033, and coming within a few points of connecting with a daily support level seen at 17850.
4hr view: From this angle, we can see that price is still ranging between 4hr supply coming in at 18208-18171, and a 4hr demand area at 17917-17989.
The recent decline in value, nonetheless, saw price aggressively spike below the lower limit of the aforementioned 4hr consolidation. Assuming that this break was a fakeout, which we believe it very likely was, we could potentially see this market rally from here today. Does this mean that we’re going to enter long right now? Not necessarily. Here’s why… Technically, price has been selling off with strength on the weekly timeframe recently, and as we see no sign of support until 17556, this is a concern when we’re looking to enter long in this market. Furthermore, with the NFP number being released later on today, this invariably causes aggressive ripples in the market, which could invalidate this fakeout and cause a loss. Therefore, even though we’re in a potential buy zone on the 4hr and daily timeframe (see above) at the moment, we feel it is best to hold fire, and wait until the NFP has had its way before making our next decision.

Levels to watch/ live orders:
- Buys: Flat (Predicative stop-loss orders seen at: N/A).
- Sells: Flat (Predicative stop-loss orders seen at: N/A).
XAU/USD (Gold)
Weekly view – From a long-term perspective, the gold market is still trending south in our opinion. For this bias to be invalidated, a push above the weekly trendline extended from the high 1488.0 would need to be seen
Recently, however, price has been driven deep into a small weekly demand area at 1170.3-1188.4, which at the time of writing, has seen very little interest from the buyers.
Daily view: Following Wednesday’s bear candle that printed on top of the daily buy zone at 1170.3-1184.0 (located within the aforementioned weekly demand area), the gold market sold off yesterday, resulting in price now trading within the lower limits of this daily buy area.
4hr view: Amid yesterday’s sessions, the fresh selling resulted in the market closing below the 4hr demand area at 1178.7-1184.6, and testing a 4hr Quasimodo support level coming in at 1175.1.
With price sitting deep within weekly and daily demand at the moment (see above), our attention will be mostly driven toward longs today. Granted, we can see there is not really much buying interest coming from the aforementioned higher timeframe supportive structures, but until they are consumed, it would be foolish of us to disregard them at this point.
Before we consider buying from the 1175.1 4hr Quasimodo support level, we would need to see a break above the high 1179.6. This would likely confirm price is heading to at least the 4hr supply area seen at 1186.1-1184.3. However, we intend to be extra careful trading this market today since even with a break above this high, the NFP release could invalidate this technical signal and potentially cause a loss. As such, we intend to evaluate the situation before and after the NFP is announced. Should this setup still be valid, and we manage to find an entry on a retrace following a break of the high 1179.6, we’d confidently take this trade long and possibly leave it open over the weekend…

Levels to watch/ live orders:
- Buys: 1175.1 [Tentative – waiting for a break above 1179.6 before considering a long] (Predicative stop-loss orders seen at: dependent on where one confirms this level following confirmation).
- Sells: Flat (Predicative stop-loss orders seen at: N/A).