
Key risk events today:
Canada Employment Change and Unemployment Rate; US Average Hourly Earnings, Non-Farm Employment Change and Unemployment Rate.
(Previous analysis as well as outside sources – italics).
EUR/USD:
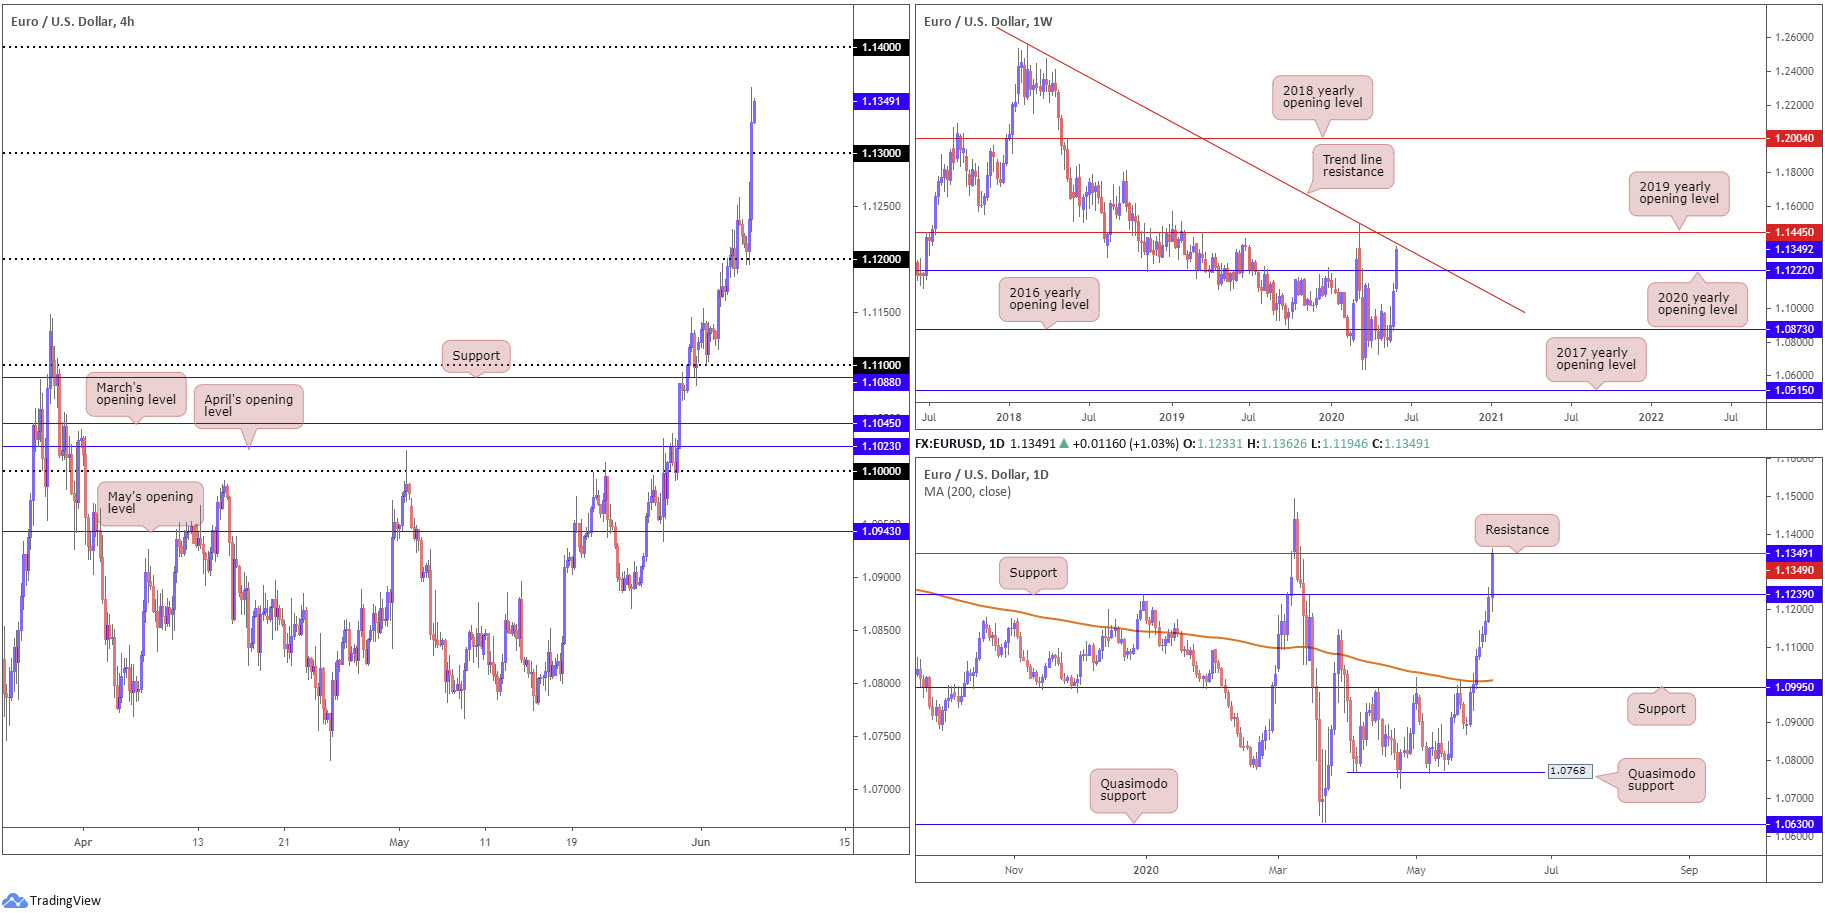
EUR/USD bulls entered a strong offensive phase Thursday, following Eur130 billion German fiscal stimulus, with additional impetus provided by the ECB exceeding expectations for a Eur500 billion PEPP boost.
After retesting 1.12 as support, H4 lifted through both 1.1250 and 1.13 to clock a session high of 1.1362. This, as evident from the chart, positions the 1.14 handle within reach.
Technically, latest bidding also breached the 2020 yearly opening level at 1.1222 (regarded as strong resistance) on the weekly timeframe, landing the pair within striking distance of trend line resistance, extended from the high 1.2555. In terms of the daily timeframe, yesterday crossed through resistance at 1.1239 and recently touched gloves with another layer of resistance at 1.1349. It might also be of interest to note the 200-day SMA (orange – 1.1012) is beginning to show signs of flattening after drifting lower since May 2018.
Areas of consideration:
Well done to any readers who managed to catch the 1.12 retest yesterday – an absolutely awesome move boasting strong risk/reward.
A retest at 1.13 could emerge today, though would have traders entering long into daily sellers off resistance at 1.1349. However, knowing we have room to explore higher ground on the weekly timeframe until connecting with trend line resistance, 1.13 remains a possible support to watch for today. Conservative players may still seek H4 bullish candlestick confirmation off 1.13 before pulling the trigger.
GBP/USD:
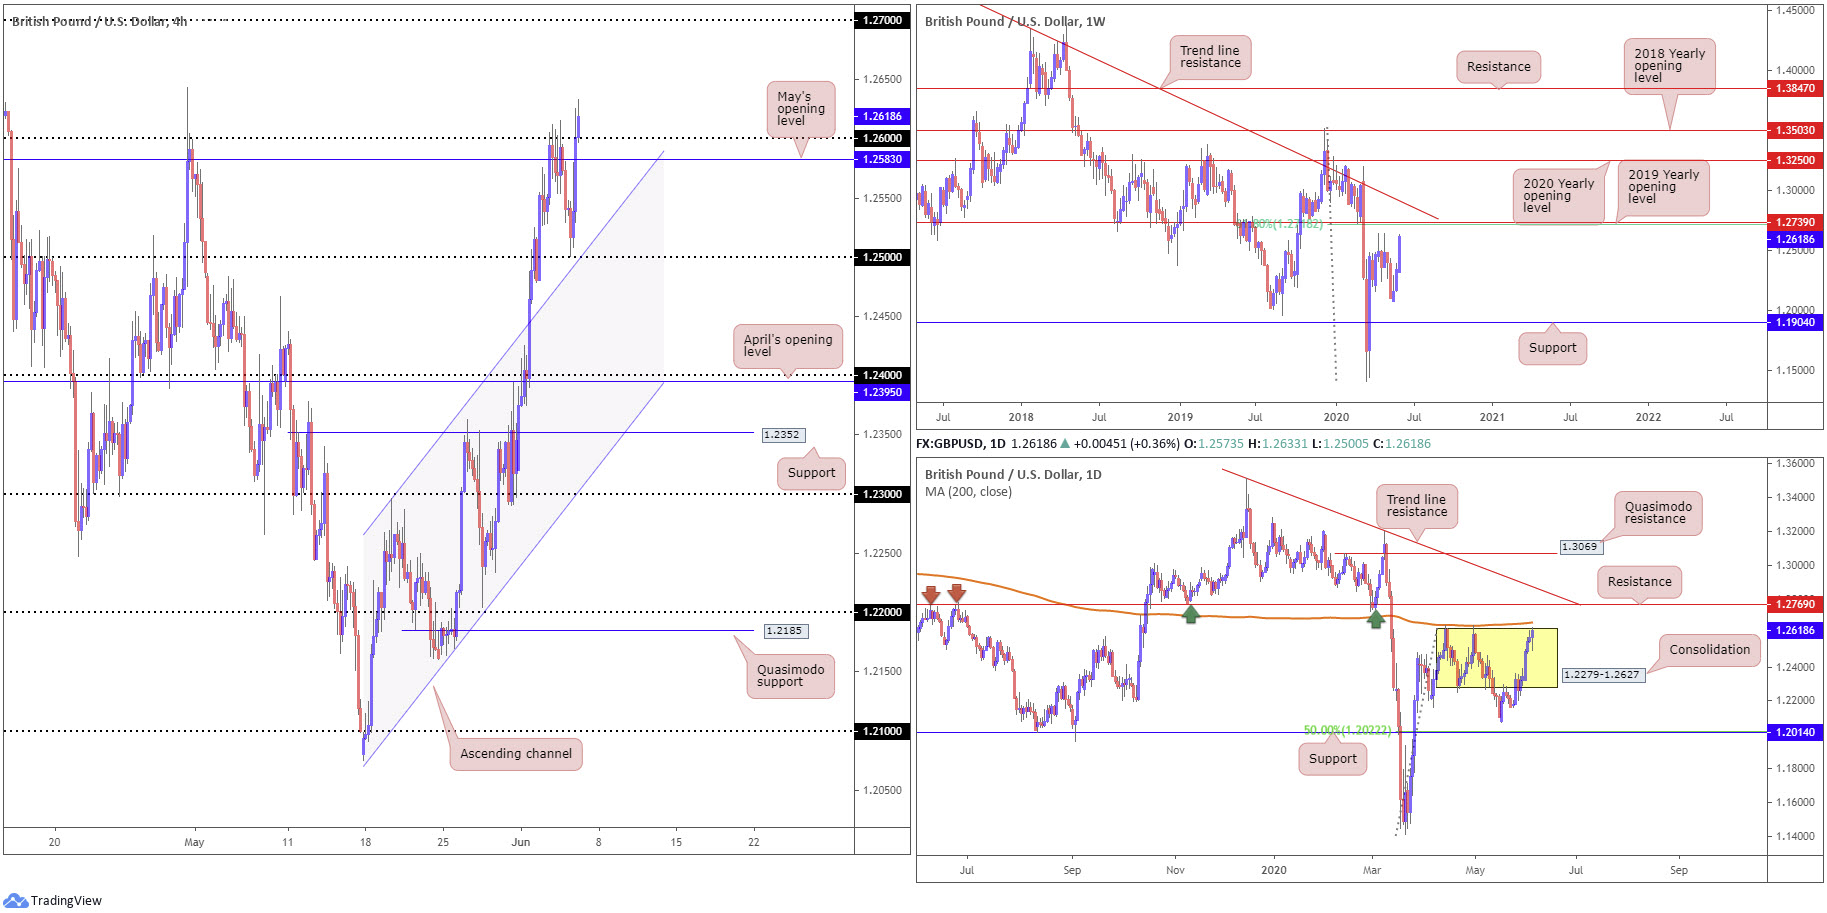
Sterling bids regrouped into London hours on Thursday following a technical pullback emerging to 1.25. Bolstered by a soft dollar, the day settled north of May’s opening level at 1.2583 and the 1.26 handle on the H4 timeframe, with signs the pair wants to grip tops at around 1.2644, followed perhaps by an approach to 1.27.
GBP/USD, from the weekly timeframe, appears poised to attempt a run to 1.2739, the 2019 yearly opening level, and a 61.8% Fibonacci retracement ratio at 1.2718, sited a handful of pips under trend line resistance, extended from the high 1.5930.
Analysis on the daily timeframe has candle action toying with range tops at 1.2627, closely reinforced by the 200-day SMA (orange – 1.2663). A violation to the upside here could have price face resistance coming in at 1.2769.
Areas of consideration:
Well done to any readers who managed to jump in short between the 1.26 handle on the H4 timeframe and daily range tops at 1.2627 as this was noted resistance in recent writing.
Going forward, upside could potentially stretch as far north as the 2019 yearly opening level at 1.2739 on the weekly timeframe. However, selling may develop off daily range tops at 1.2627, forcing a retest at 1.26/May’s opening level at 1.2583. H4 bullish candlestick confirmation out of this area may, therefore, appeal to buyers, with an ultimate upside target set based on the weekly timeframe.
AUD/USD:
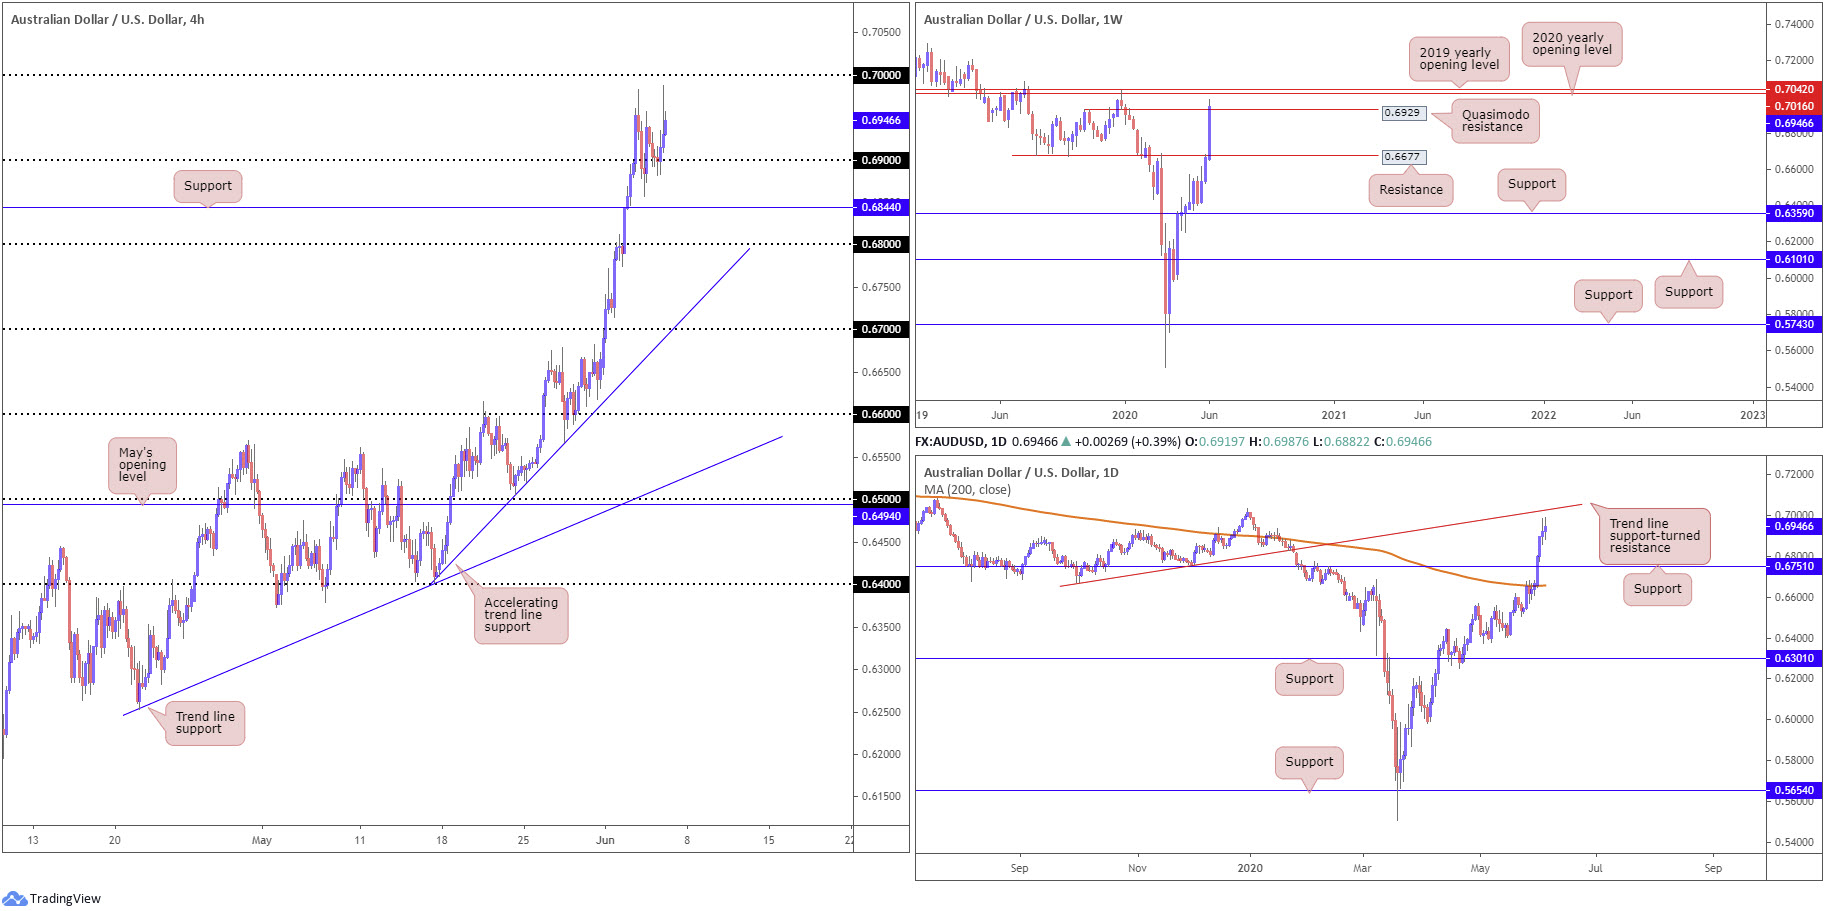
Short-term action, based on the H4 timeframe Thursday, invited an approach to 0.69 as support. Despite having dipped a toe under the figure, price action absorbed offers and reached a high of 0.6987, closing higher for a sixth consecutive session and moving the key figure 0.70 into view.
Meanwhile, led by USD underperformance, weekly price is seen attempting to climb above Quasimodo resistance at 0.6929, shining the spotlight on the 2020 yearly opening level at 0.7016 and the 2019 yearly opening level at 0.7042.
With reference to the daily timeframe, we can see momentum has slowed over the past couple of days with candle bodies shrinking ahead of trend line support-turned resistance, taken from the low 0.6670. In addition, we can also see the 200-day SMA (orange – 0.6657) toying with the idea of flattening after trending lower since April 2018.
Areas of consideration:
Traders interested in longs off 0.69 appear to have missed the boat.
Should 0.70 make an appearance, this could appeal to countertrend traders as a port of resistance given its close connection with the 2020 yearly opening level at 0.7016 on the weekly timeframe and trend line resistance (0.6670) on the daily timeframe.
USD/JPY:
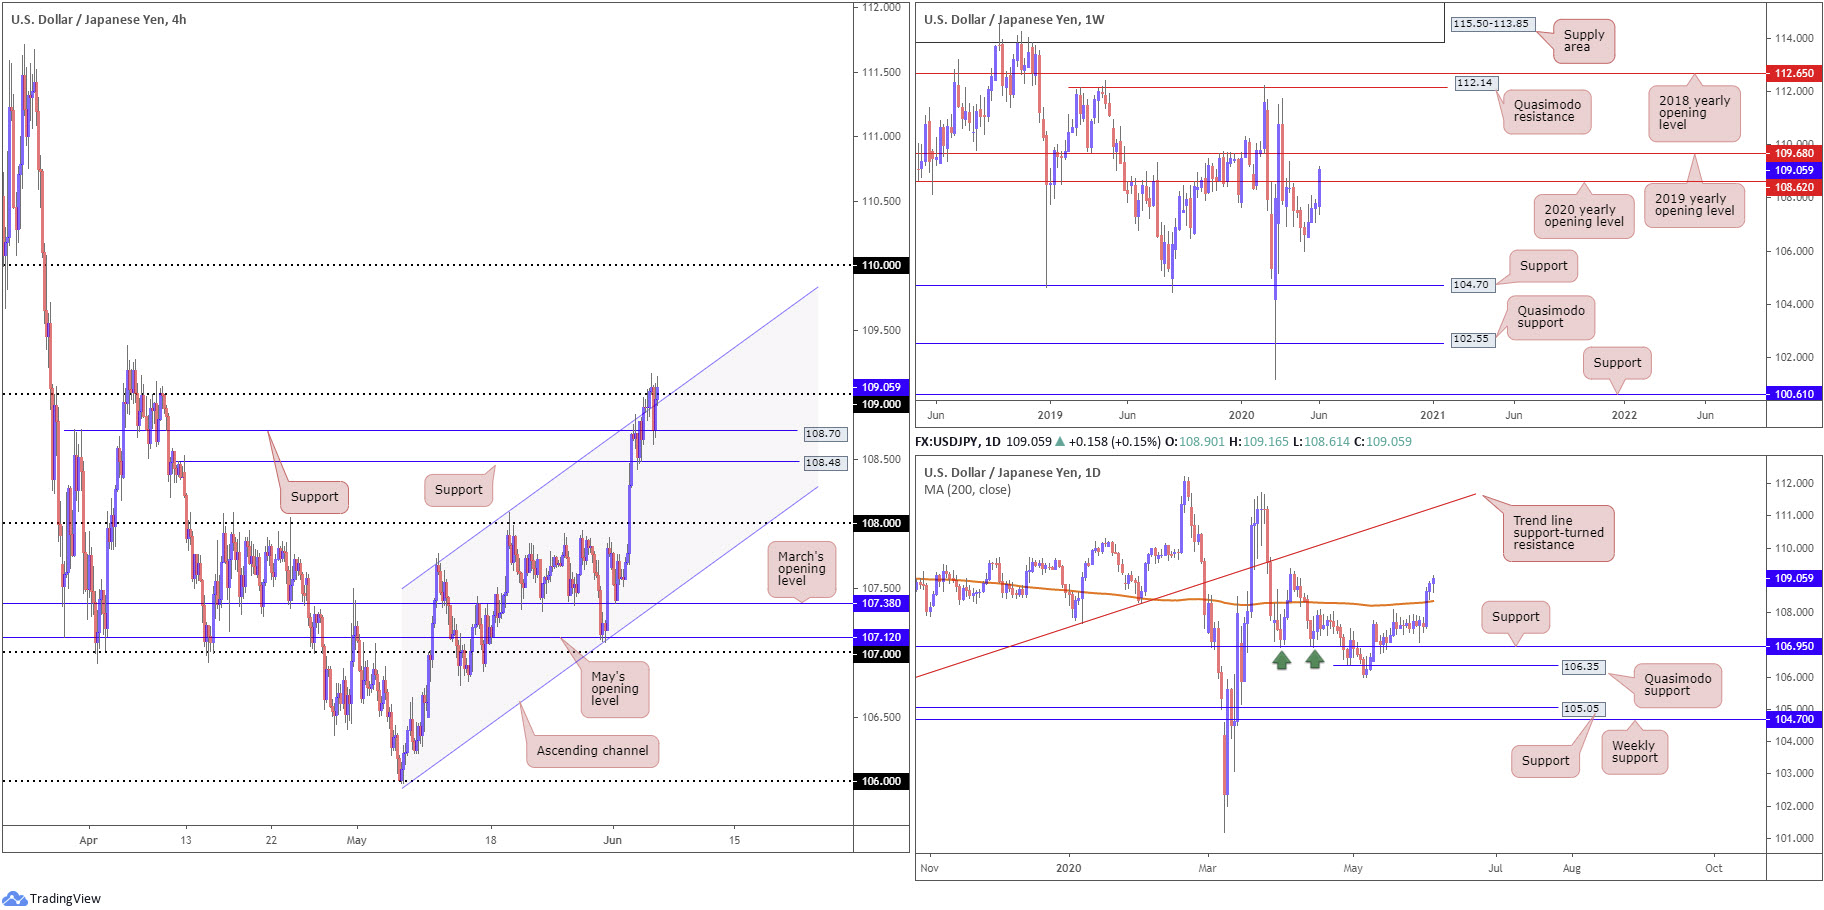
Although post-ECB strength pressured the buck to lower levels Thursday, H4 price action, albeit after a minor blip to support at 108.70 (prior Quasimodo resistance), appears to be establishing position north of 109. Also worth highlighting is the break of channel resistance, extended from the high 108.08, considered a bullish indicator. The 109.38 April 6 high resides as a logical upside hurdle from this point, though rupturing the said base could draw in the key figure 110.
Tuesday had daily price overthrow its 200-day SMA (orange – 108.36) in dominant fashion. This – coupled with Wednesday and Thursday’s extension – underlines 109.38, highlighted on the H4 timeframe.
Higher up on the curve, we can see weekly price recently surpassed the 2020 yearly opening level coming in at 108.62, a level that held price lower in April by way of a shooting star candle pattern. Ousting sellers at 108.62, as you can see, shoves the 2019 yearly opening level at 109.68 into sight.
Areas of consideration:
Thursday’s technical briefing highlighted the following (italics):
109 is unlikely to generate much selling pressure; as you can see, both weekly and daily price exhibit potential to climb further.
Should we unseat 109, bullish strategies may be in store to 109.38 (April 6 high), followed by weekly resistance at 109.68 (2019 yearly opening level). Conservative traders may watch for 109 to serve as support following a breach to higher levels, in order to help sidestep any fakeout scenarios.
Given we’re just making headway above 109, Thursday’s outlook remains fresh as we head into NFP Friday.
USD/CAD:
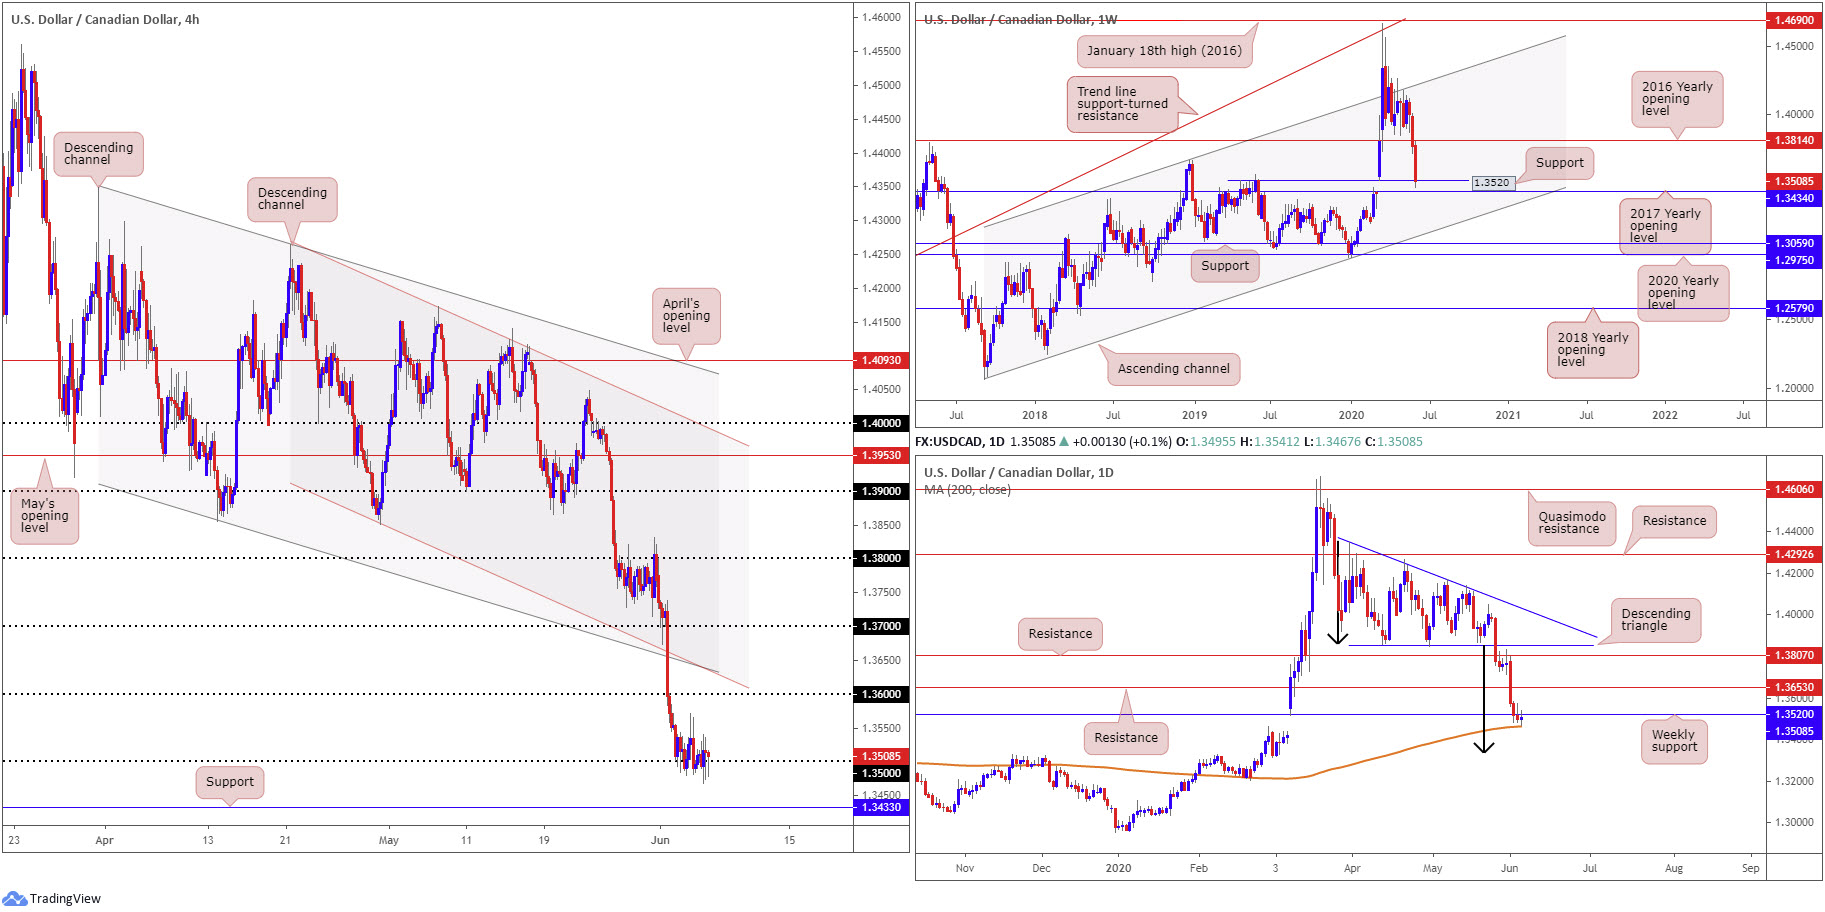
Similar to Wednesday, Thursday echoed a subdued tone as USD/CAD exhibited a non-committal approach around the 1.35 handle, based on the H4 timeframe. As a result, much of the following will resemble Thursday’s technical outlook.
A recovery from 1.35 could eclipse local highs around 1.3540 and 1.3570 to run for 1.36, whereas elbowing under 1.35 could see moves to H4 support priced in at 1.3433.
Weekly support at 1.3520 (prior Quasimodo resistance level) offers a fragile tone at the moment, perhaps unlocking the door to the 2017 yearly opening level at 1.3434.
Elsewhere, daily movement reveals the 200-day SMA (1.3463) may welcome price action today – simple moving averages often serve as dynamic support/resistance. A break, however, could lead the candles to the descending triangle’s take-profit base at 1.3332 (black arrows).
Areas of consideration:
Buyers are unlikely to commit off 1.35 until H4 chalks up a decisive close above weekly support at 1.3520. Following this, the river should be relatively ripple free to 1.36.
H4 support at 1.3433, along with weekly support, in the shape of the 2017 yearly opening level, at 1.3434, also marks a potential reversal zone to consider today.
The 200-day SMA at 1.3460ish may also provide a floor, which could have buyers attempt a recovery back above weekly support noted at 1.3520.
USD/CHF:
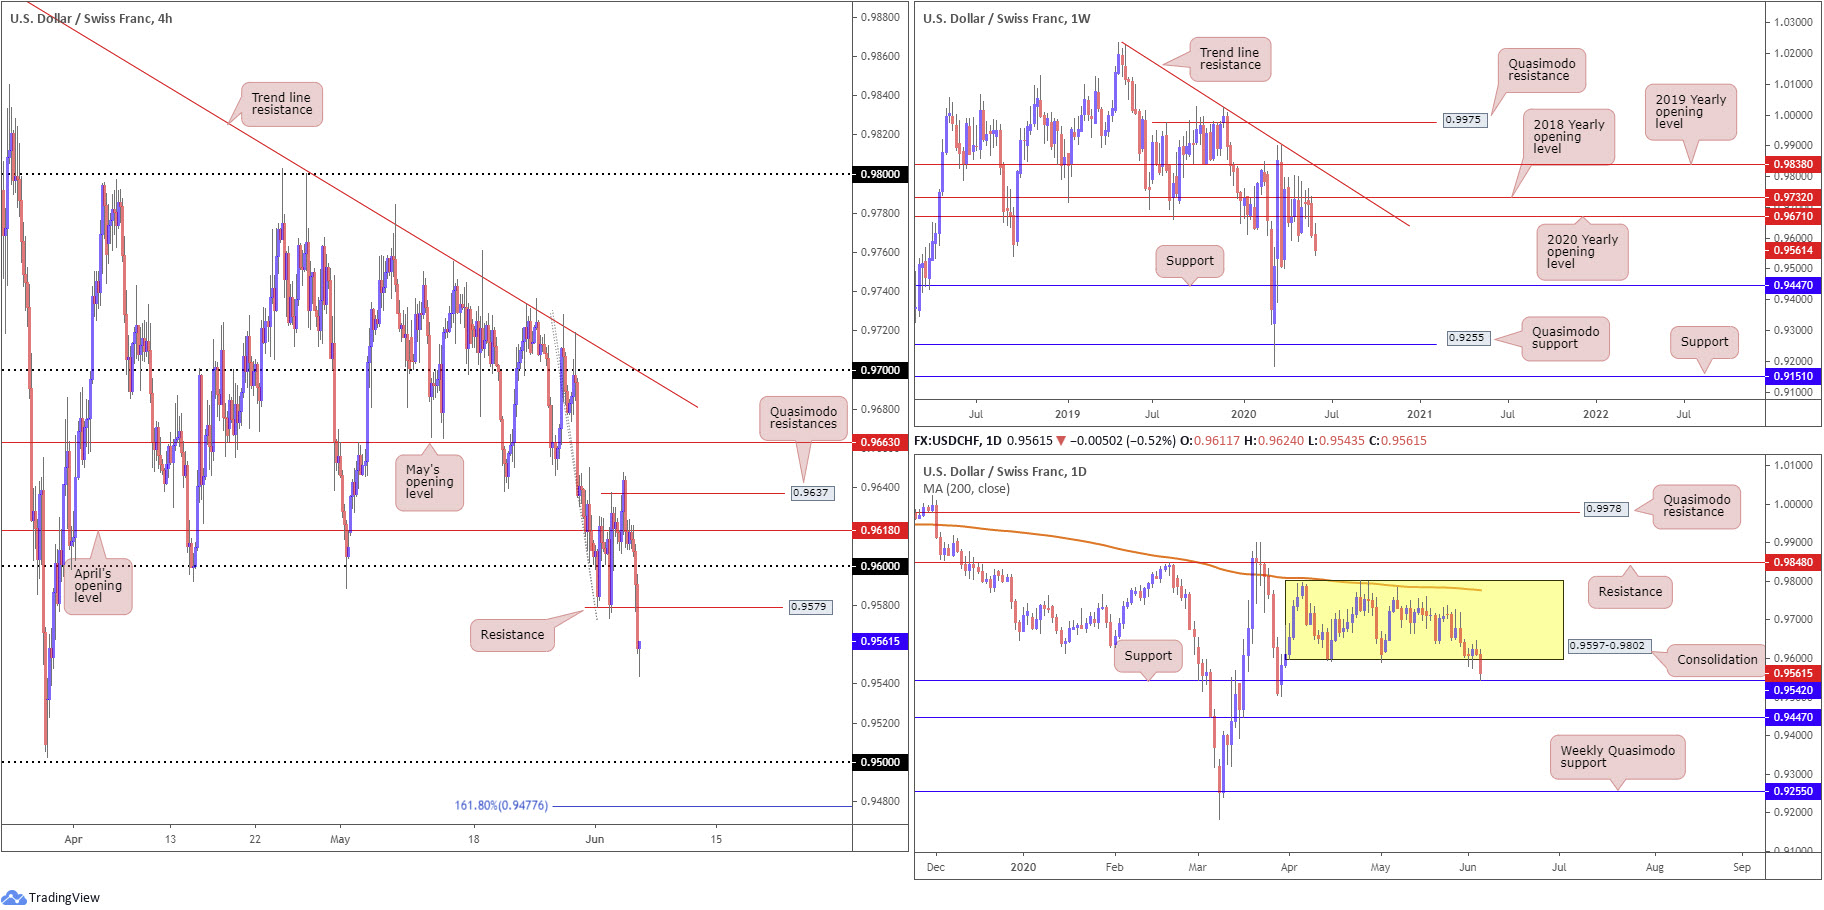
The safe-haven dollar continued tunnelling southbound Thursday, shipping the USD/CHF lower along with it. Over the past 24 hours, traders witnessed April’s opening level on the H4 timeframe at 0.9618 form resistance and the 0.96 handle give way. This leaves 0.9579 in motion as feasible resistance (prior Quasimodo support) today, though maintaining an offered tone at current price could shake hands with the 0.95 handle, located just ahead of a 161.8% Fibonacci extension point at 0.9477.
Since early April, price action on the daily timeframe has consolidated between 0.9802/0.9597, with early week shaking hands with the lower boundary and closing off worst levels. Recent developments observed a vigorous breakout to the lower base of the said range, coming within a hair of connecting with support at 0.9542.
Over the last week, longer-term flow on the weekly timeframe observed an energetic push to the downside, a move which ran through the 2020 yearly opening level at 0.9671, after failing to close above nearby resistance at 0.9732, the 2018 yearly opening level. Remaining on the backfoot has traders’ crosshairs likely fixed on support at 0.9447.
Areas of consideration:
Buyers are showing interest ahead of daily support mentioned above at 0.9542, with H4 on track to close in the shape of a hammer candlestick pattern, enough to possibly retest H4 resistance at 0.9579 and maybe, with a little oomph, the underside of the daily range at 0.9597 (essentially 0.96).
Both 0.9579 and 0.96, therefore, offer potential platforms for sellers to consider today, with daily support at 0.9542 positioned as an initial downside target, followed by 0.95 on the H4.
Dow Jones Industrial Average:
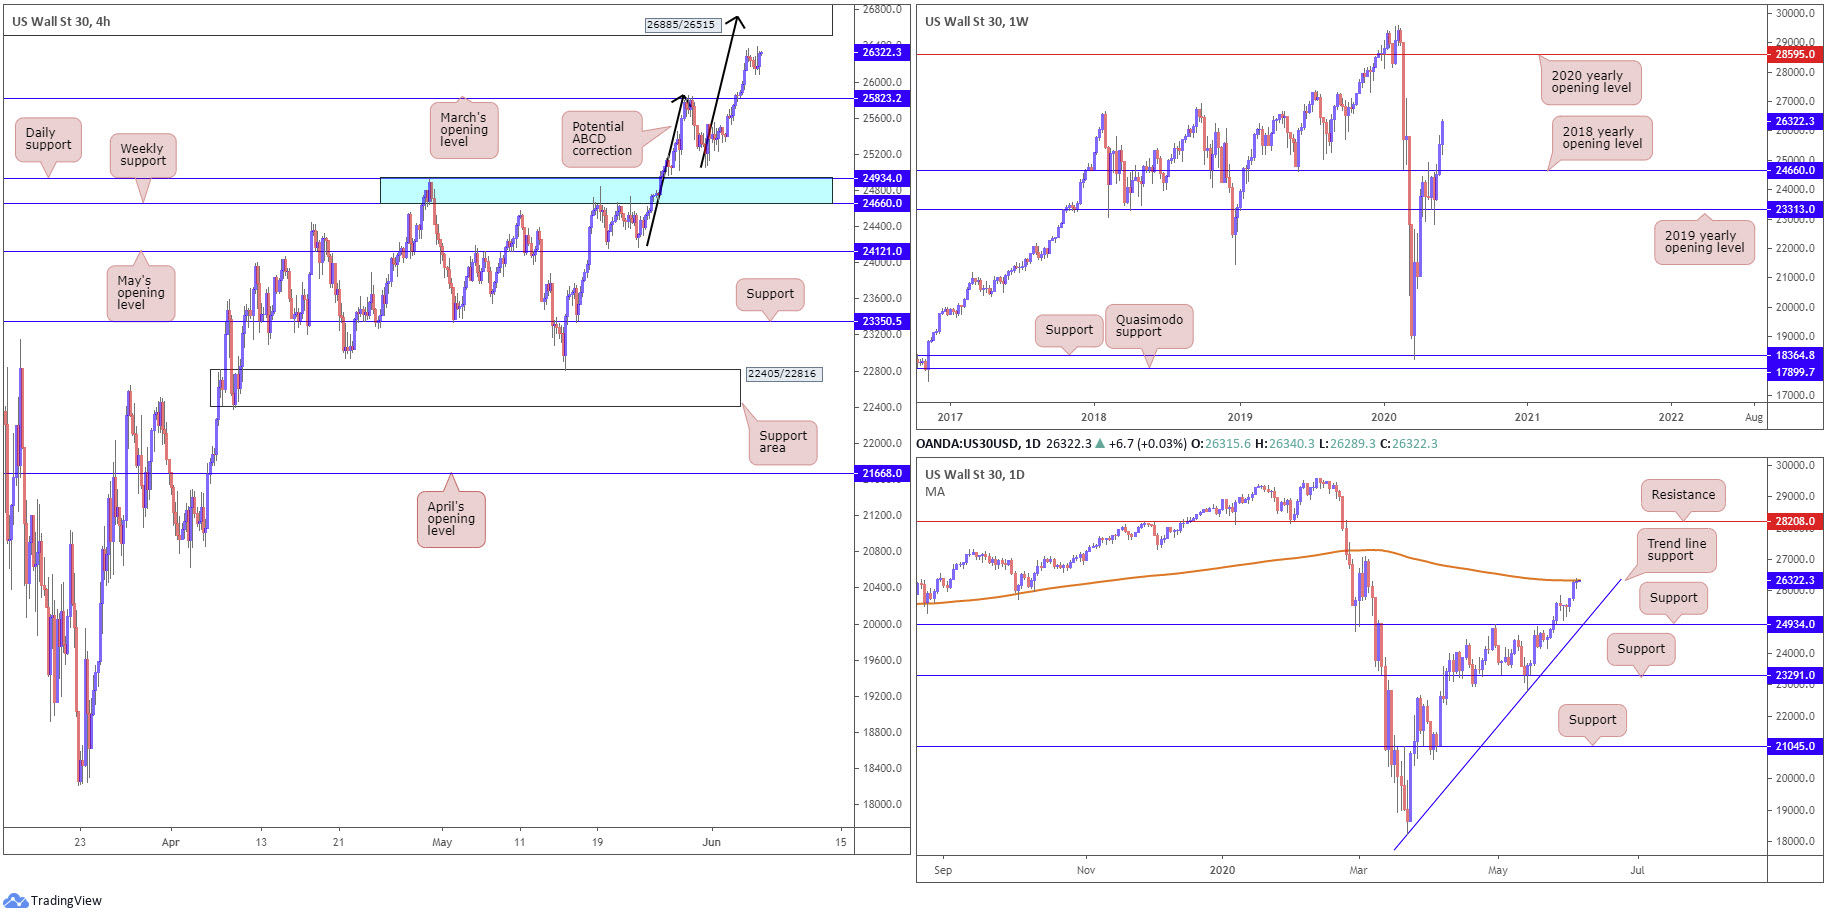
US equities concluded Thursday mixed as major benchmarks are set to record another stellar week of gains. The Dow Jones Industrial Average climbed 11.93 points, or +0.05%; the S&P 500 declined 10.52 points, or -0.34%, and the tech-heavy Nasdaq 100 concluded lower by 75.02 points, or 0.77%.
Overall, limited change is evident on the charts this morning, therefore much of Thursday’s technical briefing remains valid heading into NFP Friday.
Sellers were unwelcome at March’s opening level at 25823 on the H4 timeframe in recent trading, as buyers made quick work of the level. This, from a technical standpoint, lists a H4 resistance area at 26885/26515 in the firing range today, merging with a potential ABCD correction (black arrows) at 26743.
According to the daily timeframe, upside may be hampered as we recently joined the 200-day SMA (orange – 26338), with a break north of here exposing the 27092 March 4 high. From the weekly timeframe, the resurgence of bidding positions buyers in a fortunate position north of the 2018 yearly opening level at 24660. Sustained upside could eventually have the 2020 yearly opening level at 28595 emerge.
Areas of consideration:
As things stand, the odds of a reaction being seen out of H4 resistance at 26885/26515 is high. Not only does the area come with a H4 ABCD correction at 26743, daily sellers between the 27092 March 4 high and 200-day SMA at 26338 may aid selling.
Breaking the current H4 resistance zone, nonetheless, signals a bullish tone, possibly reaching as far north as the 2020 yearly opening level at 28595.
XAU/USD (GOLD):
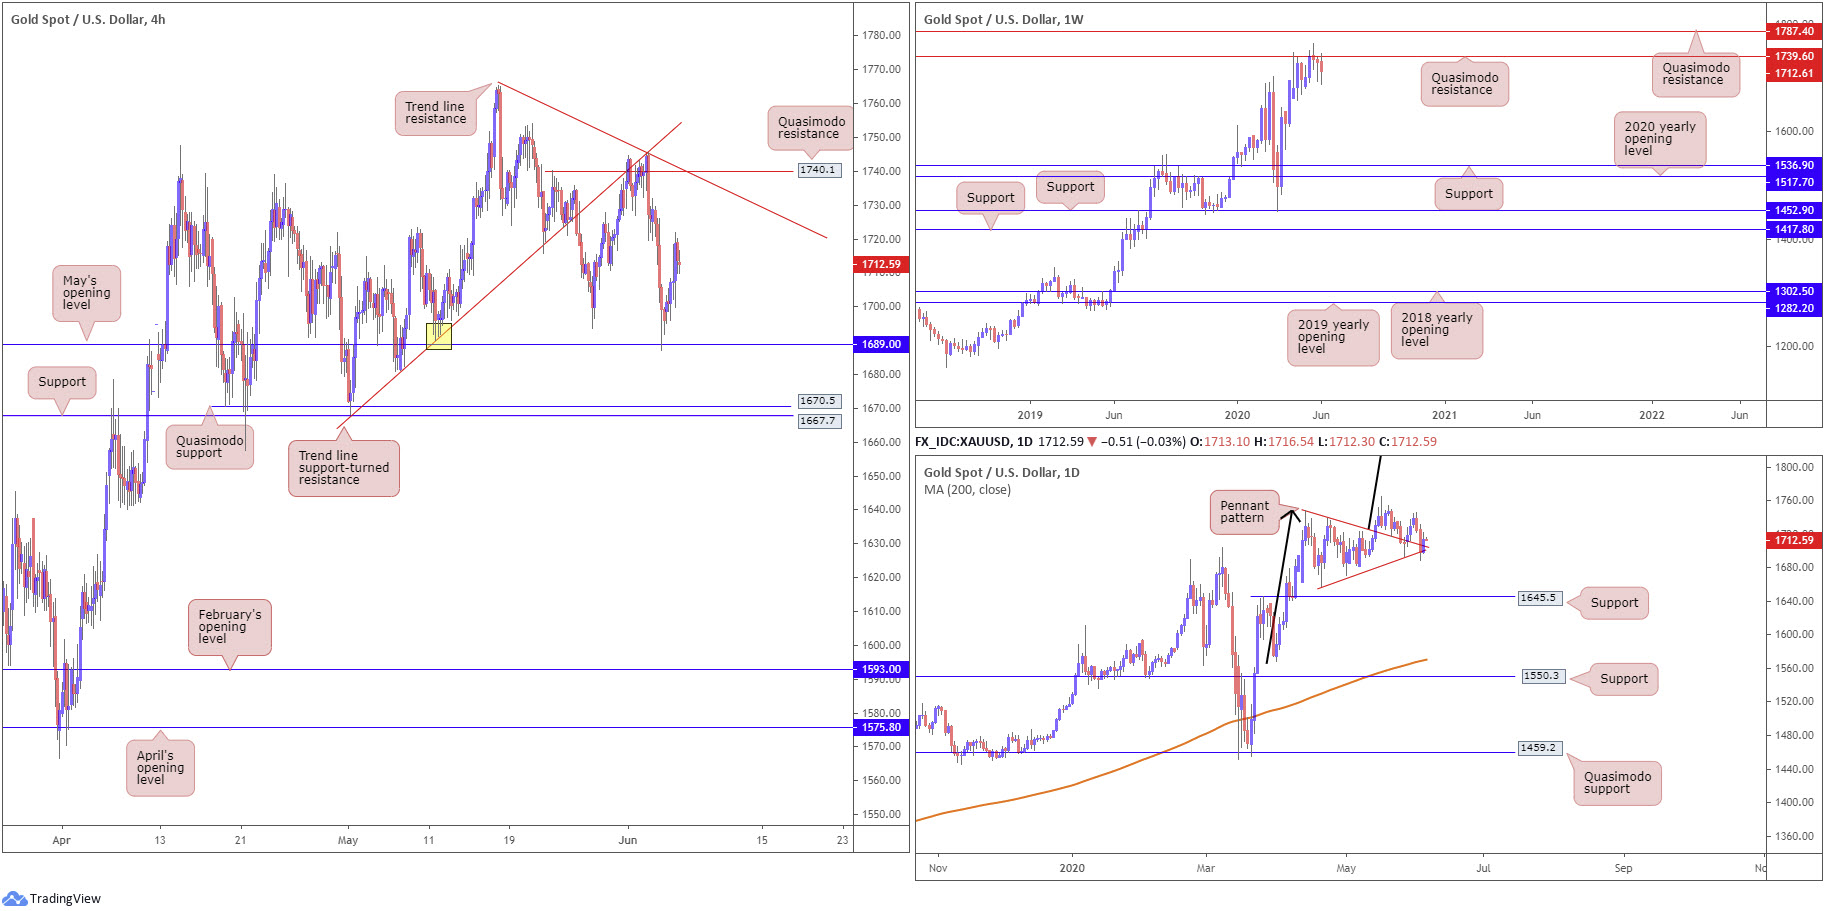
Buyers came to their senses Thursday, extending Wednesday’s modest end-of-day recovery off May’s opening level at 1689.0. Snapping a 2-day bearish phase, XAU/USD bulls are now poised to shake hands with H4 trend line resistance, extended from the high 1765.1.
Despite the intraday pickup on Thursday, weekly price is on track to finish the week shaped by way of a bearish outside pattern, as buyers still appear to be lacking enthusiasm under Quasimodo resistance at 1739.6. Price, as you can see, has remained capped under the aforementioned Quasimodo resistance from mid-April. Clearance of 1739.6 underlines another layer of Quasimodo resistance at 1787.4. It may also interest some traders to note the trend on gold has faced a northerly trajectory since 2016.
The recent attempt at recovery has ignited a bout of hope among pattern traders on the daily timeframe, as buyers make a stand after retesting the upper boundary of a bullish pennant pattern, established from a high of 1747.7 and a low coming in from 1658.1. Moves lower from here are still a possibility, of course, threatening a fall to support formed at 1645.5.
Areas of consideration:
Having noted the current trend faces north, buyers still have a hand in this fight out of the daily bullish pennant pattern.
Weekly Quasimodo resistance at 1739.6, however, is proving a dominant force. Only once, or indeed if, this level is overthrown will buyers likely have confidence to attempt to join the current uptrend. Nevertheless, there will be some traders already long based on yesterday’s recovery from the daily bullish pennant’s structure, with protective stop-loss orders tucked under Wednesday’s low at 1687.1.
The accuracy, completeness and timeliness of the information contained on this site cannot be guaranteed. IC Markets does not warranty, guarantee or make any representations, or assume any liability regarding financial results based on the use of the information in the site.
News, views, opinions, recommendations and other information obtained from sources outside of www.icmarkets.com.au, used in this site are believed to be reliable, but we cannot guarantee their accuracy or completeness. All such information is subject to change at any time without notice. IC Markets assumes no responsibility for the content of any linked site.
The fact that such links may exist does not indicate approval or endorsement of any material contained on any linked site. IC Markets is not liable for any harm caused by the transmission, through accessing the services or information on this site, of a computer virus, or other computer code or programming device that might be used to access, delete, damage, disable, disrupt or otherwise impede in any manner, the operation of the site or of any user’s software, hardware, data or property.


