A note on lower timeframe confirming price action…
Waiting for lower timeframe confirmation is our main tool to confirm strength within higher timeframe zones, and has really been the key to our trading success. It takes a little time to understand the subtle nuances, however, as each trade is never the same, but once you master the rhythm so to speak, you will be saved from countless unnecessary losing trades. The following is a list of what we look for:
- A break/retest of supply or demand dependent on which way you’re trading.
- A trendline break/retest.
- Buying/selling tails – essentially we look for a cluster of very obvious spikes off of lower timeframe support and resistance levels within the higher timeframe zone.
- Candlestick patterns. We tend to only stick with pin bars and engulfing bars as these have proven to be the most effective.
For us, lower timeframe confirmation starts on the M15 and finishes up on the H1, since most of our higher timeframe areas begin with the H4.
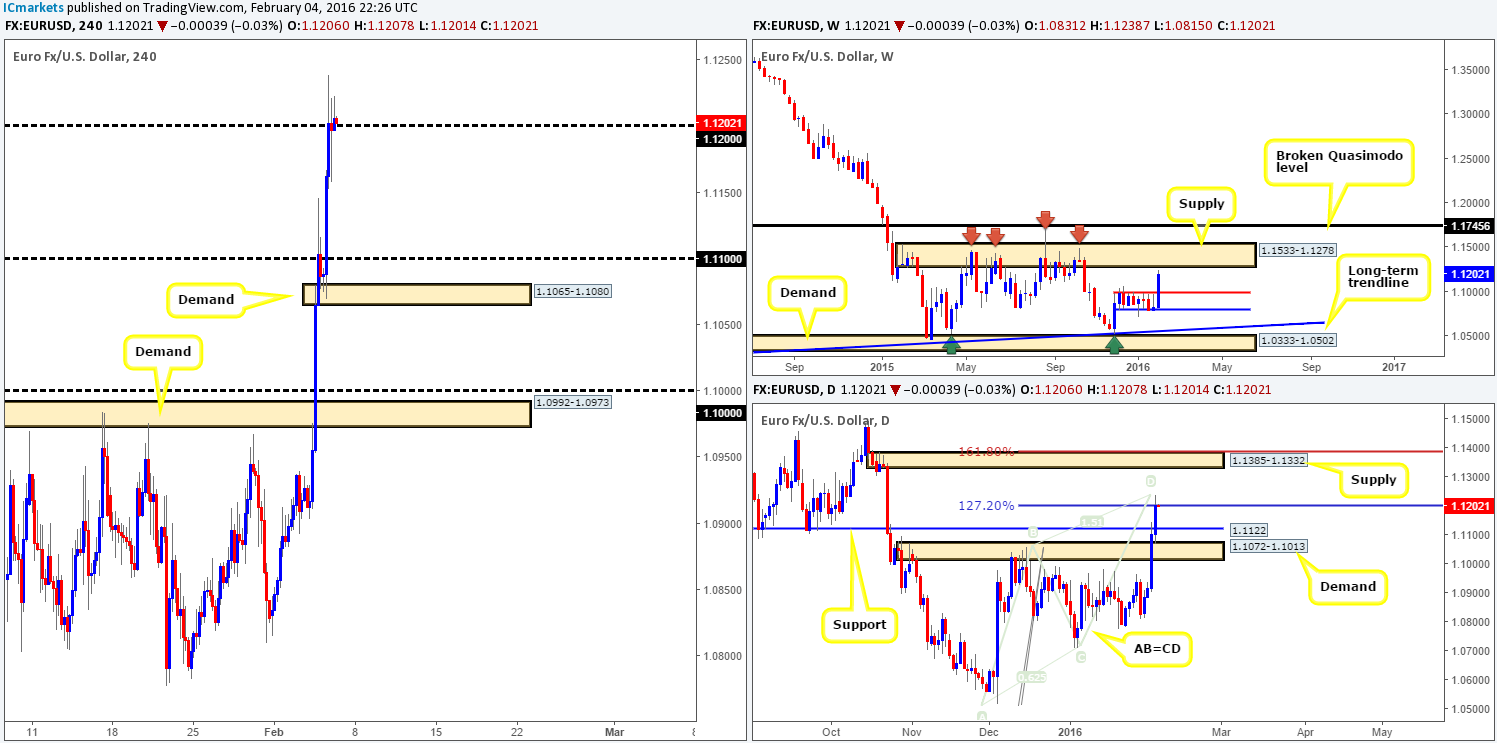
EUR/USD:
The bullish pulse continues to beat in the EUR/USD market as price stamped in yet another 100+ pip gain yesterday. Early on in European trade, market action bounced nicely from a small H4 demand at 1.1065-1.1080 (an area we warned may be troublesome for shorts) and advanced up to psychological resistance 1.1200 where price is currently stalling.
The way we are seeing things right now is the weekly is presently trading within shouting distance of supply drawn from 1.1533-1.1278. Meanwhile, down on the daily timeframe, a very clear Harmonic AB=CD bear pattern is forming. Our sell zone here is fixed between the 127.2% Fibonacci level at 1.1197 and the 161.8% at 1.1387. Clearly this is a huge sell zone, and not one that we’d be comfortable trading due to the large stop-loss required.
On that account, today’s spotlight will firmly be focused on the daily supply zone painted above at 1.1385-1.1332 (the upper area of our Harmonic sell zone which also sits within the above said weekly supply) for sells. On the H4 there is also a corresponding resistance level coming in at 1.1349 within this daily supply, but for the best part our focus will be on the daily chart today. That being the case, we are placing a pending sell order at 1.1330 and a stop just above our daily zone at 1.1395. As of now, the first take-profit level can be seen on the daily timeframe at 1.1122 – a recently broken resistance-turned support.
Levels to watch/live orders:
- Buys: Flat (Stop loss: N/A).
- Sells: 1.1330 [Pending order] (Stop loss: 1.1395).
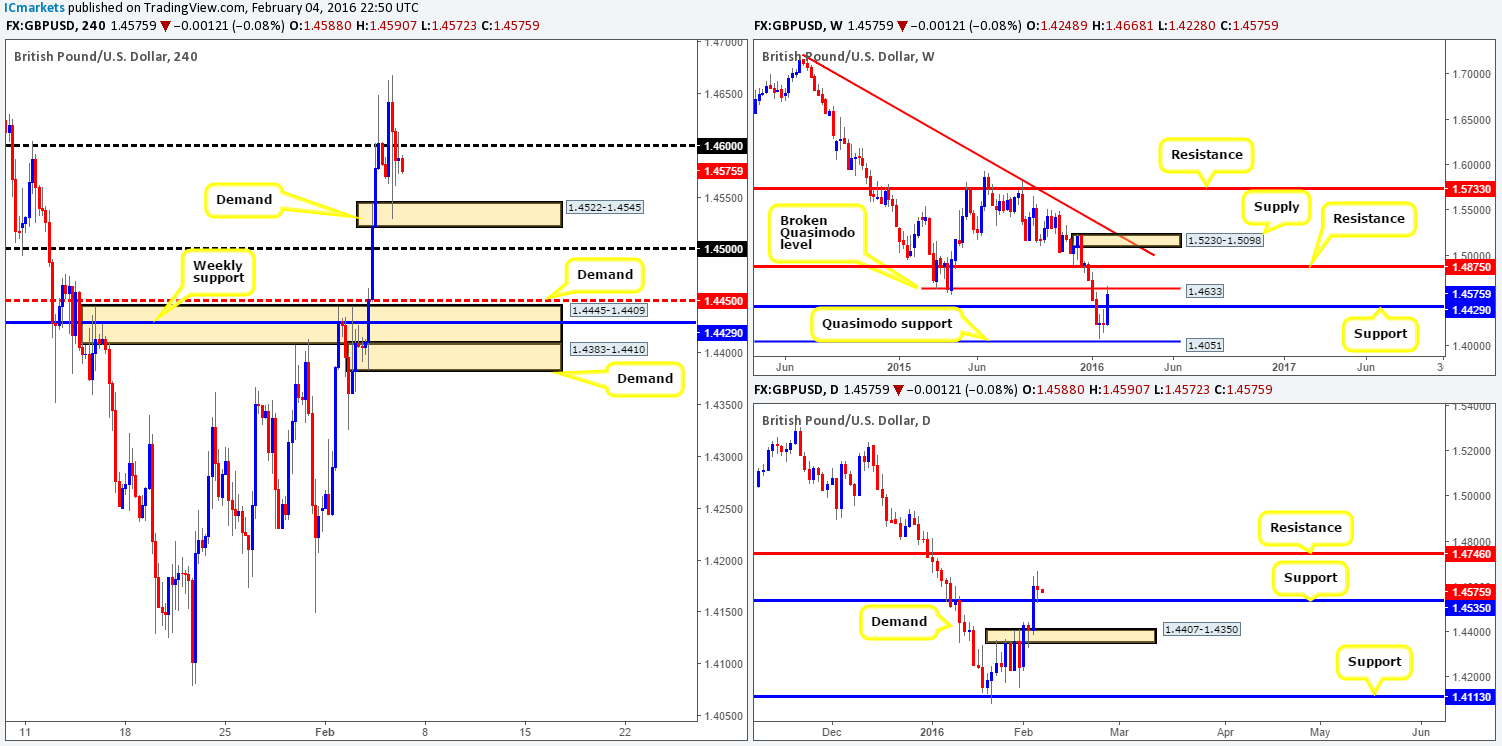
GBP/USD:
Following a brief pullback from the 1.4600 figure yesterday, Cable made a quick run to new highs of 1.4668 before collapsing back below 1.4600 and into the jaws of a small H4 demand seen at 1.4522-1.4545.
Pushing forward, this is rather a tricky pair to read at the moment… Take a look at the weekly chart, the market is currently being held lower by a broken Quasimodo level at 1.4633. Conversely however, daily action recently printed a clear-cut indecision candle on top of support drawn from 1.4795. So, with that in mind, does one look for buys today and risk being taken out by weekly sellers, or does one look to sell the market and risk taking a loss from buyers at daily support?
Well, considering that the mighty NFP release is set to take center stage later on, we would not even like to hazard a guess! However, an area to keep on your watch list today should price drive lower is the weekly support at 1.4429, which sits just above daily demand at 1.4407-1.4350, and also within a H4 demand at 1.4445-1.4409. This could make for a nice place to bounce prices from during/post NFP.
Due to us already looking to short the EUR, nevertheless, we are humbly going to pass on this pair today.
Levels to watch/live orders:
- Buys: Flat (Stop loss: N/A).
- Sells: Flat (Stop loss: N/A).
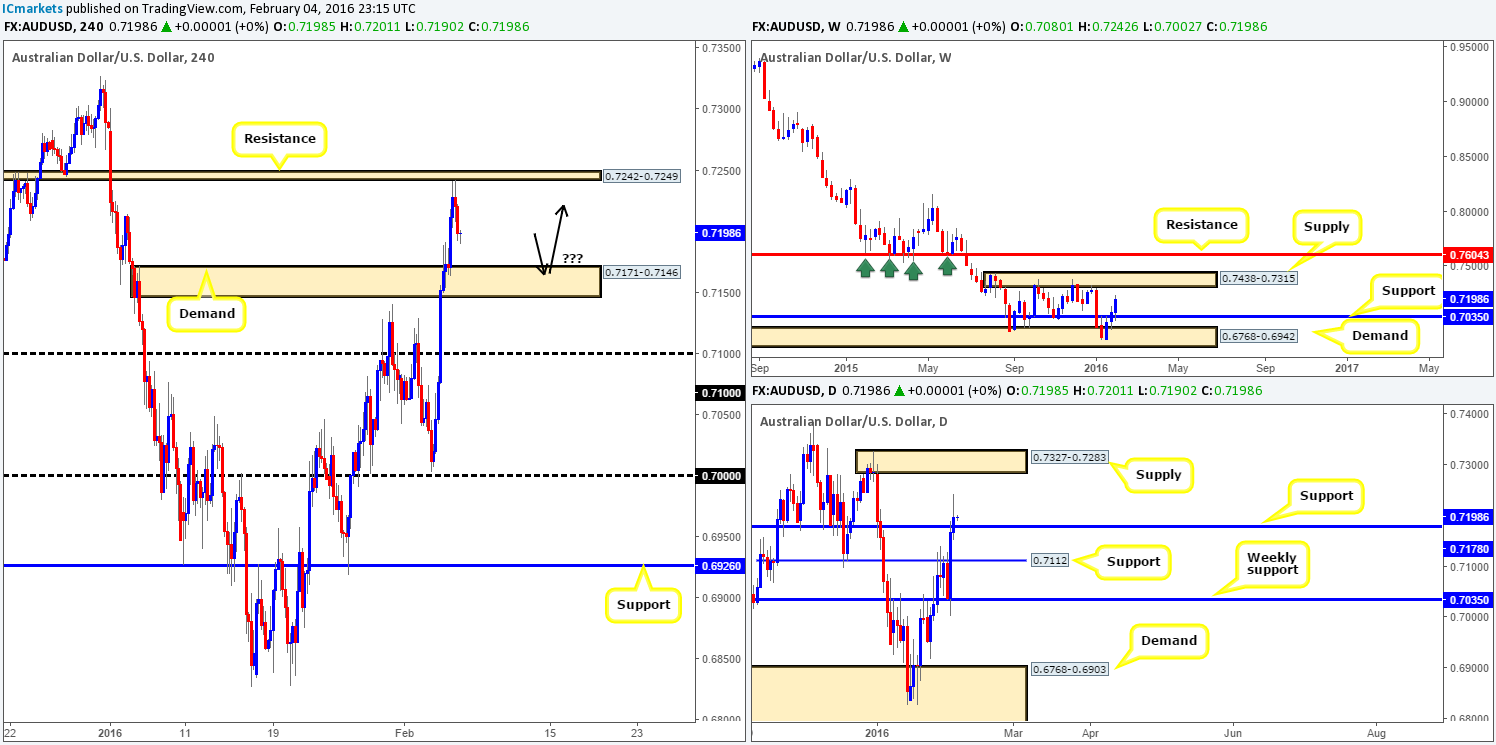
AUD/USD:
Beginning with the weekly chart this morning, we can see that the commodity currency is holding steady above support drawn from 0.7035. This, as a result, forced the Aussie to recently close above daily resistance (now acting support) at 0.7178. On the assumption that the buyers can remain dominant above this number today, the path north appears clear up to supply coming in at 0.7327-0.7283 (glued to the underside of a weekly supply seen at 0.7438-0.7315).
Stepping down into the pits of the H4, nevertheless, it is clear to see that price sold off from resistance at 0.7242-0.7249 going into the American session yesterday. Considering the higher-timeframe picture (see above), momentum is, at least in our estimation, to the upside for now. Therefore, for this expectation to hold, H4 demand at 0.7171-0.7146 should stand firm, and at the same time potentially provide a nice floor in which to buy from. Be that as it may, the NFP release is just around the corner and technicals are usually put to one side during this time, so we would only consider trading this barrier long if and only if lower timeframe confirmation was seen pre/post NFP. Should this trade come to fruition, first take-profit target (for us) would be the above said H4 resistance area, followed by the underside of daily supply mentioned above at 0.7283.
Levels to watch/live orders:
- Buys: 0.7171-0.7146 [Tentative – confirmation required] (Stop loss: dependent on where one confirms this area).
- Sells: Flat (Stop loss: N/A).
USD/JPY:
It was another rainy day for the USD/JPY yesterday! Following a retest to the underside of the 118.00 figure, a steep lemming-like stamped was seen down to the mid-level support region 116.50. The recent sell-off took out daily demand (now acting supply) at 117.65-118.62 with relative ease and shortly after plugged into bids seen around weekly support coming in at 116.71.
Clearly the overall momentum on this pair is south at present, and has been since the beginning of the week. However, the aforementioned weekly support has capped downside in this market since August 2014, so we’re expecting to see a battle between the buyers and sellers here!
Personally, Entering long right now is not something we’d be comfortable taking part in. A close above psychological resistance 117.00 would need to be seen, which effectively should clear the upside to at least the underside of the recently broken daily demand at 117.65, followed by psychological resistance 118.00 and maybe the H4 supply seen at 118.48-118.77. However, even with a close above 117.00 today guys do not forget that the NFP is set to take the limelight later on, so be careful during this time!
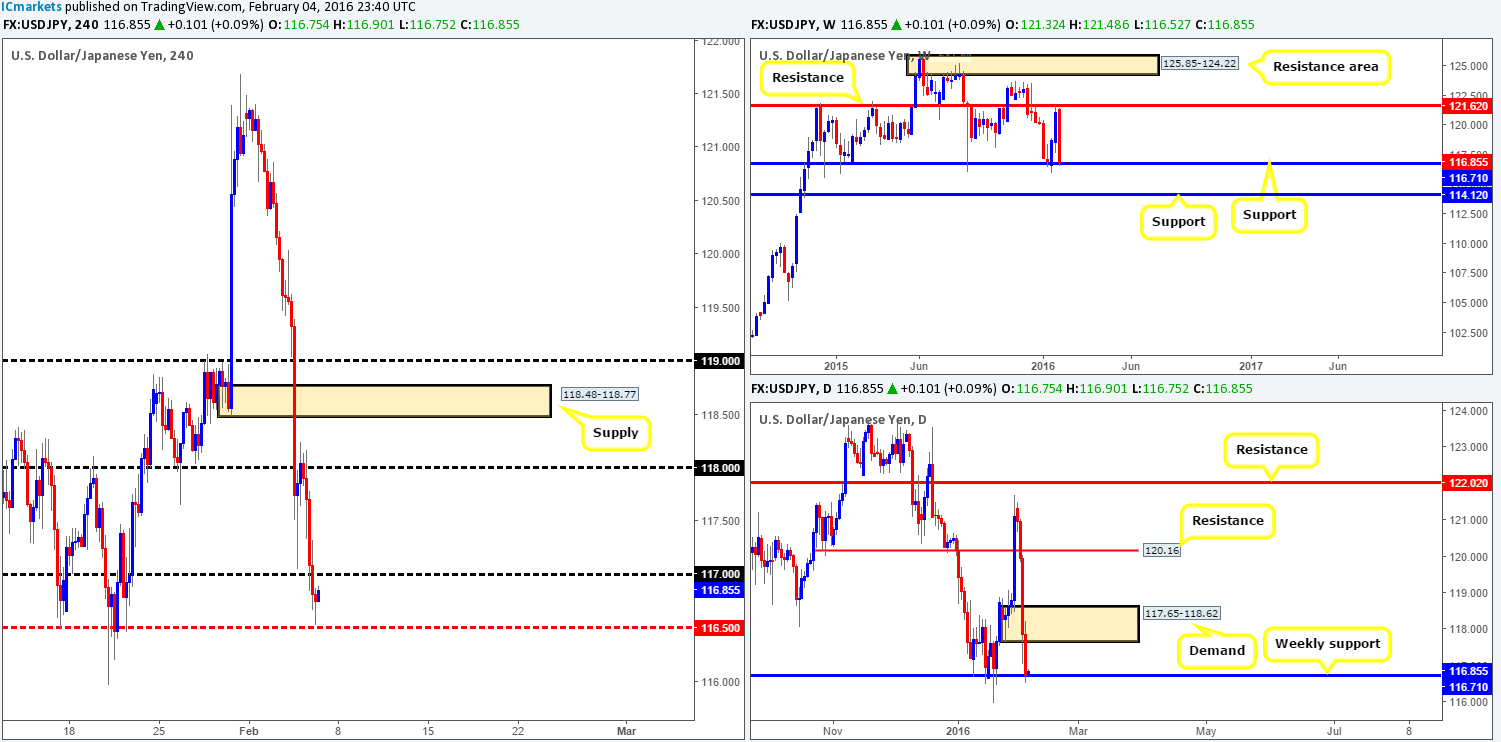
Levels to watch/live orders:
- Buys: Watch for offers to be consumed around 117.00 and look to trade any retest seen thereafter (lower timeframe confirmation required).
- Sells: Flat (Stop loss: N/A).
USD/CAD:
Starting from the top this morning, weekly support at 1.3814 appears to be struggling to hold at the moment. In the event that longs are squeezed further here, the next downside target to keep your eye on is support penciled in at 1.3381. On the other side of the ledger, however, daily flow recently printed a nice-looking buying tail that whipsawed through demand seen at 1.3673-1.3754. Could this be a sign that the USD/CAD bulls want to make an appearance today?
Turning our attention to the H4 chart, a truckload of stops were likely taken out mid-way through London trade yesterday as price faked below psychological support 1.3700, ending the day nudging into supply at 1.3783-1.3747. Although the higher-timeframe picture is chalking up reasonable hope that the bulls may step in today (see above), buying into H4 supply that’s accompanied by a 1.3800 figure, and a resistance lurking just above that at 1.3815 is not something we’d stamp high probability.
In the absence of clearer price action, we have decided to remain flat during today’s trade.
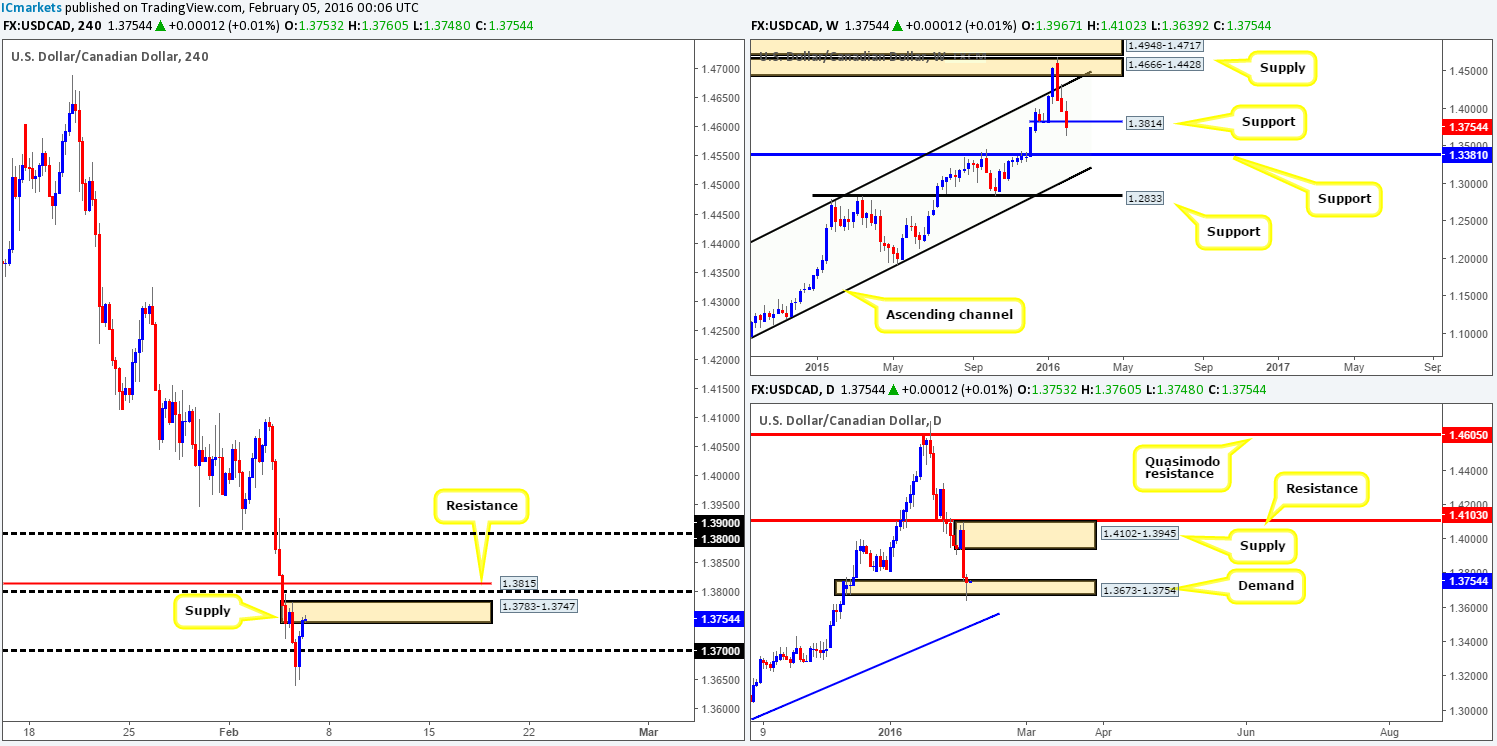
Levels to watch/live orders:
- Buys: Flat (Stop loss: N/A).
- Sells: Flat (Stop loss: N/A).
USD/CHF:
Shortly after a brief rebound from 1.0000 (parity), the USD/CHF continued to sink yesterday. 1.0000 was taken out with little to no fight being seen from the bulls, and price ended the day tagging in bids at a H4 support level drawn from 0.9927.
In addition to the above, this recent selling also squeezed out longs from daily demand (now acting supply) at 0.9958-1.0036, and went on to collide with another daily demand just below it taken from 0.9851-0.9926. Furthermore, we can also see that weekly trade is now hovering a few pips above a clear area of support at 0.9796-0.9902. To that end, selling momentum, at least from a technical standpoint, is likely to ease today.
Given the points made above, our plan of attack will consist of looking for lower timeframe entries between the current H4 support and the psychological support 0.9900 (remember 0.9900 also represents the top-side of the weekly support area). The reason for requiring lower timeframe confirmation here simply comes from the possibility that price could potentially continue much lower into the above said higher-timeframe areas of demand (see above). What is more, we would not recommend trading this buy zone during the NFP release today as things will likely get choppy.

Levels to watch/live orders:
- Buys: 0.9900-0.9927 [Tentative – confirmation required] (Stop loss: dependent on where one confirms this area).
- Sells: Flat (Stop loss: N/A).
DOW 30:
All in all, it was a quiet day for U.S. stocks yesterday – session highs were recorded at 16437 and lows came in at 16206. In light of this, much of the following report will remain similar to Thursday’s outlook…
From the weekly chart, support at 15978 continues to remain well-bid despite the vicious-looking spikes seen below it. Providing that the buyers remain dominant, the next upside target to have on your watch list is seen around resistance coming in at 16935.
Daily action shows that prices did in fact edge higher during yesterday’s session, but only by around forty points or so, consequently forming an indecision candle. The next upside target as per this timeframe falls in at 16708 – a clear barrier of resistance.
Moving down one more level to the H4, it is clear that the upside to this index remains capped by H4 supply drawn from 16596-16509, and as we write, price is not too far from connecting with this said zone.
On account of the above, here is what we have logged so far:
- Although higher timeframe direction is currently pointing north (see above), entering long right now is difficult due to the distance between current prices and the above said H4 supply – risk/reward would not likely be in your favor.
- This leaves us with shorts. The only place we see a sell is possible right now is between the current H4 supply and daily resistance (green area on H4 chart). Be that as it may, let’s not forget that the weekly chart shows room for this index to move much higher than this barrier of resistance so we may only see a bounce at best from this zone (waiting for lower timeframe confirmation before you sell is highly recommended).
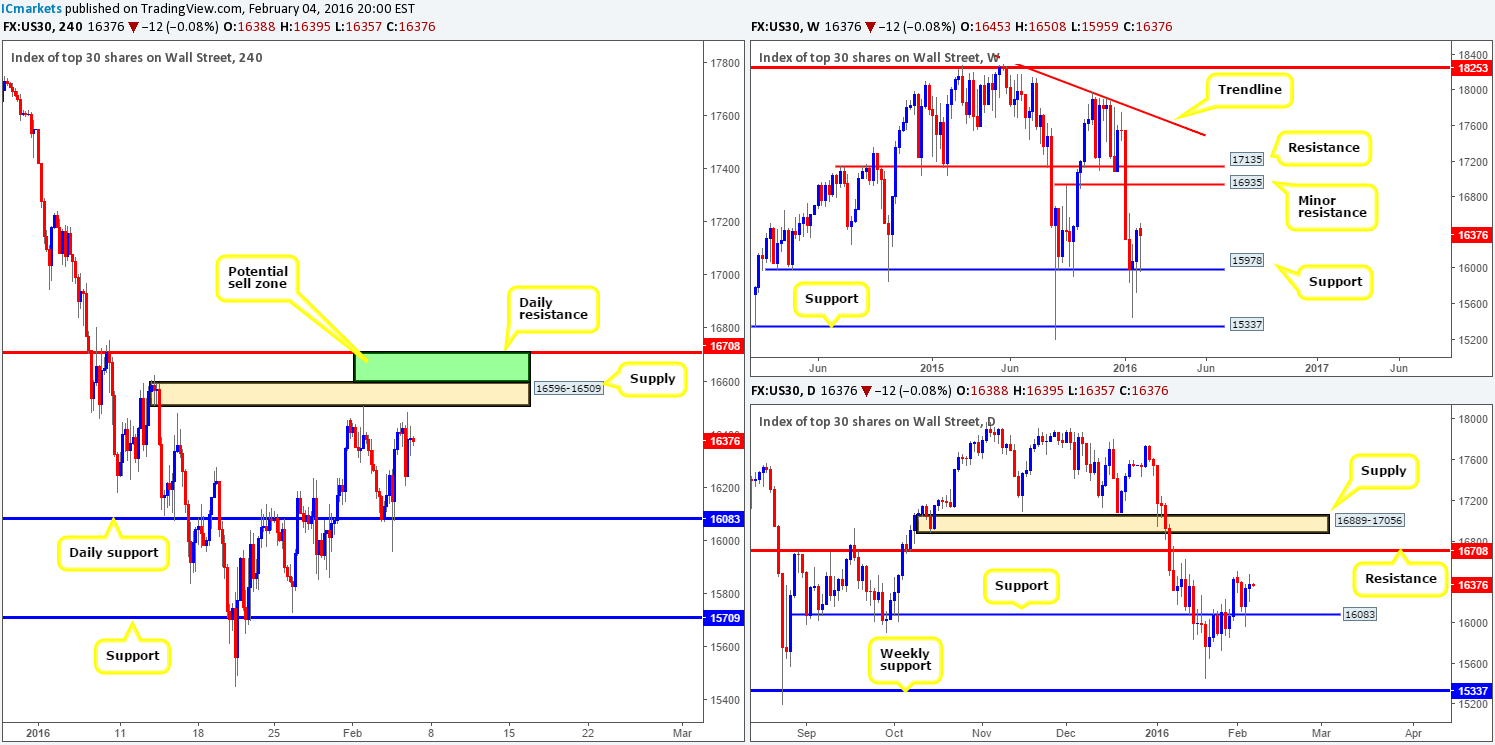
Levels to watch/live orders:
- Buys: Flat (Stop loss: N/A).
- Sells: 16708/16596 [Tentative – confirmation required] (Stop loss: dependent on where one confirms this area).
XAU/USD: (Gold)
Yesterday’s 1300-pip rally marks the fifth consecutive bullish day for the yellow metal. The big question for us now is how long can the buyers sustain this momentum? Well, from a technical point of view the buyers are likely going to have opposition today. The most recent advance saw price crash into not only a clear daily Quasimodo resistance level at 1156.6, but also a weekly resistance barrier drawn from 1157.4 which can be seen stretching as far back as late 2014.
In light of recent movement, our team is in favor of a sell-off today. However, we are not confident enough to go in at market here due to the possibility that price may jab higher to connect with offers around the daily Quasimodo resistance level seen at 1169.8. In consequence the path we have chosen to take is as follows:
- Keep a close eye on lower timeframe price action around the current daily Quasimodo resistance level. Should an entry pop up, the first take-profit target can be seen at the recently broken H4 resistance at 1147.8.
- If Gold continues to grind higher today, all eyes will then be on the daily Quasimodo just above at 1169.8. Targets in this case would be dependent on the H4 approach.
In closing, please do remember that it’s NFP day today which can cause sudden shifts in price. Therefore, trade with caution and try to stay out of the market during this time.
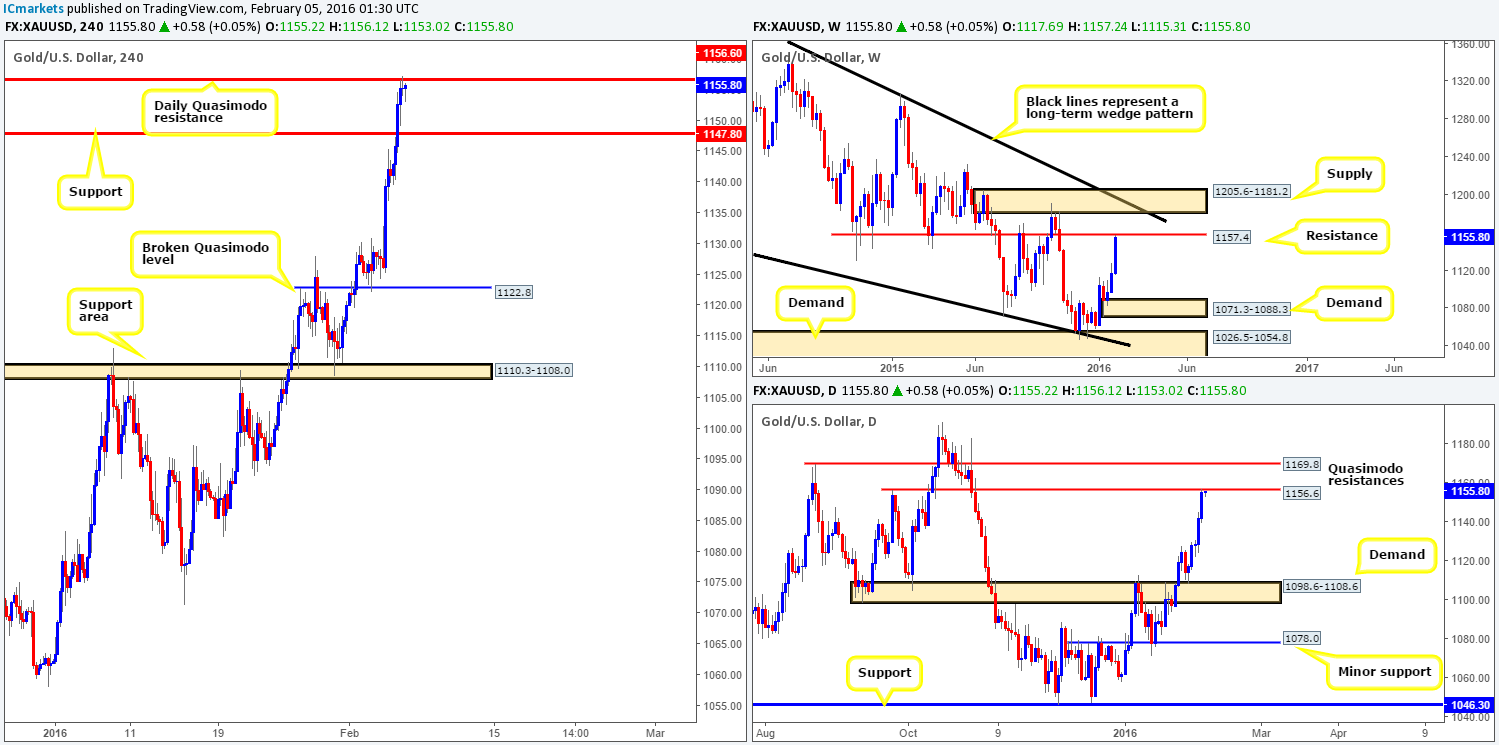
Levels to watch/live orders:
- Buys: Flat (Stop loss: N/A).
- Sells: 1156.6 [Tentative – confirmation required] (Stop loss: dependent on where one confirms this level). 1169.8 [Tentative – confirmation required] (Stop loss: dependent on where one confirms this level).


