
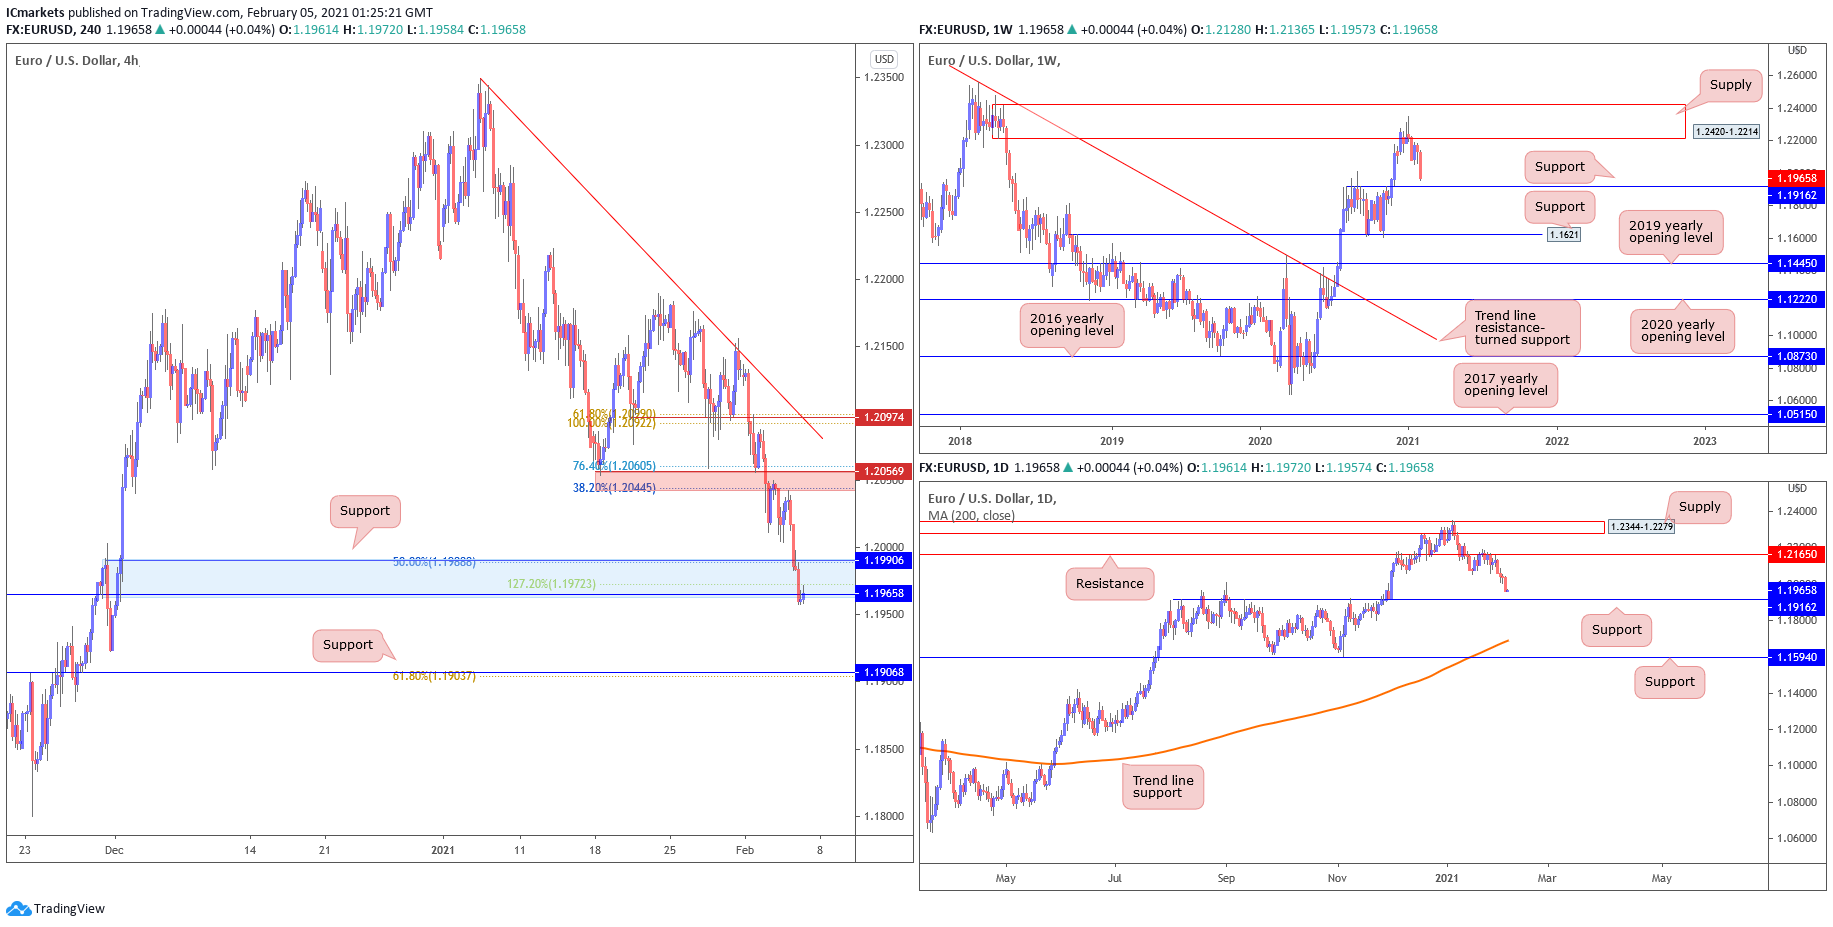
EUR/USD:
Looking at the weekly chart, we can see that prices are still in an uptrend and are approaching our key support level at 1.19162 which can be found on the weekly and daily time frame. This level also coincides with our 61.8% fibonacci retracement and graphical support area.
On the H4 timeframe, prices are testing our short term support area at 1.19906 – 1.19658 which coincides with our 127.2% fibonacci extension and 50% fibonacci retracement as well as the graphical support area. This would be an interesting level for buyers though we do caution the limited upside as prices on the weekly and daily time frames indicate that a bigger pullback could happen before prices reach the daily key support level at 1.19162.
Areas of consideration:
- 19906 – 1.19658 support area found on H4 time frame
- 19162 support area found on daily and weekly time frame
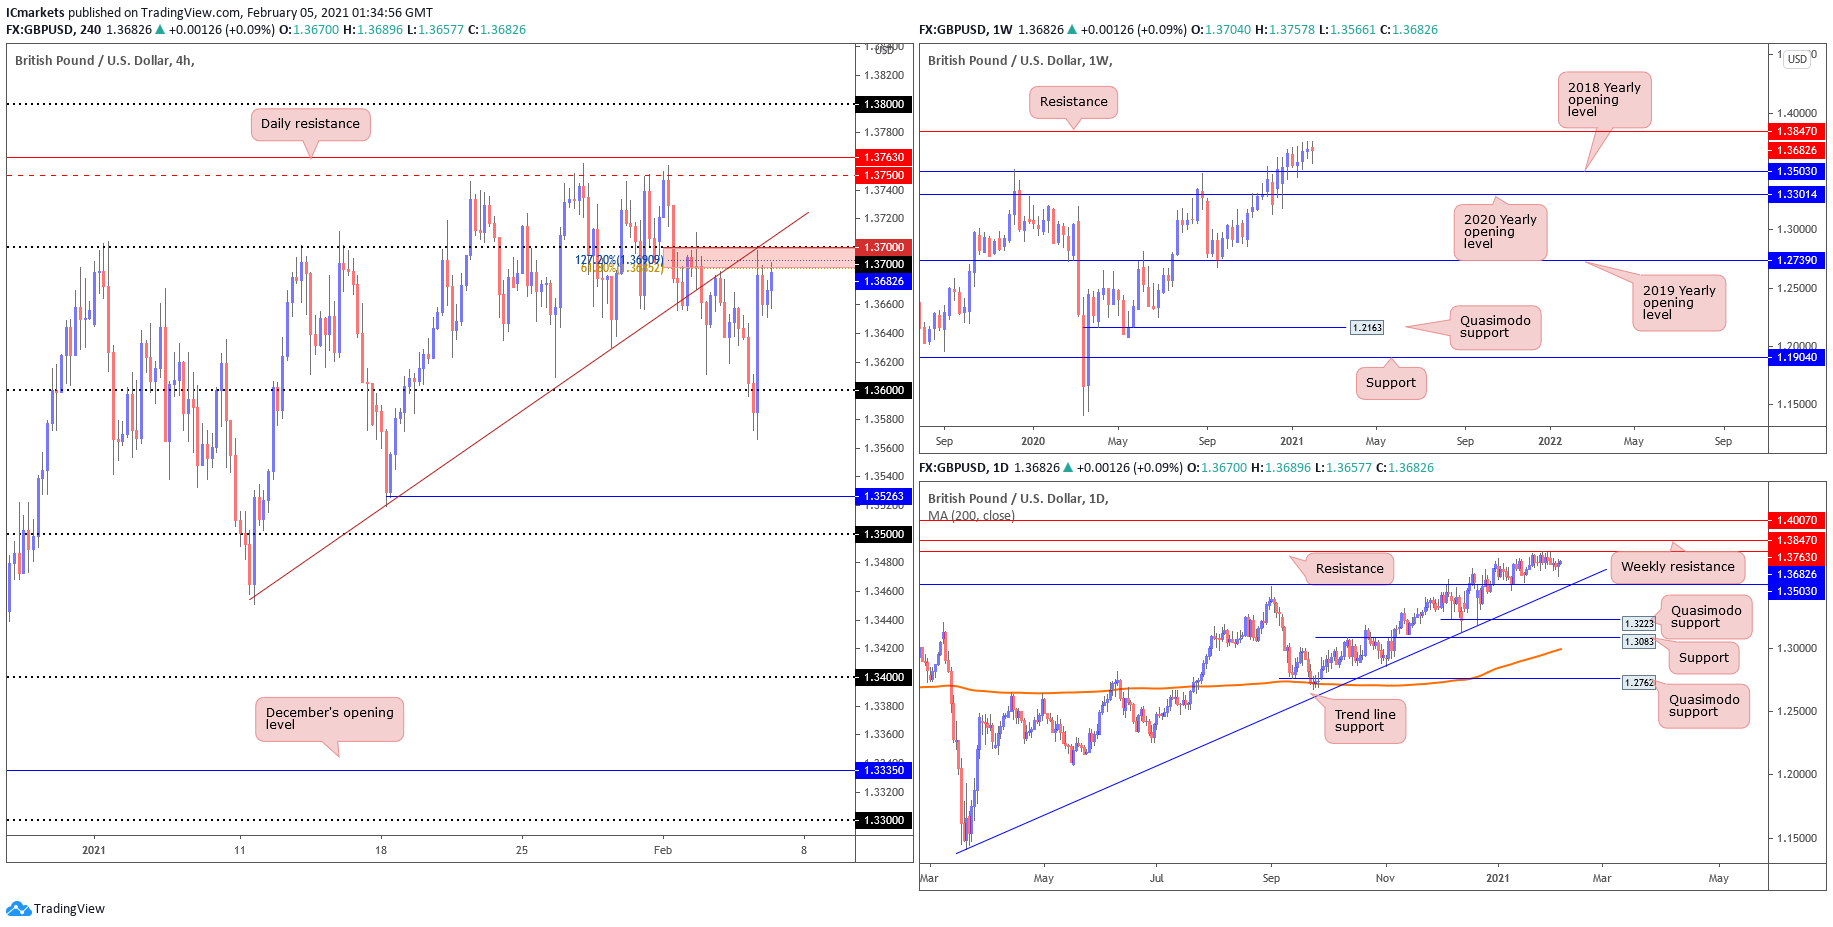
GBP/USD:
Looking at the weekly chart, we can see that prices are trading between our weekly support at 1.35030 and weekly resistance at 1.38470. On the daily time frame, there was a reversal below the daily resistance at 1.37630 and we are seeing limited downside before prices reach our weekly and daily support at 1.35030, in line with our daily ascending trend line.
On the H4 timeframe, short term resistance at the 1.3700 resistance area, coincides with the graphical resistance area, 61.8% Fibonacci Retracement and 127.2% Fibonacci Extension. This would be an interesting level for sellers and recent price action around that area suggests it is a strong area of supply flowing in where prices could be faced with bearish pressure below this level. This could signal a potential reversal to our next short term support level at 1.35263, keeping in mind the view on the larger time frame .
Areas of consideration:
- 3700 resistance area found on H4 timeframe
- 35263 support level on H4 timeframe
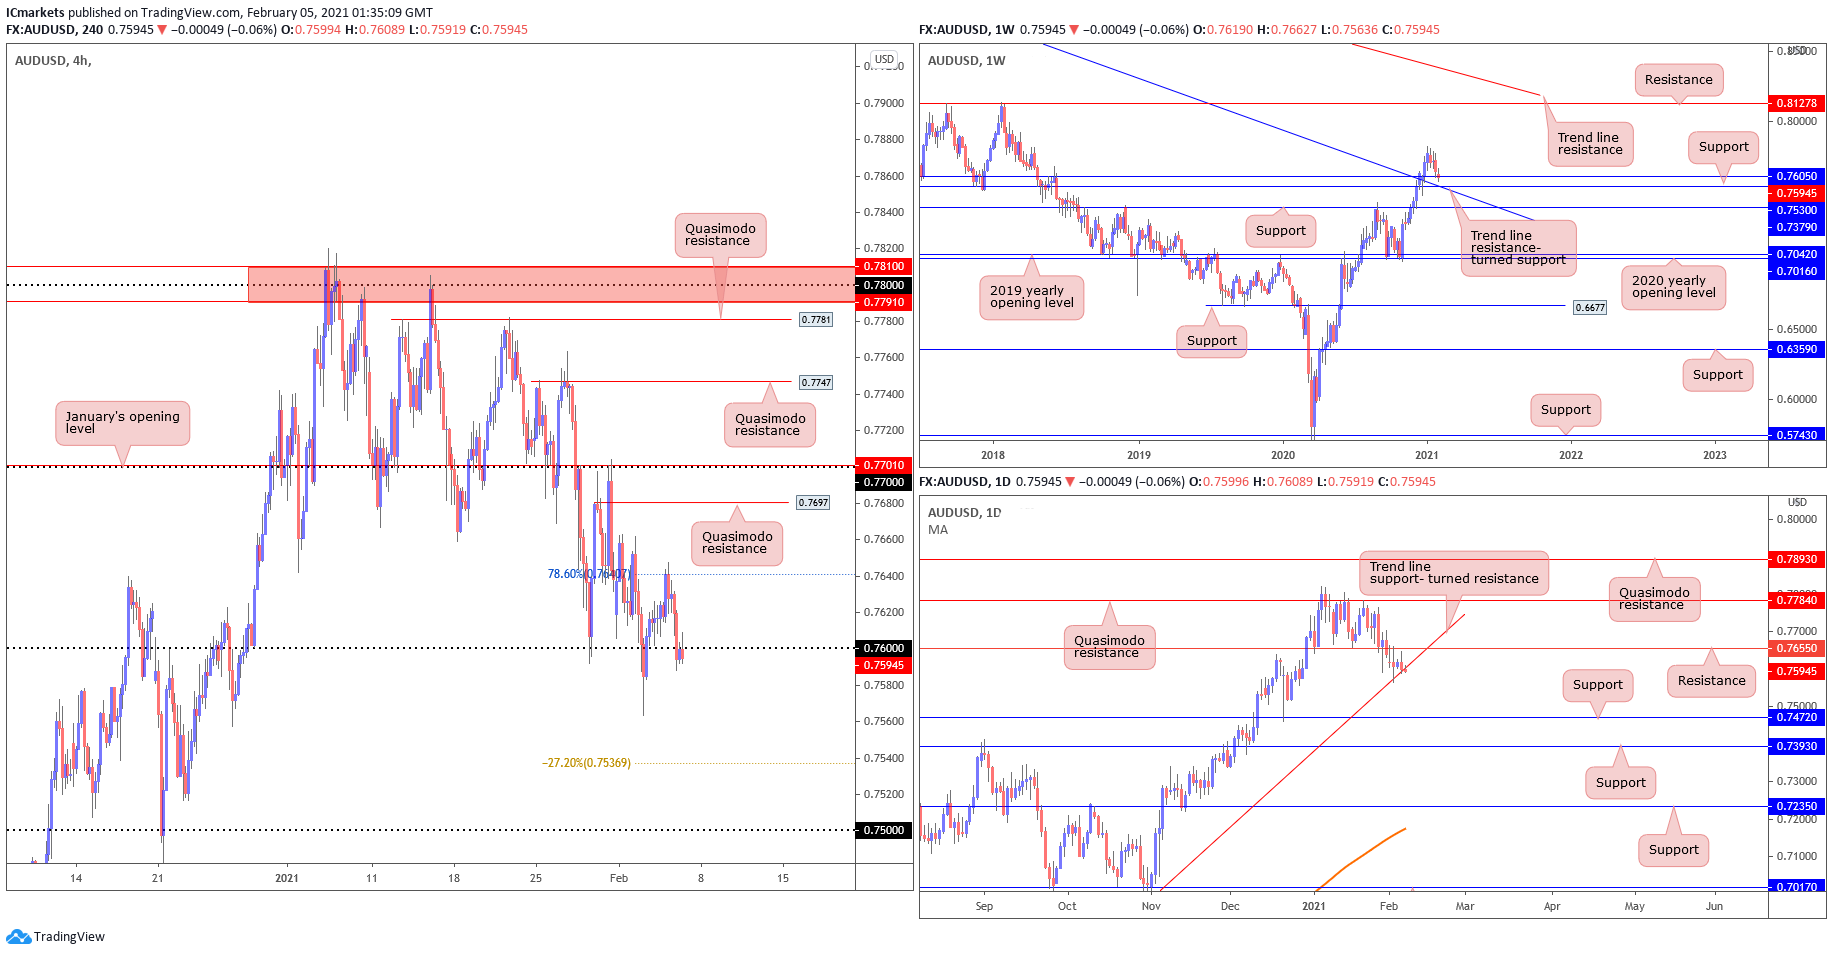
AUD/USD:
USD continues to show strength against the AUD.
From the weekly timeframe, prices are still in a bullish momentum, we are seeing price testing the 0.7605 support level on friday. If price manages to close beneath this support line, it may turn the level into resistance which could possibly allow price to make a beeline to the next support at 0.7530 where the trendline resistance-turned support taken from 1.108 is. On the Daily, price have closed beneath the trendline support-turned resistance, which is in line with the view on H4, as price reversed perfectly at the 78.6% fibonacci level and continued its bearish strength by breaking the major figure of 0.76. We are seeing a retest of the major level 0.76 where it could potentially be our port of call down South towards the -27% retracement.
Areas of consideration:
- Reversed from 78.6% retracement shows continuation of bearish move, potentially towards -27% retracement.
- Daily trendline support has been broken
- Weekly shows testing of support level 0.7605.
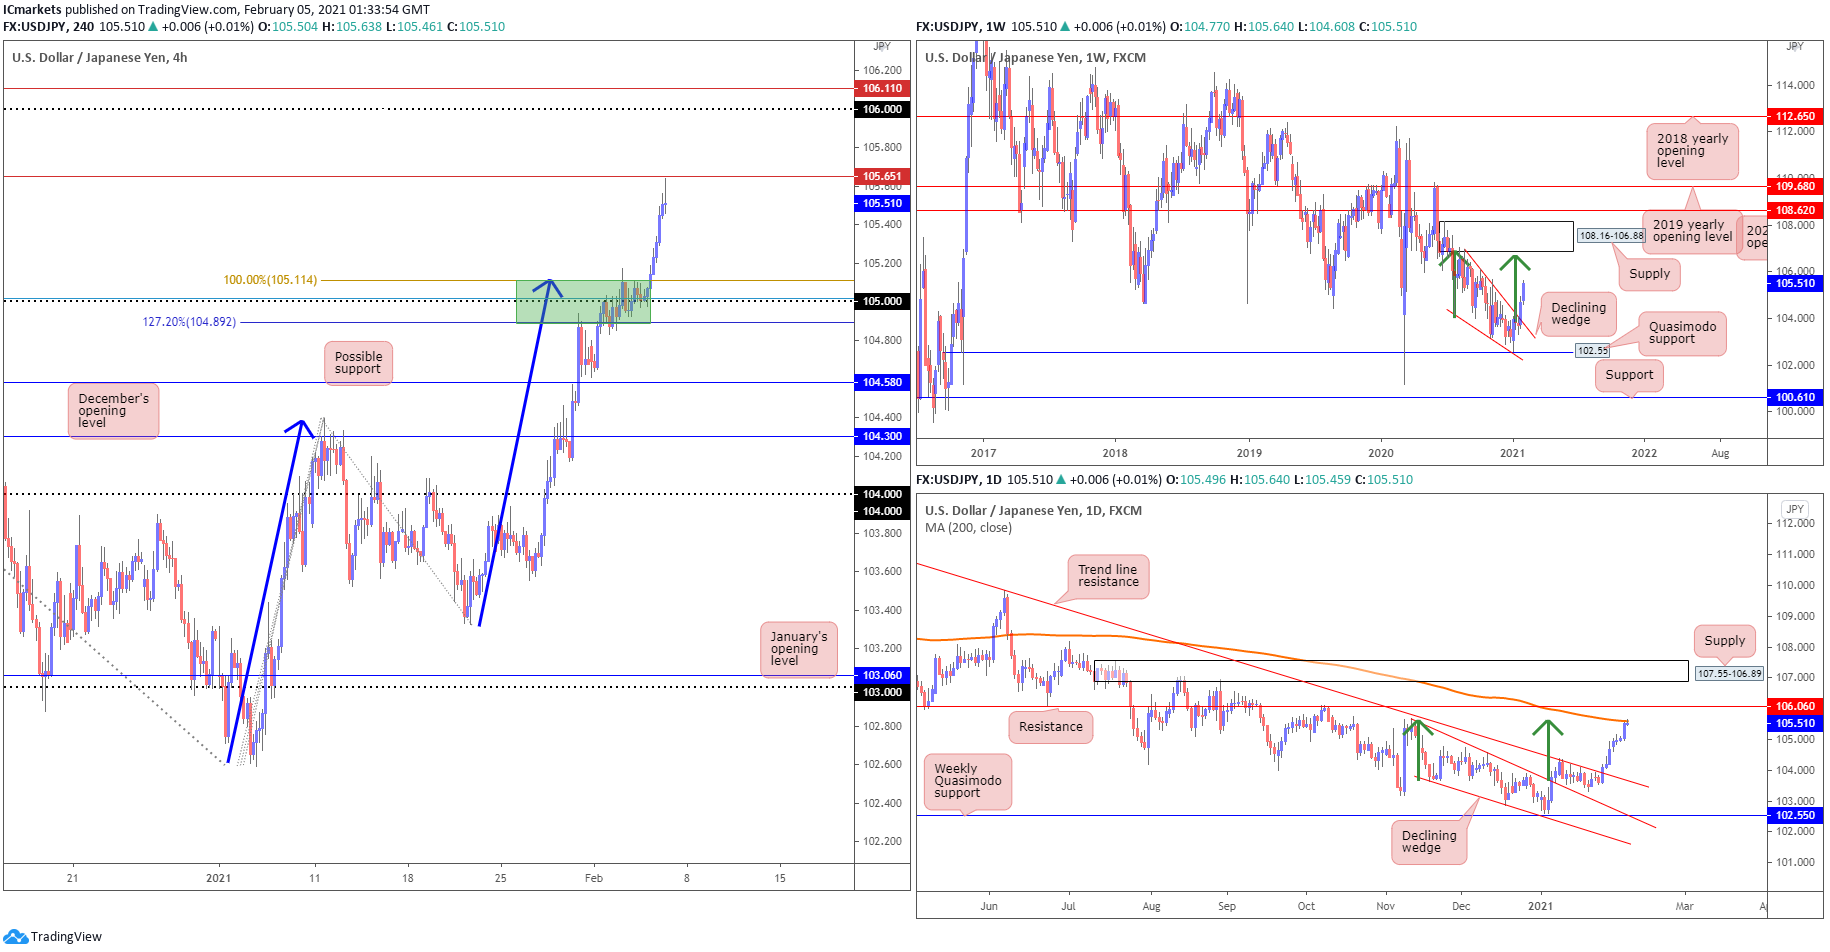
USD/JPY
The US dollar continued to clock fresh monthly highs against the Japanese yen, with H4 breaking above 100% Fibonacci extension at 105.11 seen in AB=CD (blue arrows) . It reversed slightly from horizontal swing high at 105.65. Since then, we have seen buyers step aside, kicking the 105.11 figure back into the light as a possible support level.
Against the backdrop of the H4 timeframe, Monday’s advance added upside impetus to the recent breakout above the weekly declining wedge (106.94/104.18). On the daily chart, price broke above the declining wedge and bounced further towards the weekly resistance level at 106.06, in line with the MA200 resistance. The daily timeframes displaying room to reach 106.06 underpins the possibility of further buying materialising north of 104.914(H4). However, before that on the H4 chart, we couldn’t ignore the resistance at 105.114 where the 100% fib extension is. If price is able to break above this 105 to 105.114 resistance zone, then we could expect the price to go north of 106.06 (weekly and daily).
Areas of consideration:
- 06 resistance on the Daily timeframe
- 65 resistance on H4 timeframe, in line with horizontal swing high resistanc
USD/CAD:
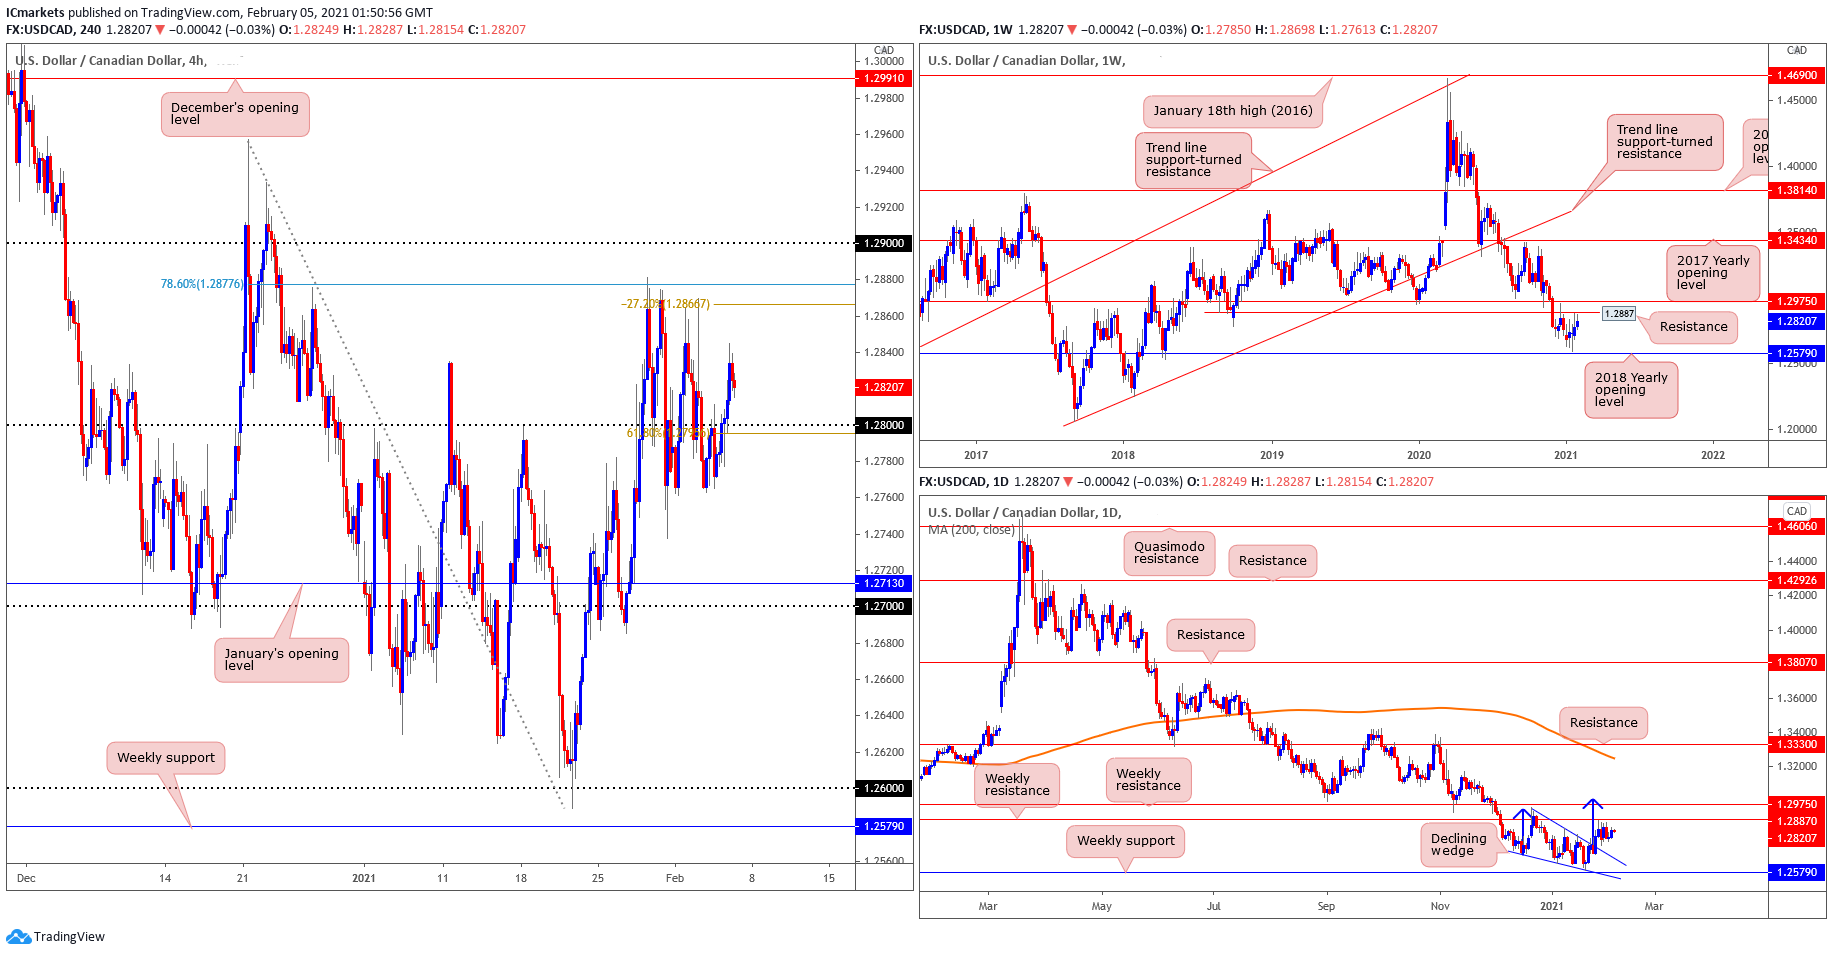
Looking at the weekly chart, prices may approach our weekly supply area at 1.2887 – 1.29750, which coincides with our 2020 yearly opening level for a retest before continuing the long-term bearish move which has been dipping since March (2020). On the daily time frame, the resistance target obtained using a 100% projection starting from the breakout of the declining wedge lines up with the weekly resistance area we have identified and was a key graphical resistance area, price have yet to reach the target at 1.2975.
H4 has bounced from the 38.2% Fibonacci retracement ratio and showed an interesting bullish move breaking past the 1.28 major figure and created a new lower high. Price may pull back into the 61.8% retracement which is in line with the 1.28 major figure as well as horizontal graphical area, then make its way up North towards the -27% retracement, and retest the 78.6% retracement drawn from 21st December (2020). That said, we do caution the limited upside, keeping in mind the support level that prices have been showing a bearish move since March (2020).
Areas of consideration:
- Price may potentially pullback to test 1.28 major figure and 61.8% retracement.
- Further H4 push to the upside of 1.287 after pullback has been achieved goes inline with Daily 100% projection from Declining Wedge.
USD/CHF:
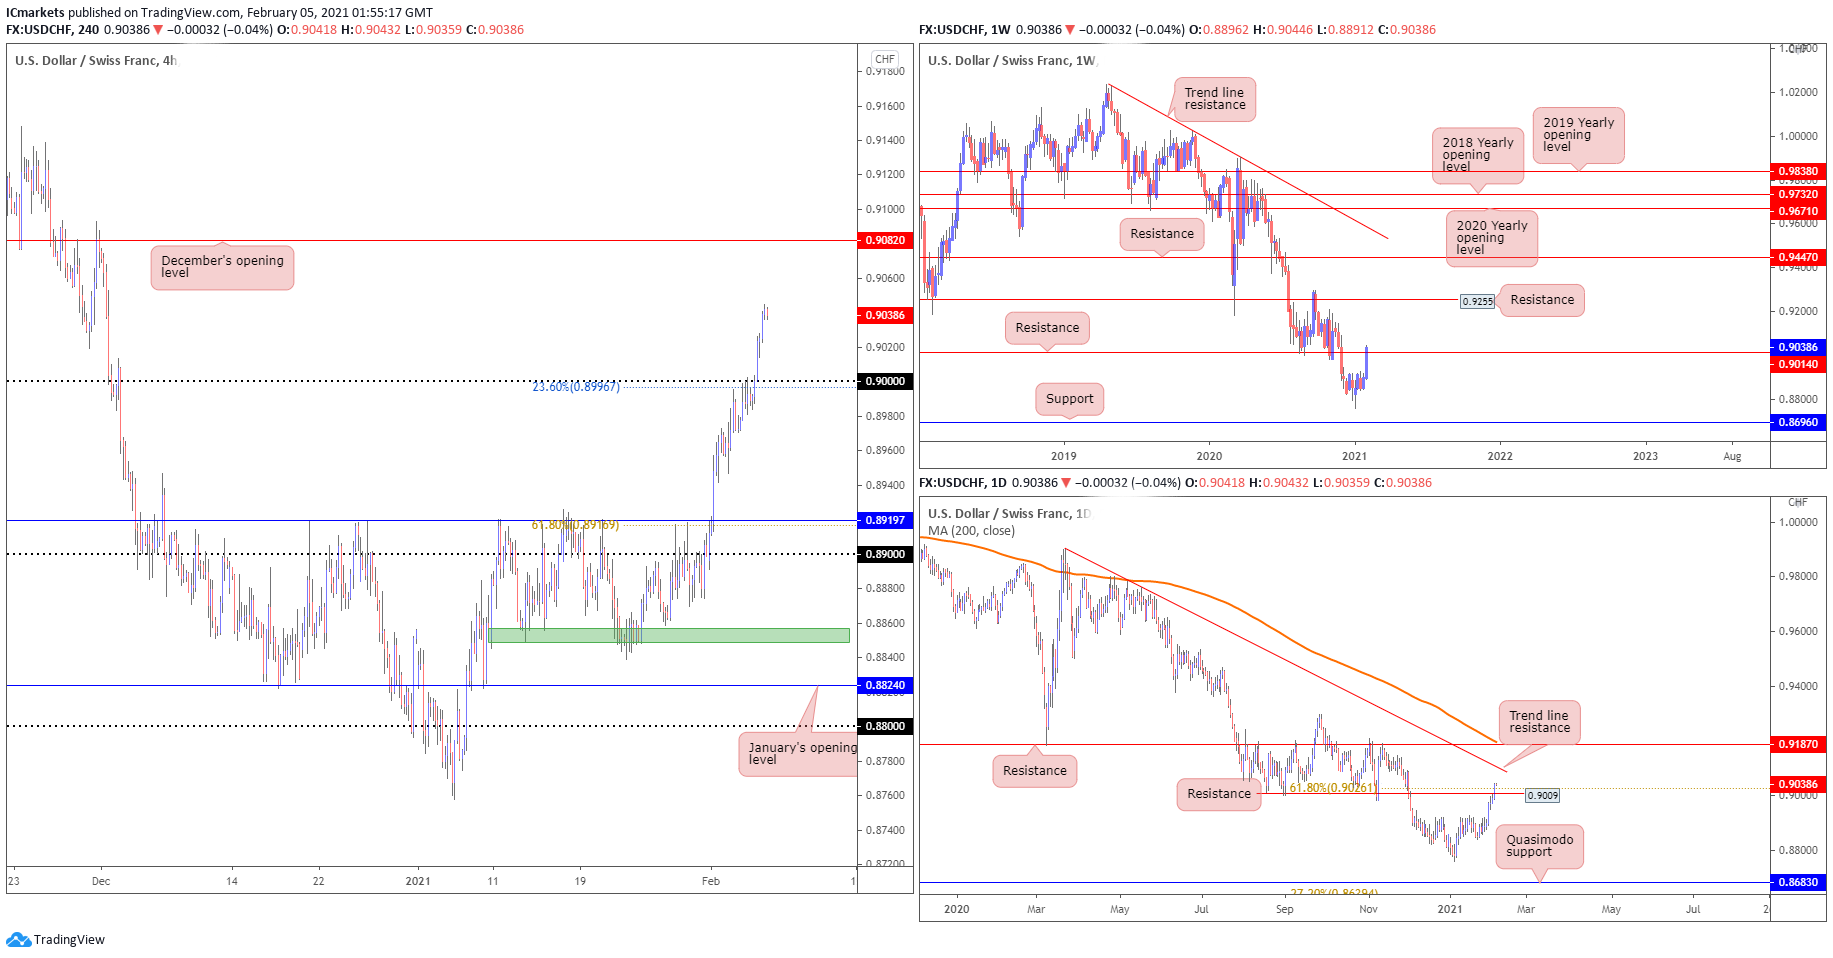
On the weekly timeframe, USD/CHF has just shown a strong break above the horizontal pullback resistance level at 0.90140, which may provide the momentum needed for the continuation of the bullish move towards the next resistance level at 0.9255 in line with our horizontal swing high resistance. Buyers should note that price continues to hold below the descending trendline, which may still provide major resistance for the bullish move upwards.
The daily timeframe also shows that price has broken above the resistance level at 0.9009, in line with our 61.8% Fibonacci retracement. We see a potential for limited upside, where price could rise further to test the descending trendline resistance and moving average. Otherwise, should price continue to hold below the trendline and moving average, there is potential for a bearish scenario where price drops to the 0.86830 which is our Quasimodo support level.
Looking at the H4 timeframe, price shows a clear break above the strong resistance level at 0.9000, which is also in line with our 23.6% Fibonacci retracement. In this bullish scenario, we expect price to go north of 0.90820, which was the opening level of December 2020. However, a retest of the 0.9000 level may push prices further south towards the 0.89197 level, which is also in line with 61.8% Fibonacci retracement and horizontal pullback support, providing strong support.
Areas of consideration:
- USD/CHF shows bullish momentum on the daily and H4 timeframe.
- 9000 level is a level to watch as a horizontal pullback support should prices come back to retest the level.
- 90820 is a potential upside level in line with December’s opening level.
Dow Jones Industrial Average:
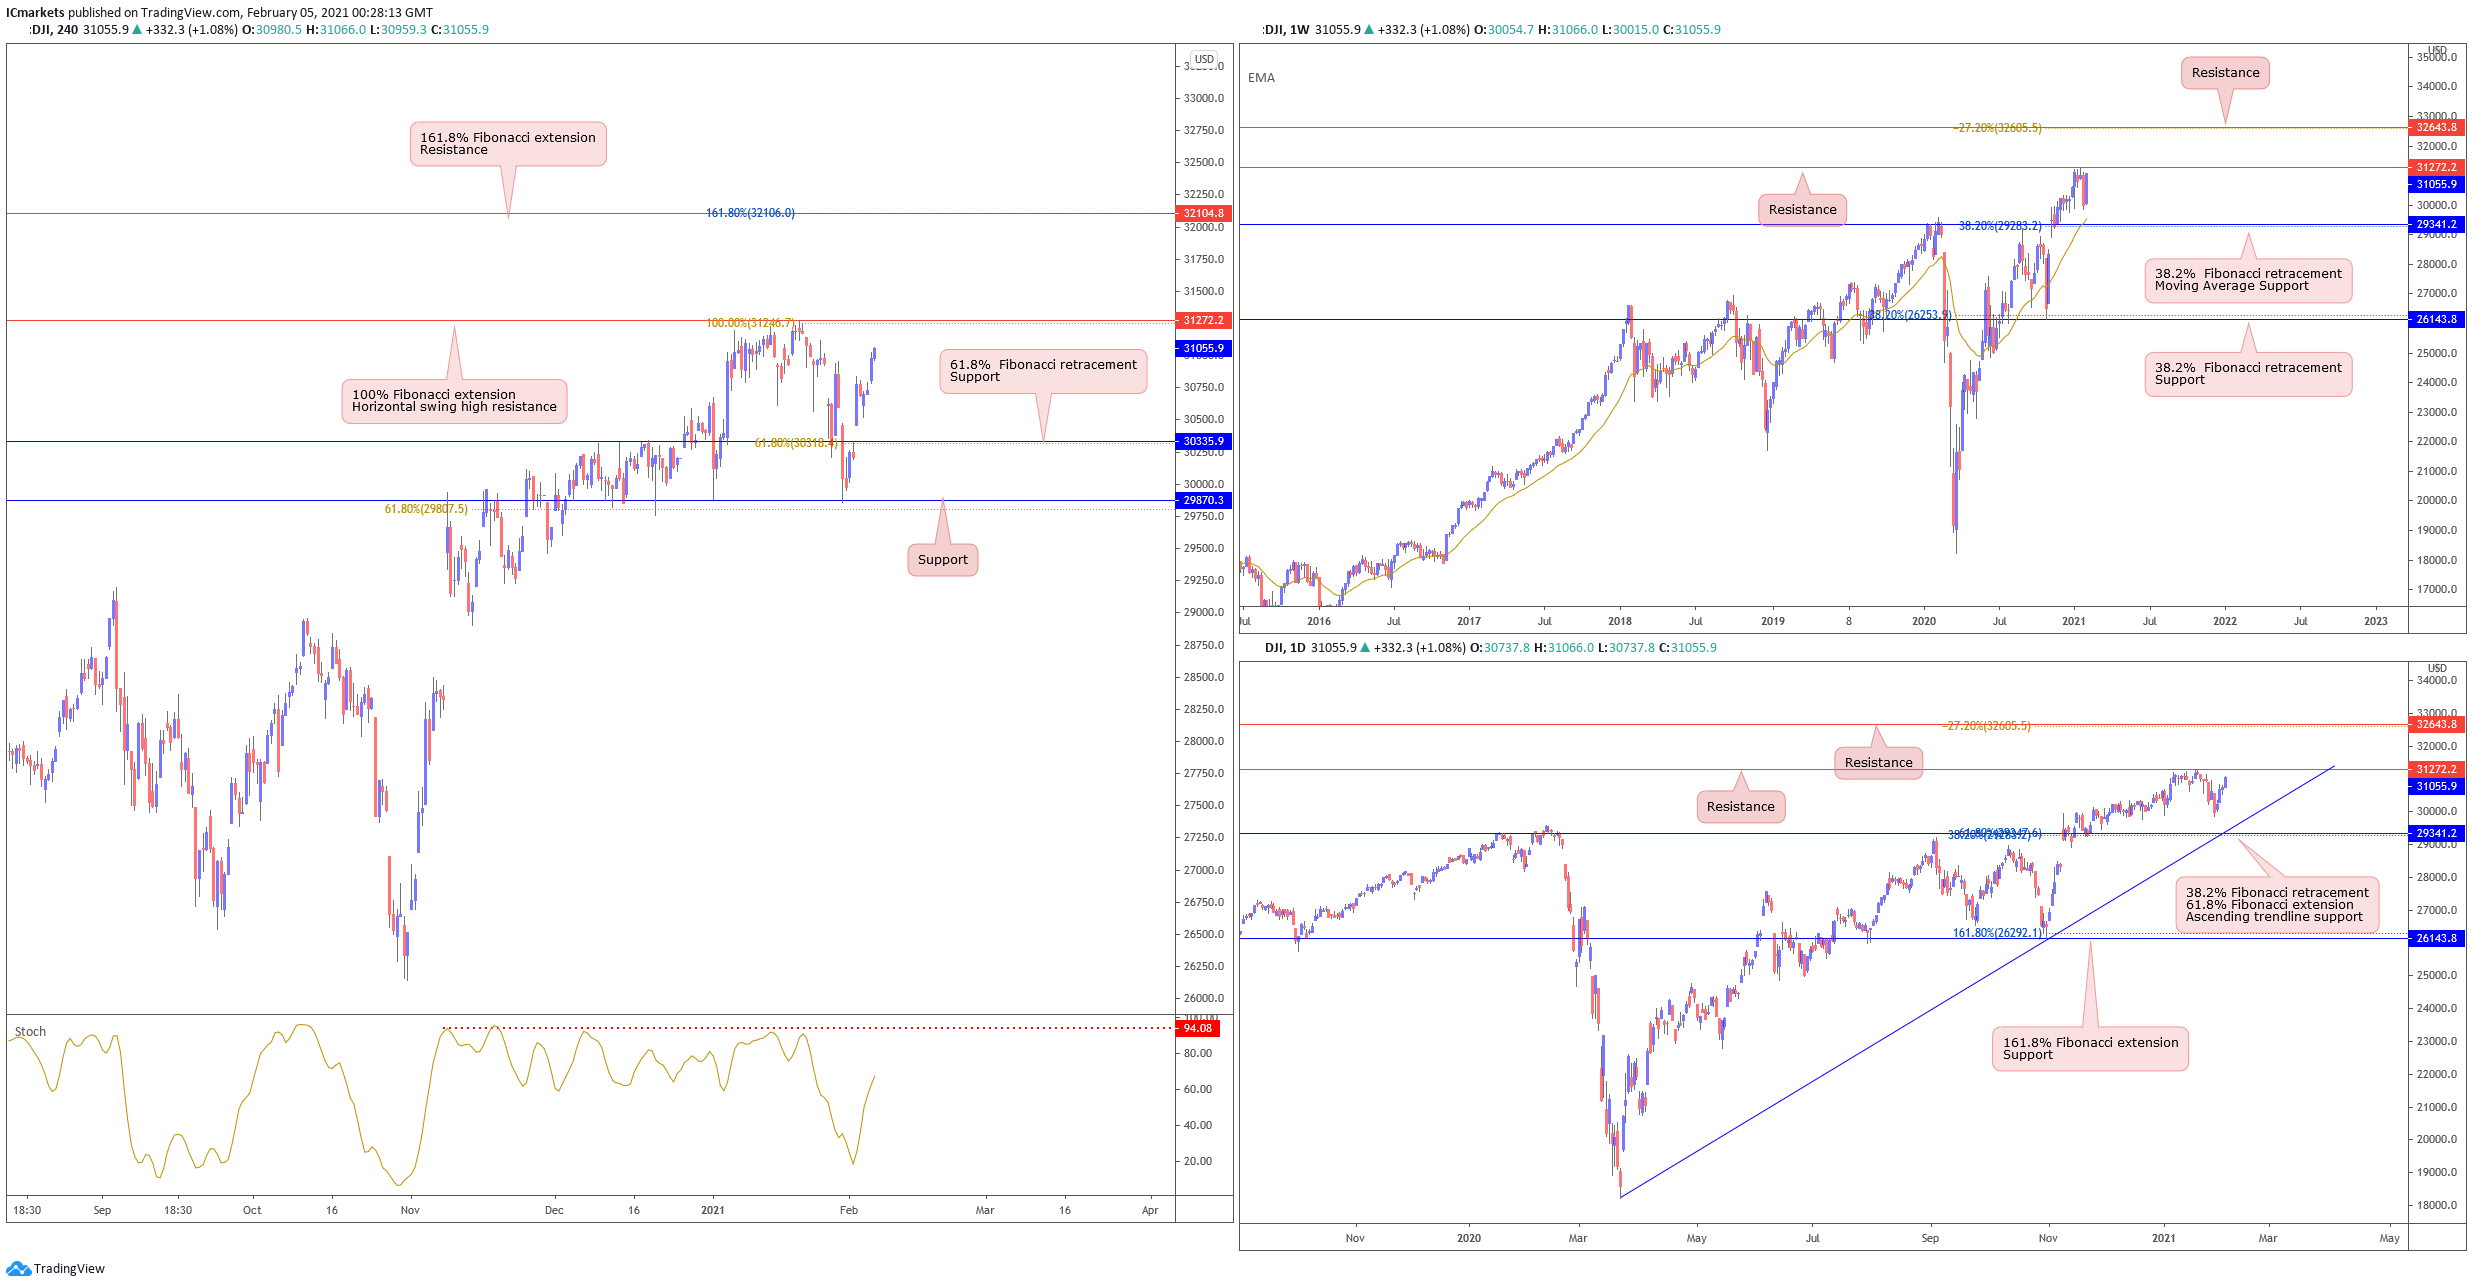
As we round out the week, price bounced above key graphical weekly overlap support at 29340 and is now back to testing 2021 year high at 31272 resistance. Strategically speaking, there is still a possibility that investors could still see price ranging sideways between 29340 support and 31272 resistance. Only a weekly close above 31272 resistance will we see a new all time high being formed. On the daily chart, price is still holding above the daily ascending trendline support and seems likely to break 31272 resistance.
On the H4, price pushed higher overnight, edging closer towards 31272 resistance. With Stochastic indicator coming close to resistance where price made pullbacks in the past, we see a low probability scenario where 31272 resistance could see sellers entering and adding to their shorts to push price lower to 30335 support as a possible target. Otherwise, a break and a daily close above 31272 will see market making new highs and pushing towards 32104 resistance next.
Areas of consideration:
- Stochastics resistance where price reacted in the past
- 31272 key resistance as the all time high and also currently 2021 yearly high
XAU/USD (GOLD):
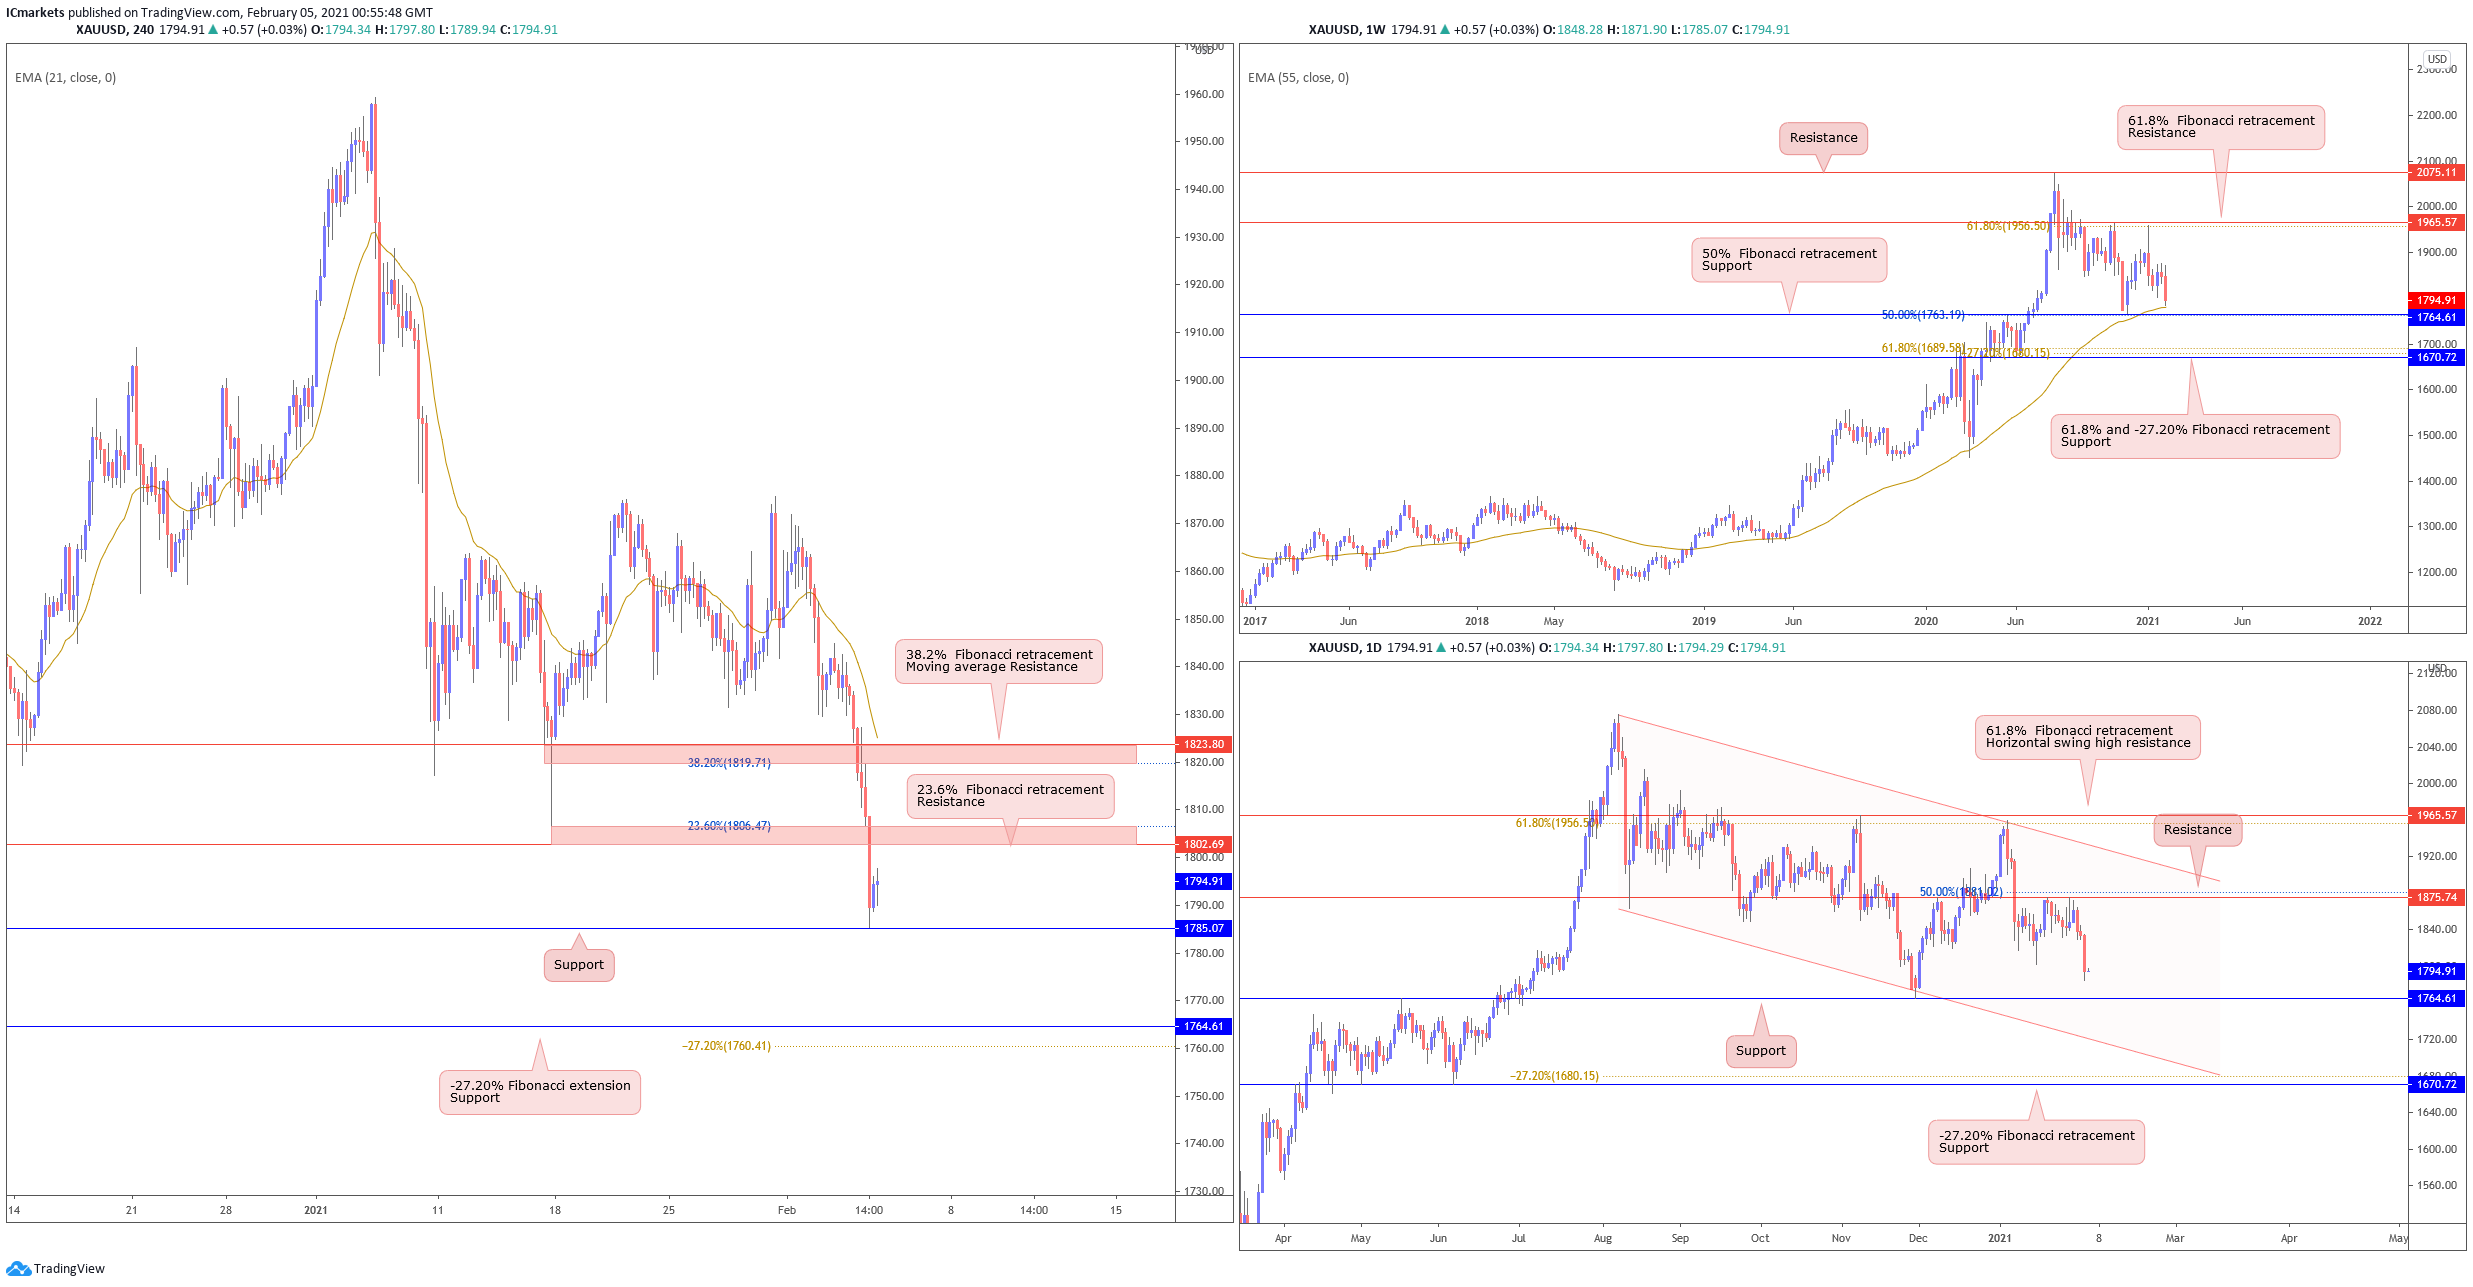
On the weekly timeframe, gold price continues drifting lower but still holding above long term moving average support. With price now close to support at 1764, traders can expect price to show a small bounce reaction above this level. On the daily chart, there seems to be a low probability that price would push towards descending channel support but instead show a limited drop towards 1764 support.
On the 4H timeframe, price drifted lower and broke below previous supports. With price now holding between support at 1785 and resistance at 1802, we prefer to take a neutral stance and watch these two levels. A break above 1802 resistance could see price push higher towards next resistance at 1823 and also moving average resistance. Otherwise, a break below 1785 support will see price drop towards weekly support at 1764.
Areas of consideration:
- 1802 resistance and 1785 support are key levels to watch for either short term pullback or further drop
The accuracy, completeness and timeliness of the information contained on this site cannot be guaranteed. IC Markets does not warranty, guarantee or make any representations, or assume any liability regarding financial results based on the use of the information in the site.
News, views, opinions, recommendations and other information obtained from sources outside of www.icmarkets.com.au, used in this site are believed to be reliable, but we cannot guarantee their accuracy or completeness. All such information is subject to change at any time without notice. IC Markets assumes no responsibility for the content of any linked site.
The fact that such links may exist does not indicate approval or endorsement of any material contained on any linked site. IC Markets is not liable for any harm caused by the transmission, through accessing the services or information on this site, of a computer virus, or other computer code or programming device that might be used to access, delete, damage, disable, disrupt or otherwise impede in any manner, the operation of the site or of any user’s software, hardware, data or property.


