
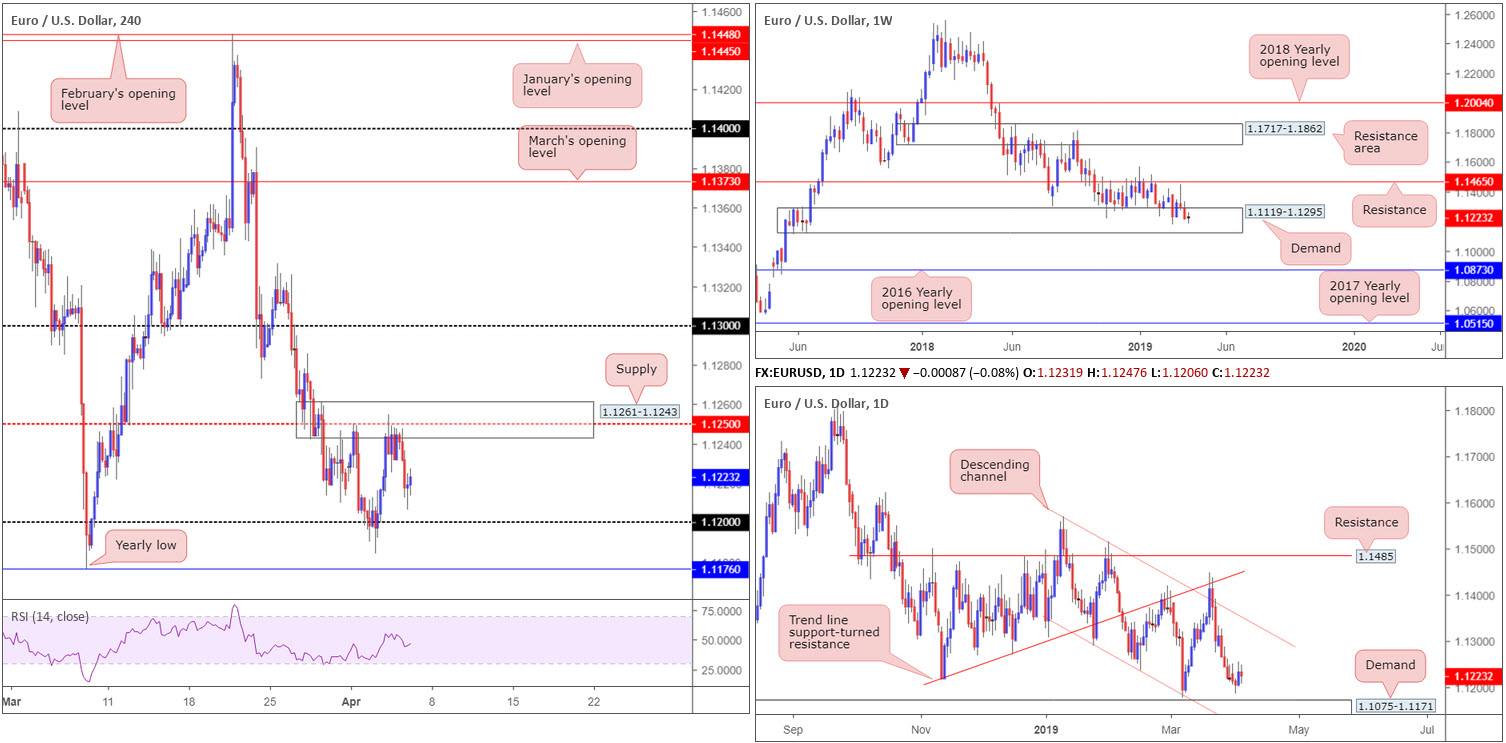
EUR/USD:
Aside from German factory orders plunging by 4.2% month-on-month, Thursday offered little in terms of macroeconomic drivers. H4 supply at 1.1261-1.1243, alongside the 1.1250 psychological resistance (red level), elbowed its way into the spotlight Wednesday and, as you can see, capped upside Thursday.
The next support target in view on the H4 timeframe rests around 1.12, closely followed by the 2019 yearly low of 1.1176. Ahead of today’s job’s data out of the US, expected to have added 180K new jobs in March, the research team feels it’s unlikely the pair will breach 1.1261-1.1243/1.12.
From a weekly perspective, the unit is trading on an unchanged basis at the moment, still seeking direction within the walls of demand at 1.1119-1.1295. The story on the daily timeframe, however, displays room to press marginally lower, targeting demand priced in at 1.1075-1.1171. Note this zone is glued to the underside of the current weekly demand.
Areas of consideration:
The 2019 yearly low 1.1176 along with the top edge of daily demand at 1.1171 is an interesting combination of support. These levels, bearing in mind both are positioned within weekly demand, are likely to hold buyer interest today should we reach this low. The only grumble is the threat of 1.12 acting as resistance and forcing the unit lower. An option to help overcome this is to simply wait and see if the H4 candles reclaim 1.12 to the upside. In doing so, this emphasises buyer intent and could then be traded as a bullish breakout scenario (entry and risk levels can be determined according to the open/close of the breakout candle), targeting the aforesaid H4 supply as an initial take-profit target.
Today’s data points: US Average Hourly Earnings m/m; US Non-Farm Employment Change; US Unemployment Rate.
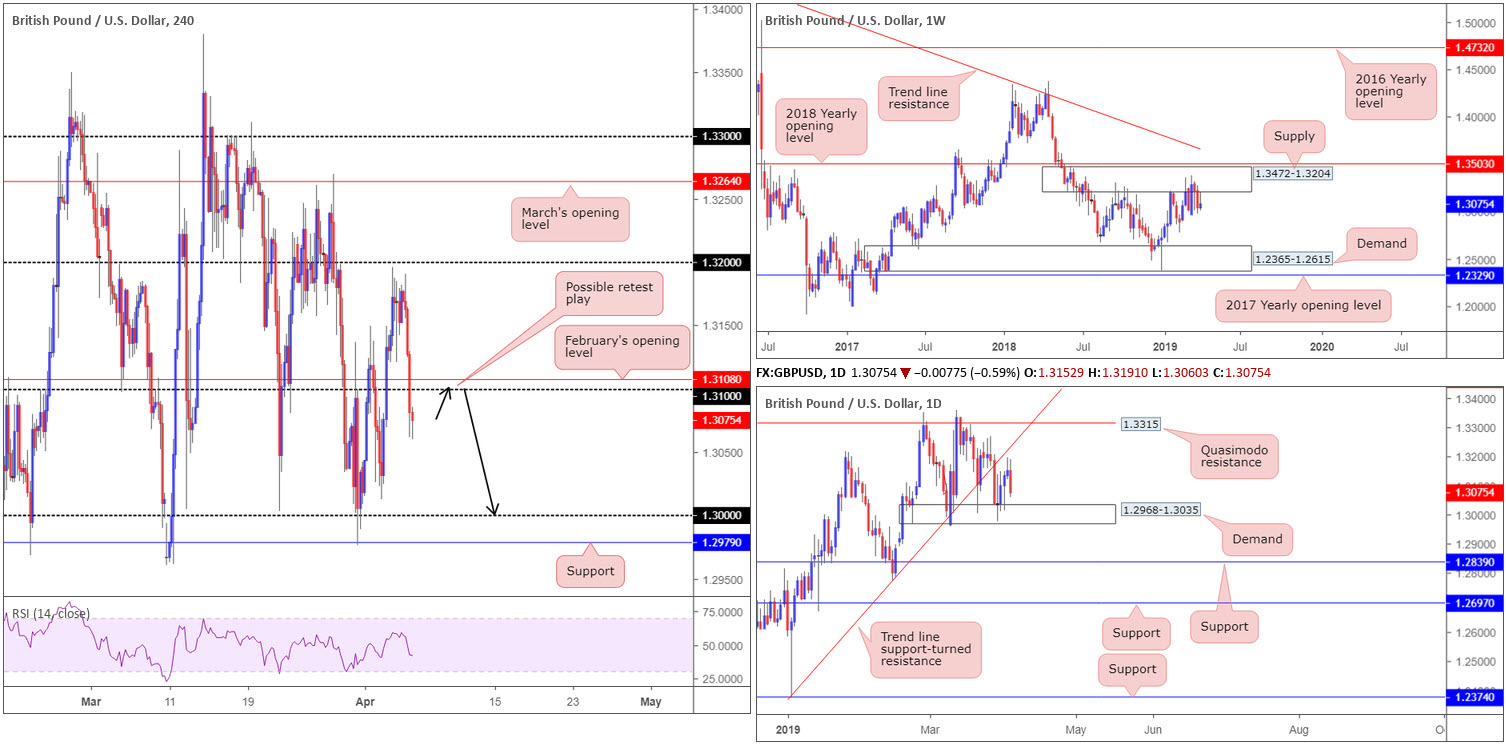
GBP/USD:
Weighed on by a directionless Brexit deadlock, the British pound ceded ground to the US dollar Thursday, down 0.56% as of writing. Leaving 1.32 on the H4 timeframe unchallenged, the market overthrew February’s opening level at 1.3108 and 1.31, and wrapped up the session challenging 1.3060.
The break beyond 1.31 could eventually see the unit revisiting key figure 1.30 and nearby support positioned at 1.2979. Supporting a downward move is the weekly timeframe trading from supply drawn from 1.3472-1.3204. Since the end of February this has been home to many traders as price flips between gains/losses. The next obvious downside target from here falls in around demand at 1.2365-1.2615. Daily price, thanks to yesterday’s bout of selling, has demand plotted nearby at 1.2968-1.3035. Note a break of this area may call for a test of support located at 1.2839.
Areas of consideration:
With all three timeframes expressing scope to explore lower ground, a retest at 1.31 may be in store today. Preferably in the shape of a H4 bearish candlestick formation (entry and risk levels can then be arranged according to this pattern), a short could be initiated from 1.31, targeting 1.3035 as the initial port of call: the top edge of daily demand, tailed closely by 1.30.
Today’s data points: US Average Hourly Earnings m/m; US Non-Farm Employment Change; US Unemployment Rate.
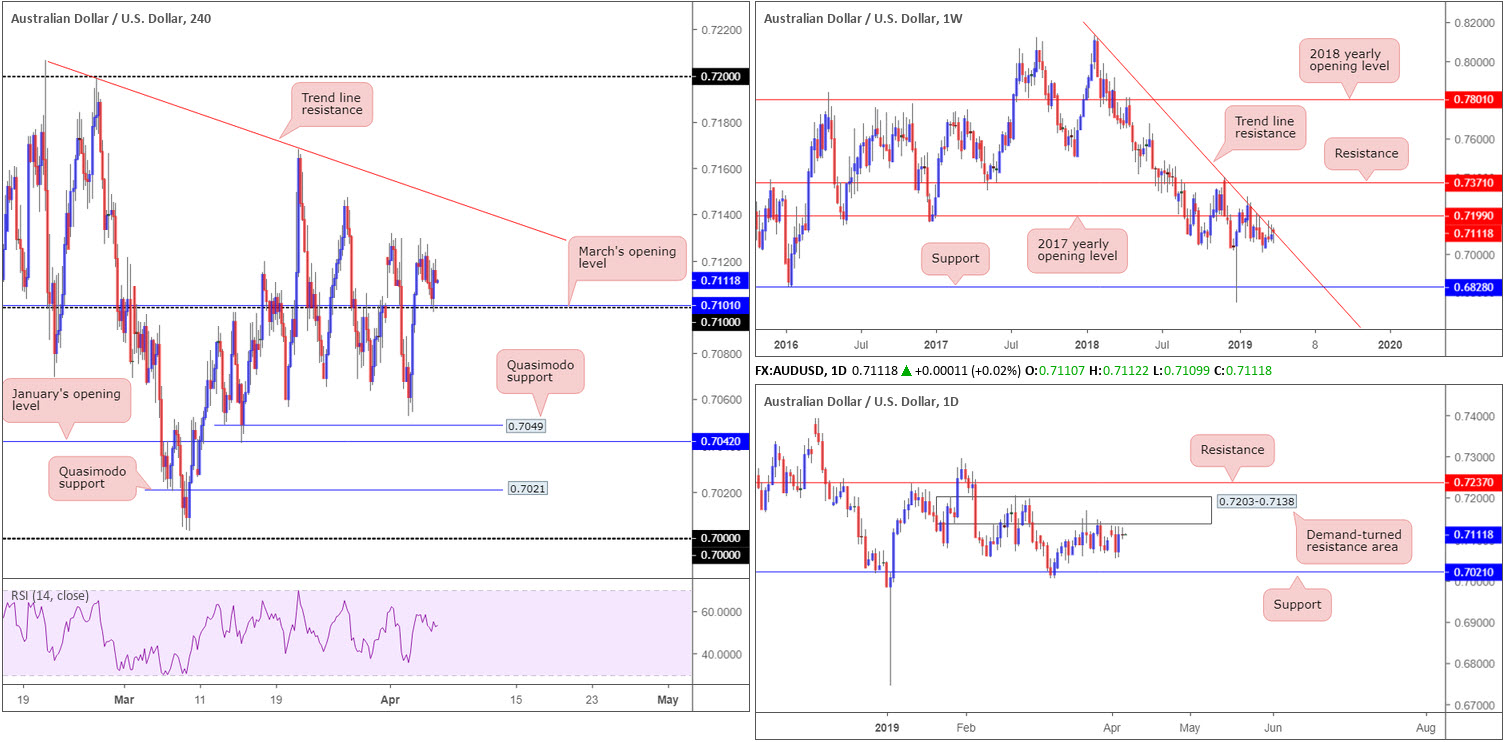
AUD/USD:
The Australian dollar struggled to pencil in any meaningful direction against its US counterpart Thursday. Despite the somewhat lacklustre performance, though, H4 flow retested 0.71 as support, along with March’s opening level merging at 0.7101.
The test of 0.71, which is holding as we head into Asia Pac trade, has likely aroused the attention of shorter-term traders. While a break/retest formation of a round number is enticing, location is key. Higher-timeframe structure, as underlined in Thursday’s briefing, unfortunately screams resistance. Longer-term flows reveal weekly action challenging a long-standing trend line resistance (etched from the high 0.8135). The market could eventually observe a selloff take shape from here as downside appears reasonably free until connecting with support coming in at 0.6828. Further adding to this bearish note, the daily timeframe has its candles hovering just south of a demand-turned resistance area positioned at 0.7203-0.7138, with support plotted at 0.7021 as the next downside target.
Areas of consideration:
Entering long from 0.71 is a chancy trade for reasons stated above.
In the event our higher-timeframe reading is accurate and H4 action overthrows 0.71 to the downside again, selling this market (preferably on a retest – entry and risk levels can be determined according to the rejection candle’s structure) towards Quasimodo support at 0.7049 is an option.
Today’s data points: US Average Hourly Earnings m/m; US Non-Farm Employment Change; US Unemployment Rate.
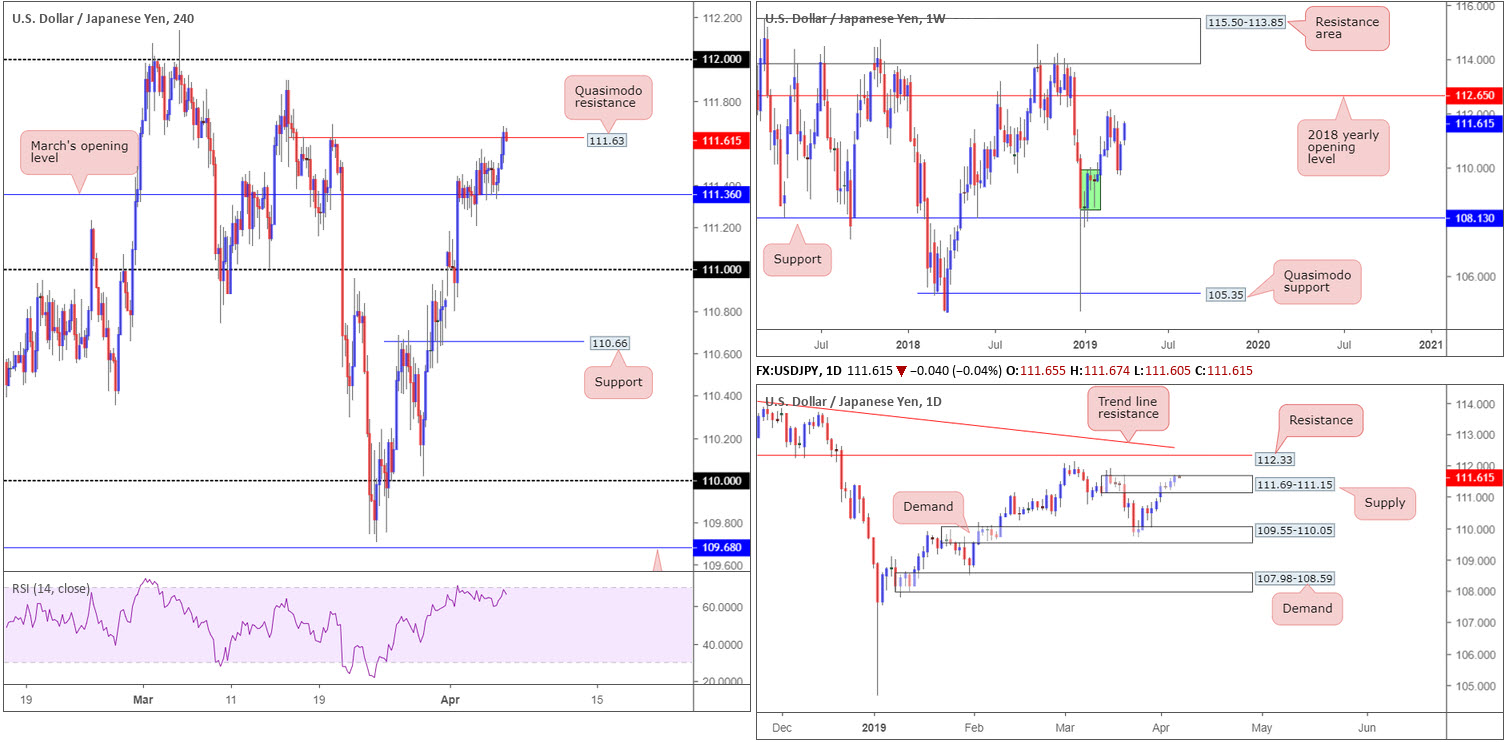
USD/JPY:
Improving risk sentiment, coupled with the US dollar index advancing higher and erasing Wednesday’s losses, lifted the USD/JPY market to higher ground Thursday. March’s opening level on the H4 timeframe at 111.36, as you can see, served the pair well as support, concluding the session testing nearby Quasimodo resistance plotted at 111.63. Beyond here, the 111.90 March 15 high is in view, though the 112 handle is seen as the more prominent resistance. A decisive push back underneath 111.36, nonetheless, may call for a move towards 111.
The Quasimodo resistance mentioned above at 111.63 is of interest. Daily supply at 111.69-111.15, as you can see, encases the said Quasimodo structure within its upper limits. Further supporting sellers from this point is the H4 RSI indicator hovering south of its overbought value.
Areas of consideration:
In light of the current H4 Quasimodo resistance being set within daily supply, a sell, as highlighted in Thursday’s briefing, from here is certainly something to consider. Entry at 111.63 is optimal with a stop-loss order positioned above the upper limit of daily supply at 111.70ish. The first point of concern from here falls in around 111.36. A break beyond here, as emphasised above, likely clears the runway south towards 111.
In the event 111.63 holds and reaches only 111.36, this already offers incredibly attractive risk/reward.
Today’s data points: US Average Hourly Earnings m/m; US Non-Farm Employment Change; US Unemployment Rate.
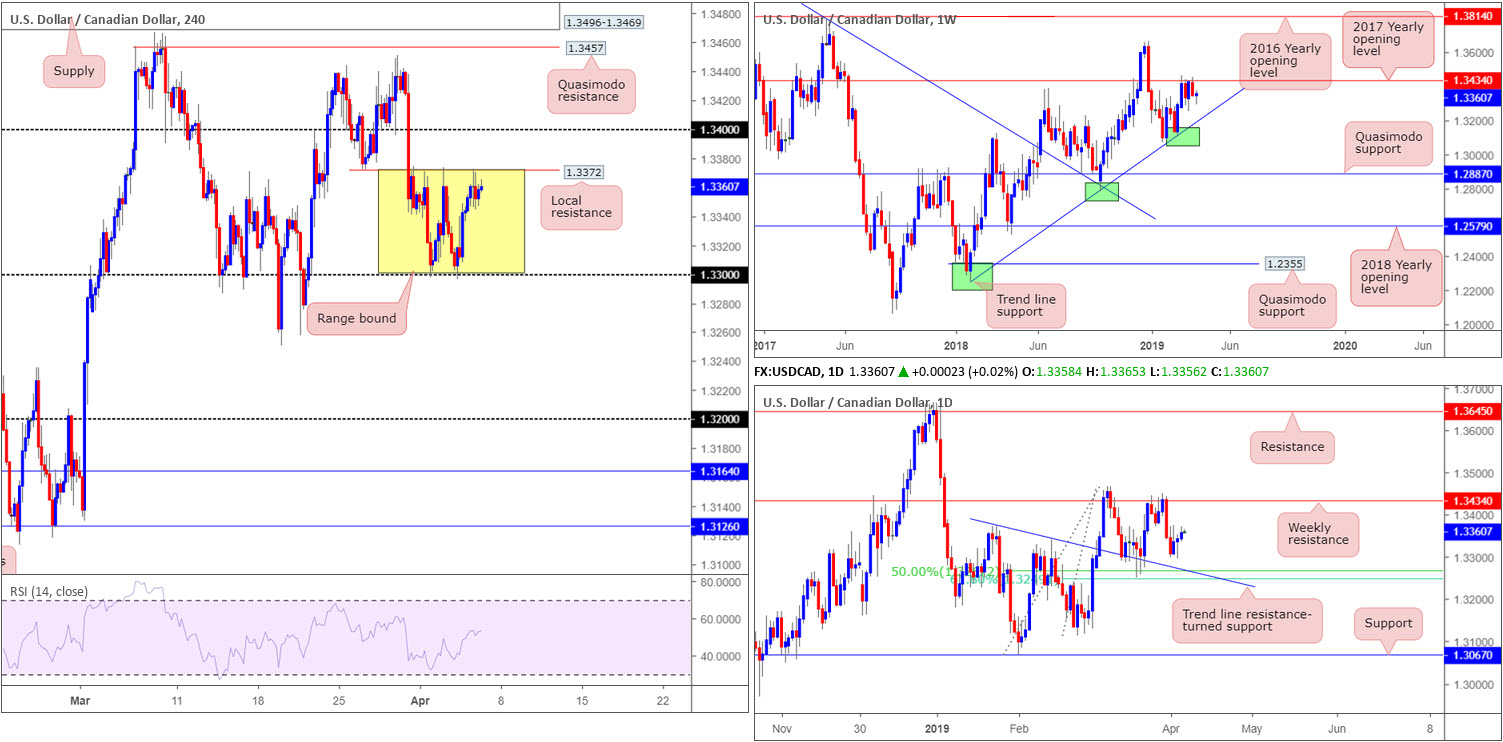
USD/CAD:
Recent developments reveal the H4 candles searched for higher levels Thursday, reaching local resistance plotted at 1.3372. As mentioned in Thursday’s briefing, a week’s worth of price action has seen the unit chisel out a medium-term consolidation between the round number 1.33 and the aforesaid H4 resistance. Outside of this border, the 1.3250 March 19 low is in sight, followed by 1.32. To the upside, however, 1.34 can be seen.
From a longer-term perspective, the pair remains engaged with notable resistance at 1.3434 on the weekly timeframe (the 2017 yearly opening level) following a dominant push higher from trend line support (taken from the low 1.2247). Daily flow, on the other hand, is visibly basing ahead of a 50.0% support at 1.3267, which happens to merge closely with a 61.8% Fibonacci support at 1.3248 and a trend line resistance-turned support (extended from the high 1.3375). Further buying from this point could eventually bring in 1.3434 from the weekly timeframe.
Areas of consideration:
With a double whammy of US and Canadian employment numbers set to hit the wires later today, price action is likely to remain consolidating around the top edge of the H4 range discussed above at 1.3372. With that being the case, traders are urged to take a conservative stance in this market, at least until the aforementioned job’s data clears.
In the event the market chalks up a fairly substantial move today, it is certainly worth keeping tabs on the higher-timeframe levels highlighted above: the 2017 yearly opening level on the weekly timeframe at 1.3434 and the selection of daily supports around 1.3240/60.
Today’s data points: US Average Hourly Earnings m/m; US Non-Farm Employment Change; US Unemployment Rate; Canadian Employment Change and Unemployment Rate.
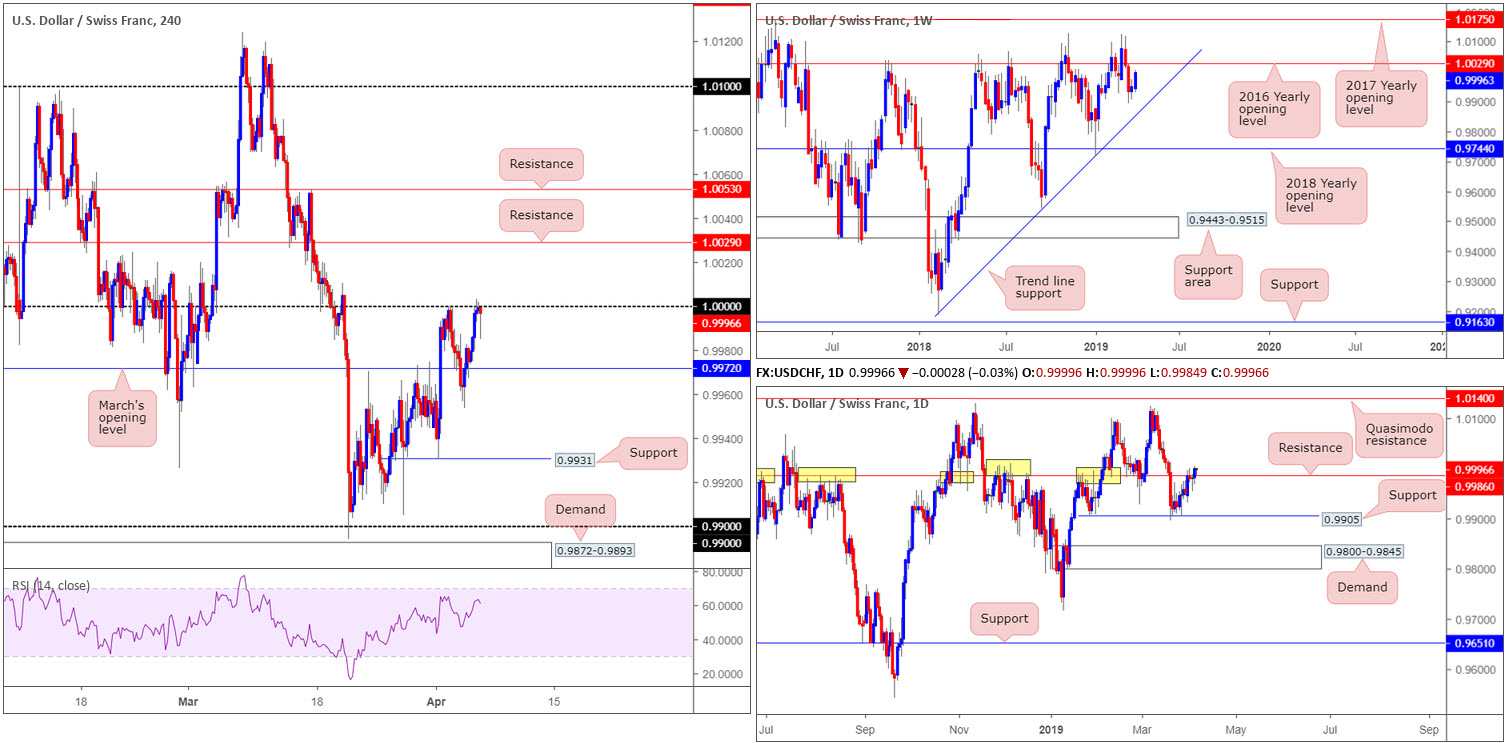
USD/CHF:
In recent sessions, the USD/CHF settled around 1.0000 (parity) on the H4 timeframe, following a modest bout of buying. Sellers are struggling to print anything of worth from this key psychological number, currently trading in the shape of a bullish pin-bar formation. Should we push for higher ground, two layers of resistance are visible at 1.0053 and 1.0029.
Shifting focus to the higher timeframes and we can see weekly movement eyeing a possible retest of its 2016 yearly opening level at 1.0029 as resistance, after failing to test nearby trend line support (etched from the low 0.9187). Note the H4 resistance mentioned above at 1.0029 also represents the 2016 yearly opening level on the weekly timeframe.
A closer reading on the daily timeframe reveals the candles recently broke the 0.9926 Feb 28 low, challenged support at 0.9905 and shortly after retested notable resistance plotted at 0.9986 (history dating as far back as November 2017). Although price action traded beyond the noted level yesterday, the barrier remains an active resistance, according to historical price action in the past (yellow).
Areas of consideration:
In the event H4 flow prints a notable bearish candle from 1.0000 today (entry and risk levels can then be determined according to your chosen confirmation candle), this could be enough to draw the unit towards March’s opening level on the H4 timeframe at 0.9972.
Pushing higher from 1.0000, as noted above, will likely lead to a test of H4 resistance at 1.0029. This level, given its connection to weekly structure, is also likely an area active sellers may reside.
Today’s data points: US Average Hourly Earnings m/m; US Non-Farm Employment Change; US Unemployment Rate.
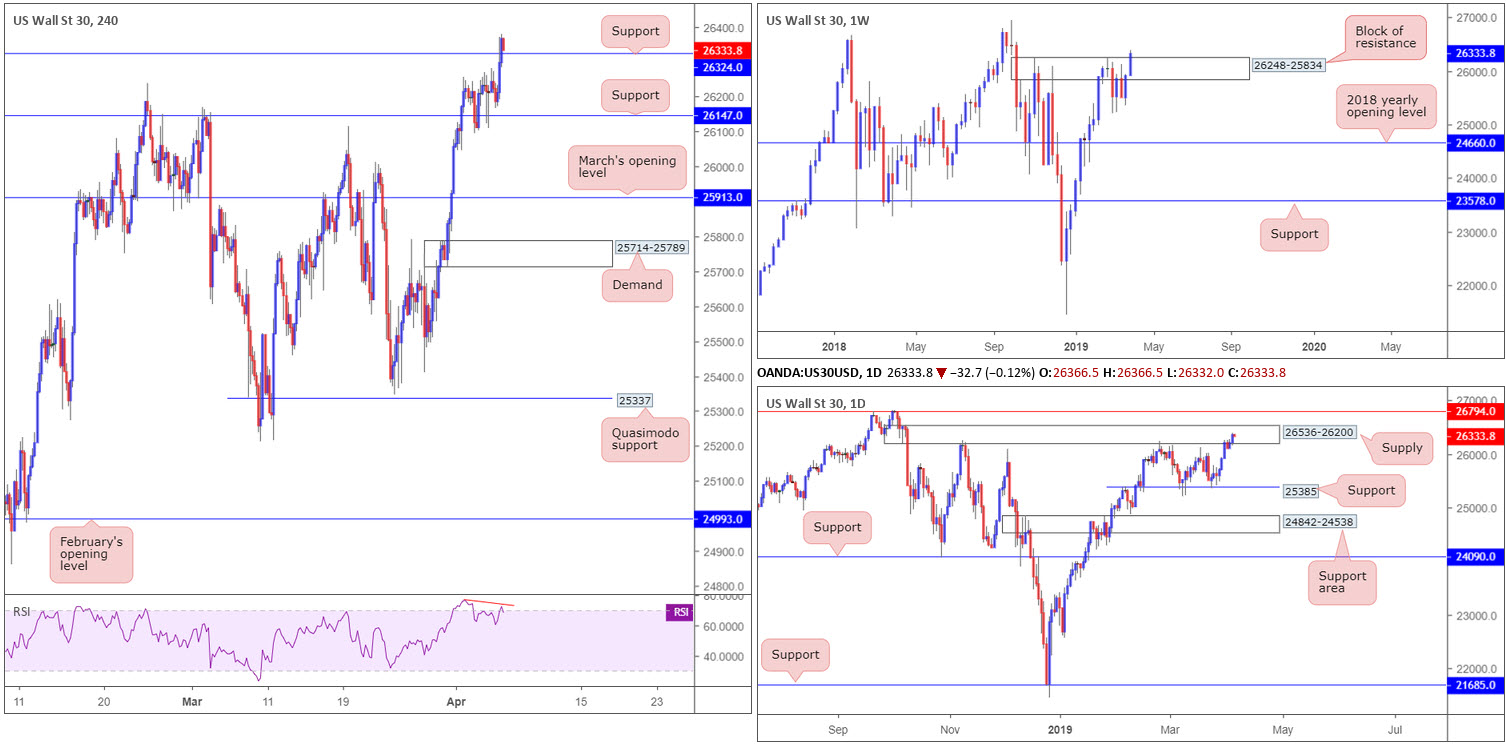
Dow Jones Industrial Average:
Buoyed amid upbeat US/China trade headlines, the Dow Jones Industrial Average extended Wednesday’s gains on Thursday, concluding the session up 0.59%. This, as evident from the weekly timeframe, lifted price action beyond the top edge of a resistance zone at 26248-25834. Assuming the market remains bid, the index could soon be knocking on the door of the all-time high 26939.
In spite of the weekly timeframe’s current position, price action on the daily timeframe has its candles trading within the parapets of supply coming in at 26536-26200. In the event weekly buyers continue to support this market and a break of the noted daily supply is observed, daily Quasimodo resistance at 26794 is in sight as the next viable ceiling.
Recent upside on the H4 timeframe, however, crunched its way through resistance (now acting support) at 26324, potentially exposing resistance coming in at 26540 (not seen on the screen). It may also be of interest to some traders the RSI indicator is displaying a divergence reading out of overbought territory (red line).
Areas of consideration:
Based on the above reading, the research team feels it may be too early to consider buying this market from H4 support at 26324. The rationale behind this approach is due to weekly price not having closed above its resistance area at 26248-25834, and daily price signalling we may still be in for lower prices.
As you can imagine, selling is also precarious and, therefore, this may be a market best left on the back burner until today’s job’s data has had its way.
Today’s data points: US Average Hourly Earnings m/m; US Non-Farm Employment Change; US Unemployment Rate.
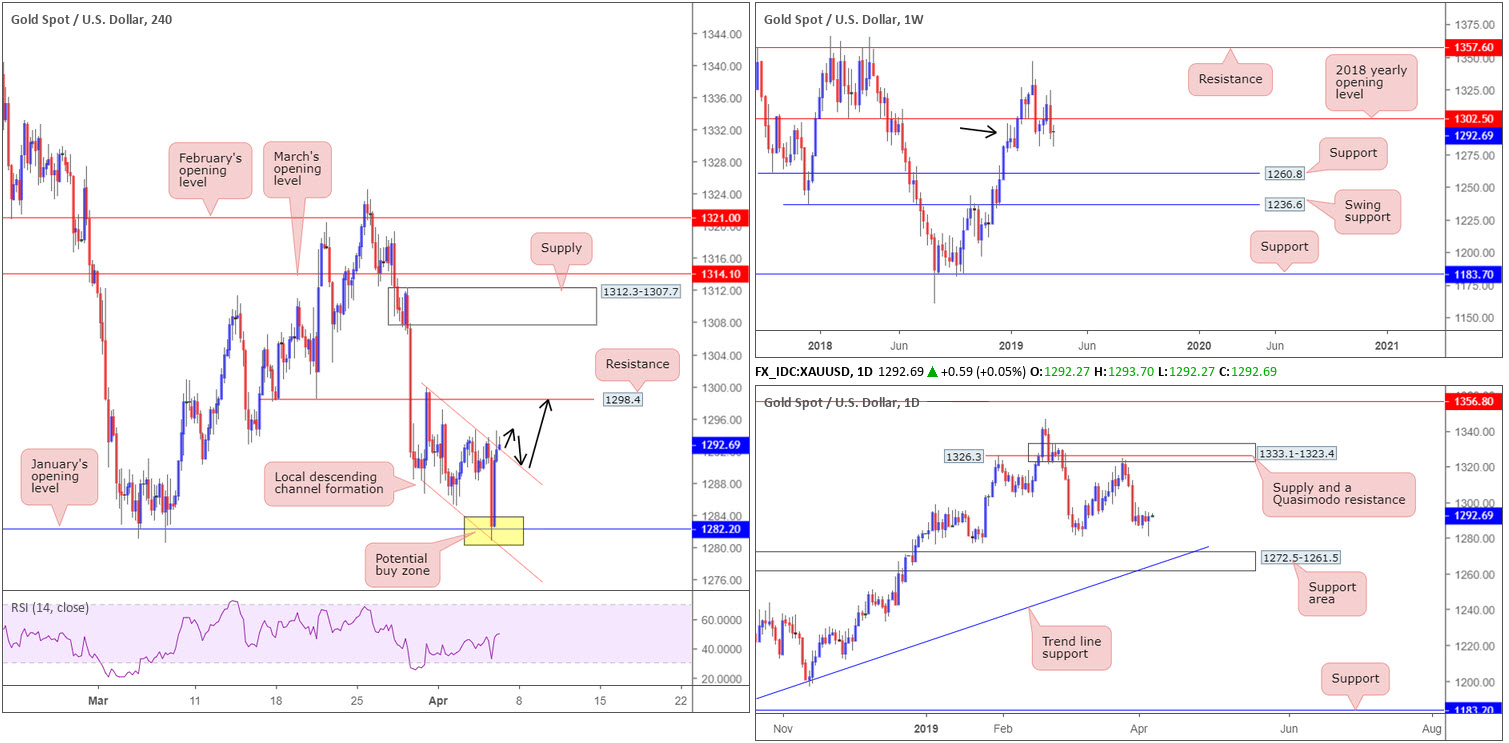
XAU/USD (GOLD):
For folks who read Thursday’s briefing you may recall the piece highlighted a potential buying opportunity from January’s opening level at 1282.2 on the H4 timeframe. The research team favoured this level due to it fusing with H4 channel support (taken from the low 1288.2) as well as intersecting with weekly demand (black arrow) at 1276.9-1295.8.
Well done to any of our readers who managed to take advantage of yesterday’s buying. Going forward, the H4 candles are seen attempting to climb above channel resistance (taken from the high 1299.8), which may lead to a move materialising towards resistance pencilled in at 1298.4. The next area of interest beyond 1298.4 falls in around supply at 1312.3-1307.7, which, as you can see, boasts strong downside momentum from its base. It is also worth noting possible resistance forming on the weekly timeframe from the 2018 yearly opening level at 1302.5.
Moving things over to the daily timeframe, immediate support to be aware of is the 1281.0 March 7 low, followed by a support area coming in at 1272.5-1261.5 and merging trend line support (taken from the low 1160.3). In the event the market continues on its northerly path, resistance is not expected to emerge on this timeframe until supply drawn from 1333.1-1323.4.
Areas of consideration:
Aside from the long out of 1228.2, traders may receive a second opportunity to buy this market today should we form a H4 close above the current channel resistance. This clears the path way north to resistance at 1298.4 for a potential short-term long on a retest of the said channel (black arrows).
An added bonus would be H4 (or lower-timeframe action) price chalking up a bullish candlestick signal at the retest, consequently identifying buyer intent and also serving as a base to determine entry and risk levels.
The accuracy, completeness and timeliness of the information contained on this site cannot be guaranteed. IC Markets does not warranty, guarantee or make any representations, or assume any liability with regard to financial results based on the use of the information in the site.
News, views, opinions, recommendations and other information obtained from sources outside of www.icmarkets.com.au, used in this site are believed to be reliable, but we cannot guarantee their accuracy or completeness. All such information is subject to change at any time without notice. IC Markets assumes no responsibility for the content of any linked site. The fact that such links may exist does not indicate approval or endorsement of any material contained on any linked site.
IC Markets is not liable for any harm caused by the transmission, through accessing the services or information on this site, of a computer virus, or other computer code or programming device that might be used to access, delete, damage, disable, disrupt or otherwise impede in any manner, the operation of the site or of any user’s software, hardware, data or property.


