
Key risk events today:
MPC Member Saunders Speaks; Canada Employment Change and Unemployment Rate; US Average Hourly Earnings m/m, Non-Farm Employment Change and Unemployment Rate.
(Previous analysis as well as outside sources – italics).
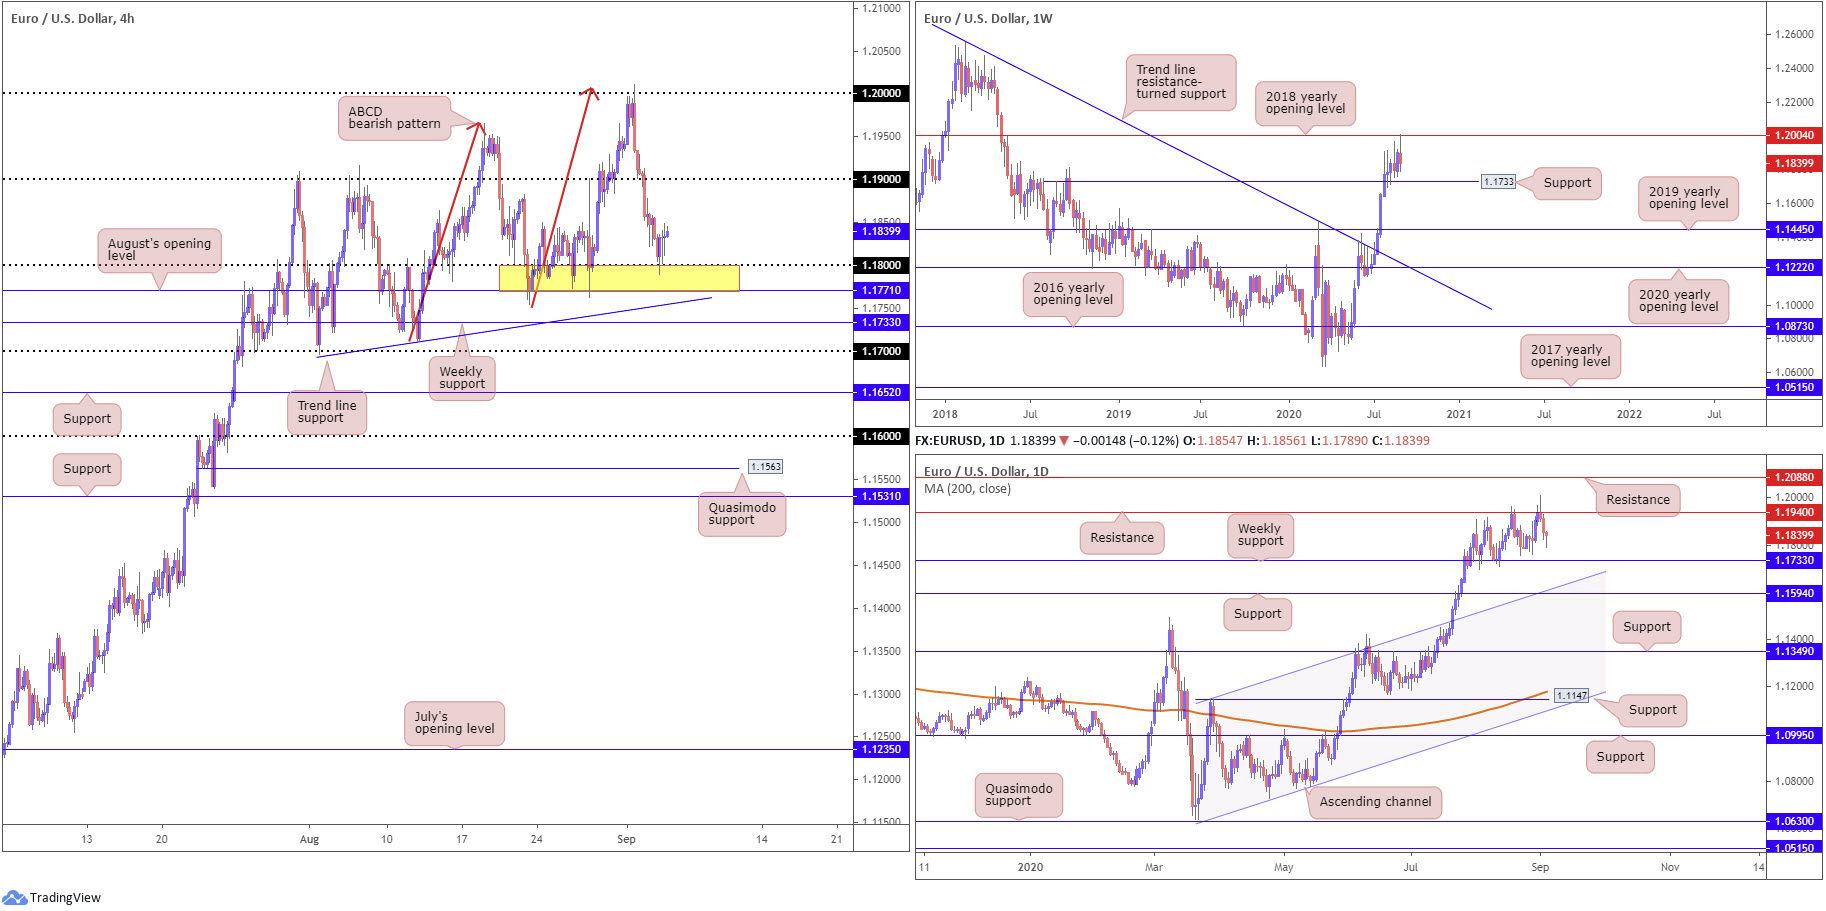
EUR/USD:
August’s opening level at 1.1771 and the 1.18 handle (yellow), a familiar area of support, swung back into view on the H4 timeframe Thursday, forcing price to close considerably off worst levels. Of late, we have seen EUR/USD forcibly decline more than 200 pips after shaking hands with the 1.20 region, bolstered by H4 ABCD confluence and weekly resistance at 1.2004 (2018 yearly opening level). Extending recovery gains off the current support area could lead to 1.19 making an appearance today, though turning lower has immediate trend line support, taken from the low 1.1695.
In terms of Thursday’s economic data, weekly US jobless claims dipped under the 1-million mark and August’s US ISM non-manufacturing surprised to the downside.
Further afield on the technical front, weekly price, as already underlined above, recently faded the 2018 yearly opening value at 1.2004, with support not expected to enter play until 1.1733, a prior Quasimodo resistance level. A similar picture is seen on the daily timeframe with respect to support, though daily price fades resistance set at 1.1940.
Areas of consideration:
Sellers short 1.20 (H4 ABCD) have likely liquidated a major portion of their position, yet some may continue holding due to the higher timeframe picture. Both the weekly and daily chart show price trading from resistance (1.2004/1.1940) and suggest we could pursue additional downside beyond 1.18, with room to decline as far south as weekly support at 1.1733. Therefore, although August’s opening level at 1.1771, along with trend line support, taken from the low 1.1695 on the H4, could attempt to hamper downside, additional bearish scenarios could still be upon us to 1.1733.
Further buying, however, could also take shape from 1.1771/1.18, boosted on the back of the current trend, facing higher since March, as well as weekly price engulfing trend line resistance, taken from the high 1.2555 on July 13.
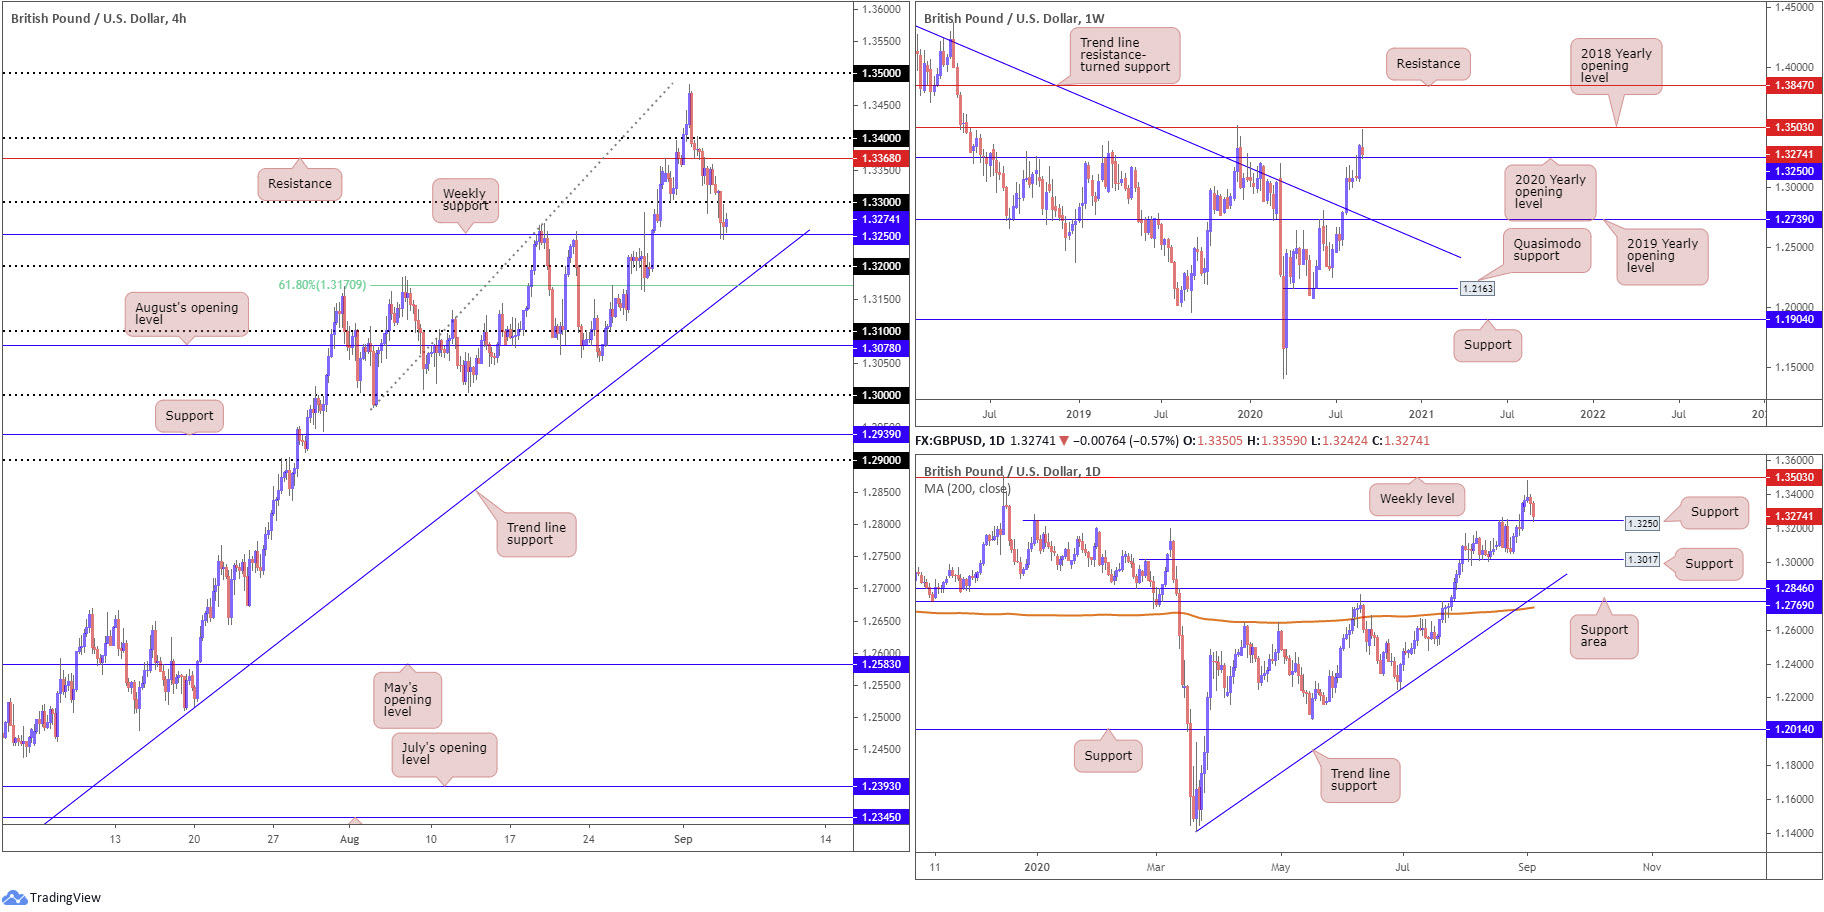
GBP/USD:
The British pound continued to soften against the US dollar Thursday, extending losses south of YTD pinnacles at 1.3483, following downgrades to the final UK services PMI. H4 failed to glean much impetus from 1.33 on the H4, unlocking downside to weekly support at 1.3250, the 2020 yearly opening level, which, for now, is holding.
Beyond the weekly level, 1.32 is a likely support on the H4 scale, along with strong trend line support, etched from the low 1.2257, and a 61.8% Fibonacci retracement ratio at 1.3170.
Areas of consideration:
While we are coming off weekly support at the moment (1.3250), which could have buyers take things higher from here (given the trend has faced north since late March), there is still a chance H4 could whipsaw through the weekly base to gather fresh buyers from trend line support (1.2257) and the 1.32 handle.
A H4 close above 1.33 today is likely to be interpreted as bullish strength off weekly support, and therefore may see a continuation to the upside as a result. Dropping south of 1.3250 and testing H4 trend line support, nevertheless, is likely to have traders watch price action closely for signs of exhaustion. A H4 bullish candlestick signal formed from the trend line, for example, would likely be a welcomed sight from buyers.
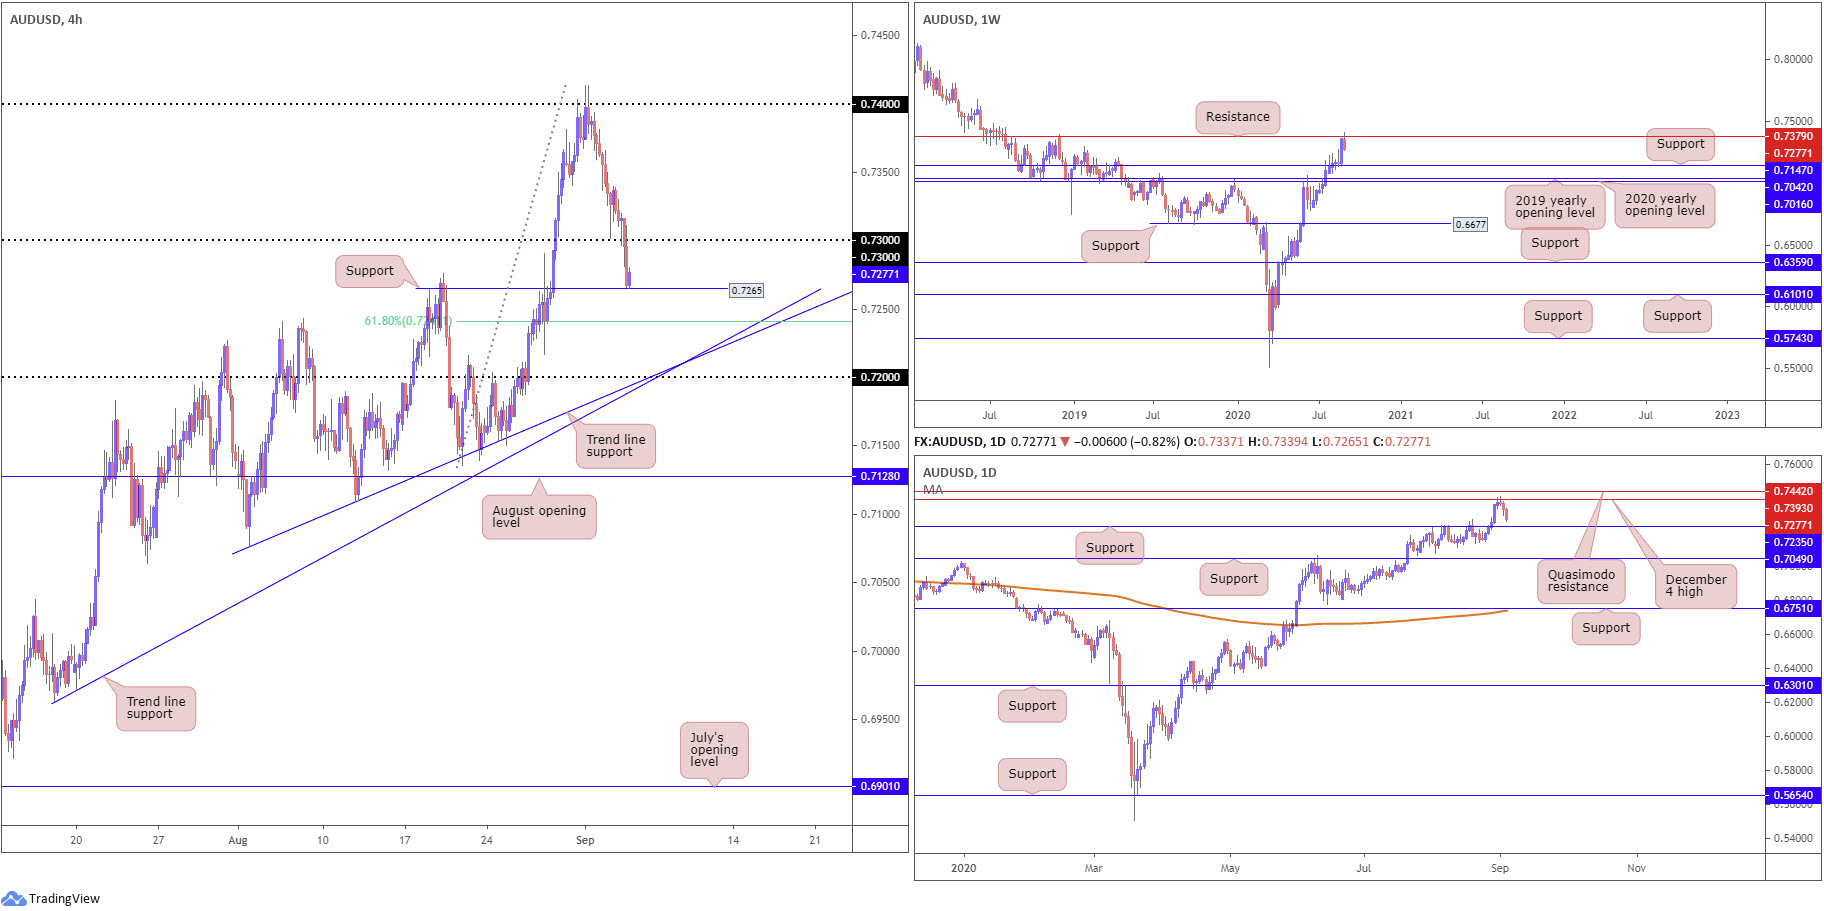
AUD/USD:
Although the US dollar index fades session peaks north of 93.00, drawing the current daily candle considerably off best levels, AUD/USD remains depressed south of YTD peaks at 0.7413. Recent activity burrowed through 0.73 on the H4 and crossed swords with support at 0.7265 (prior Quasimodo resistance). The current level invites an approach back to 0.73 resistance. Should sellers strengthen their position, the 61.8% Fibonacci retracement ratio at 0.7241 is in the firing range as possible support, followed by two trend line supports, taken from lows 0.6963 and 0.7076, and the round number 0.72.
Further out, longer-term activity is seen gathering traction from resistance at 0.7379 on the weekly timeframe. By the same token, daily movement recently faded the 0.7393 December 4 high. With reference to prospective support, the daily timeframe presents structure at 0.7235, a prior Quasimodo resistance level, with a break exposing weekly support at 0.7147.
It might also interest some traders to note the trend in this market has faced a northerly trajectory since bottoming mid-March.
Areas of consideration:
The fact we’re starting to establish some presence off higher timeframe resistances right now, with room seen to move lower until daily support from 0.7235 makes a show, upside attempts off 0.7265 on the H4 are likely to be capped by the 0.73 handle. As such, 0.73 could serve as a platform of resistance today, for those seeking bearish themes towards 0.7235.
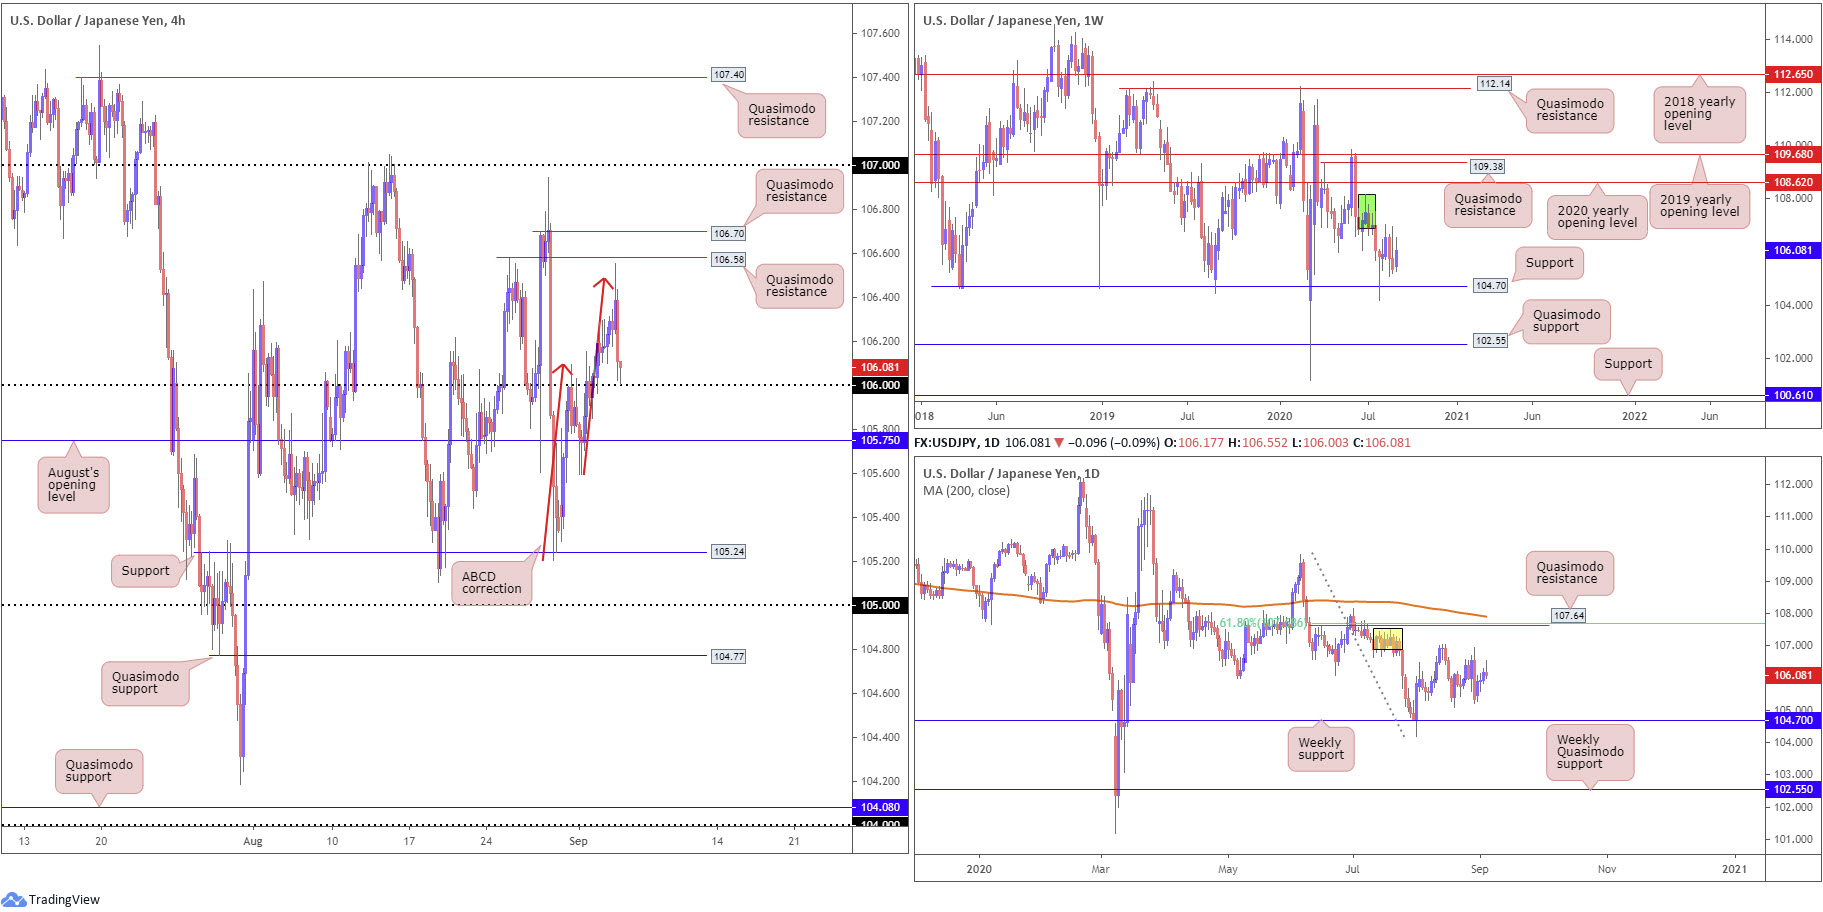
USD/JPY:
The decisive shift in market sentiment, reflected by a heavy sell-off in major US equity benchmarks, increased demand for the safe-haven Japanese yen on Thursday, consequently sending USD/JPY back to 106. We can also see additional selling pressure likely came about on the back of an ABCD bearish pattern (red arrows) at 106.48, ahead of H4 Quasimodo resistance at 106.58. 106, as you can see, is holding as support at the time of writing.
Supply remains prominent on the weekly timeframe at 108.16-106.88 (dark green) after price made its way off support at 104.70 at the end of July. Should buyers hold onto recent upside, the 2020 yearly opening level at 108.62 may eventually enter view, closely followed by Quasimodo resistance at 109.38.
From the daily timeframe, supply at 107.55/106.89 (yellow), an area housed within the lower boundary of weekly supply mentioned above at 108.16-106.88, is also proving a tough nut to crack, with further downside to also potentially target the weekly support underlined above at 104.70. In the event buyers make a comeback, Quasimodo resistance at 107.64 might enter play, reinforced by a 61.8% Fibonacci retracement ratio at 107.68 and the 200-day SMA (orange – 107.90).
Areas of consideration:
An extension off 106 support could emerge today, though this level lacks confluence both locally and from the higher timeframes.
A dip to August’s opening level on the H4 at 105.75 could also be seen. Again, however, this level lacks confluence locally and on the higher timeframes.
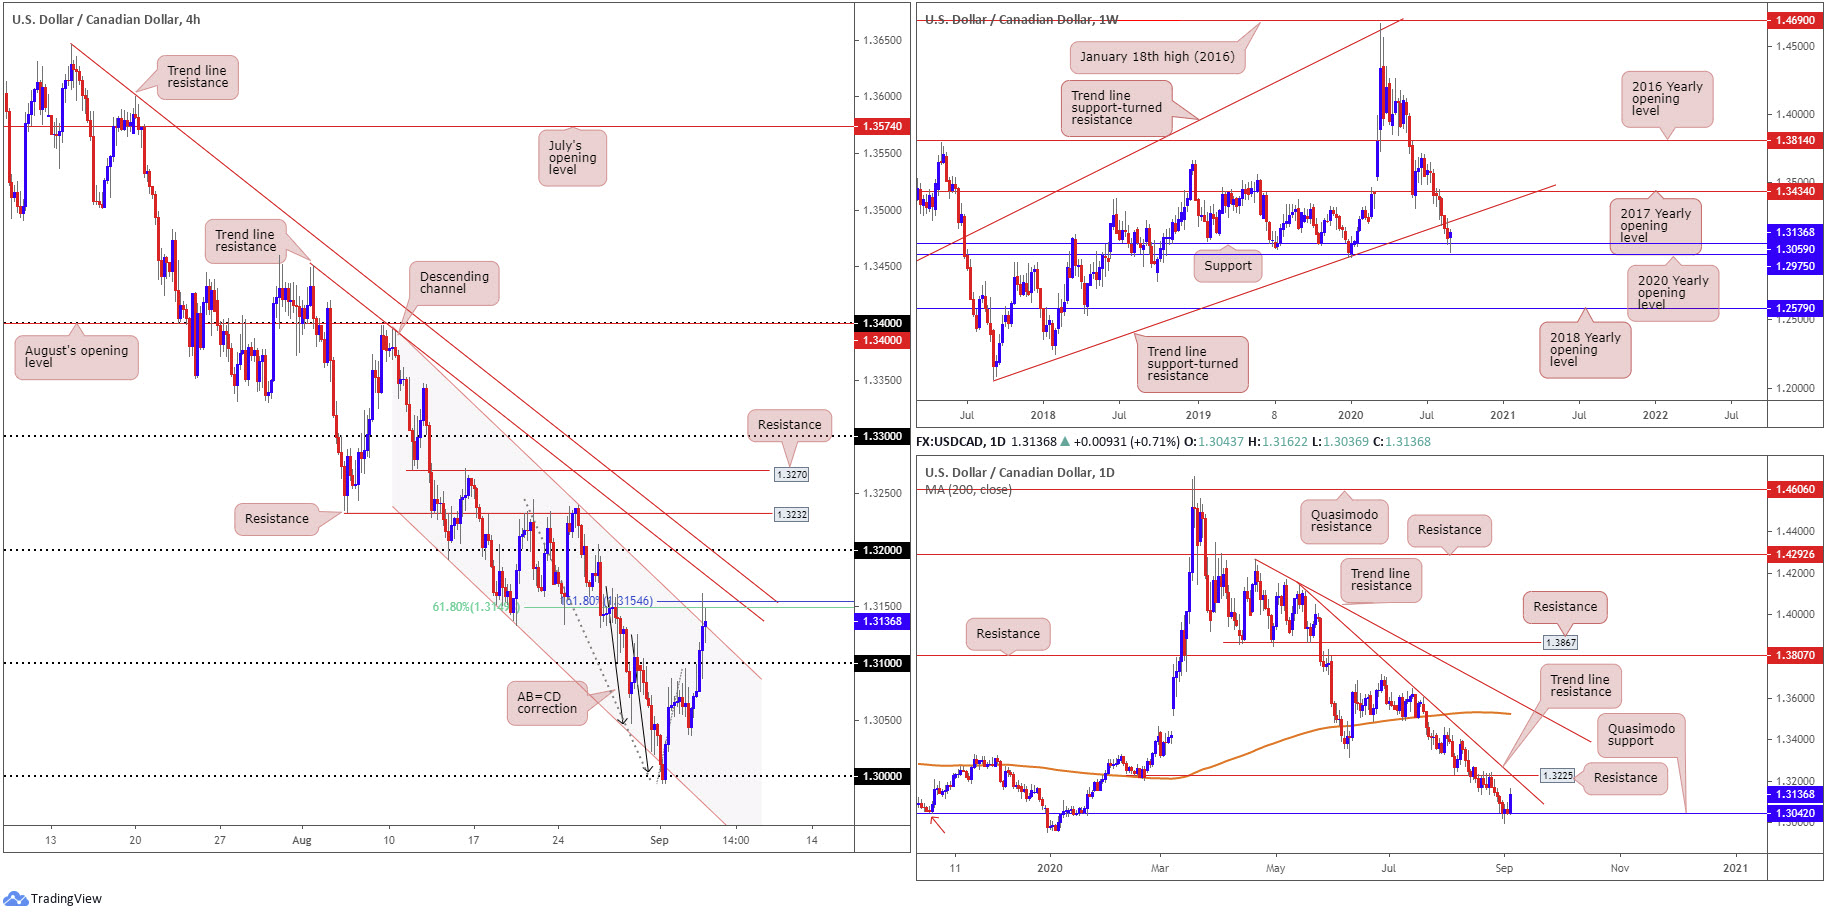
USD/CAD:
Based on the following structure, underlined earlier in the week, we have seen a notable recovery take shape:
- Daily Quasimodo support (with its pattern low set at 1.2951) at 1.3042.
- H4 channel support, extended from the low 1.3133.
- H4 AB=CD correction (black arrows) at 1.3004.
- 30 key figure.
- Weekly support at 1.3059.
- Weekly support seen at 1.2975 (the 2020 yearly opening level).
Despite some hesitation on Wednesday, USD/CAD latched onto a healthy bid Thursday, a move that overthrew 1.31 on the H4 to the upside and connected with channel resistance, taken from the high 1.3394, and a 161.8% Fibonacci extension point at 1.3154, as well as a 61.8% Fibonacci retracement ratio at 1.3149. This, coupled with two nearby trend line resistances from 1.3646 and 1.3451, delivers reasonably strong resistance to contend with today.
Areas of consideration:
Those long 1.30 have already likely reduced risk to breakeven, with many also potentially banking additional profits at current channel/Fibonacci resistance on the H4. Ultimately, though, we could see USD/CAD eventually push beyond 1.32 to tackle H4 resistance at 1.3232, given this level boasts a close connection with daily resistance at 1.3225 (a prior Quasimodo support). This daily level marks the next upside target on the higher timeframes off the aforementioned weekly and daily supports, underlined above in bold.
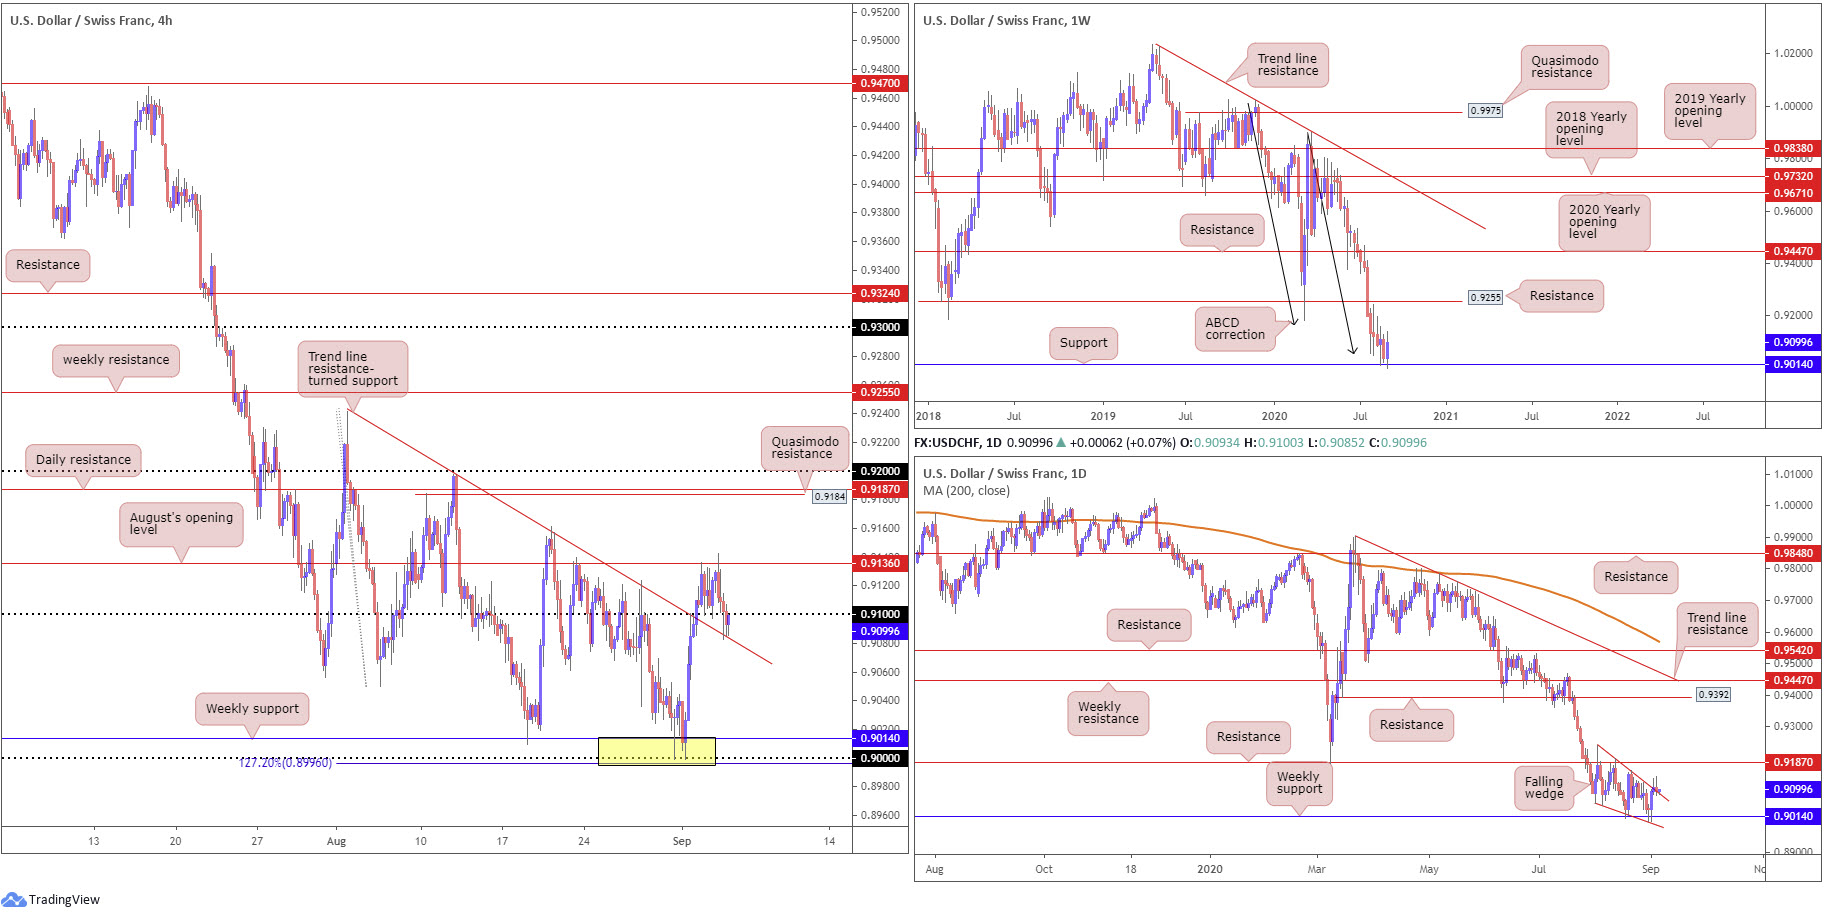
USD/CHF:
Similar to Wednesday, USD/CHF concluded Thursday off best levels, hampered by August’s opening level on the H4 timeframe at 0.9136. 0.91 recently came under fire, as price filled sell-stop liquidity south of the angle and tested trend line resistance-turned support, taken from the high 0.9241. So far, buyers have managed to maintain a presence off the trend line, potentially bolstered on the fact the trend line also happens to represent the upper boundary of a recently penetrated falling wedge pattern on the daily timeframe, pencilled in from the high 0.9241 and a low of 0.9056.
Assuming buyers off the said trend line support absorb breakout selling pressure under 0.91, price is likely to revisit August’s opening level mentioned above at 0.9136. Reclaiming the latter could see H4 Quasimodo resistance at 0.9184 take position, closely followed by daily resistance at 0.9187.
Weekly support also remains prominent structure at 0.9014, bolstered by ABCD support at 0.9051 (black arrows).
Areas of consideration:
A H4 close back above 0.91 today could have intraday buyers take up position, given we’re retesting a daily falling wedge upper limit. Overthrowing 0.9136 on the H4 would also likely have conservative buyers join movement, targeting daily resistance underscored above at 0.9187.
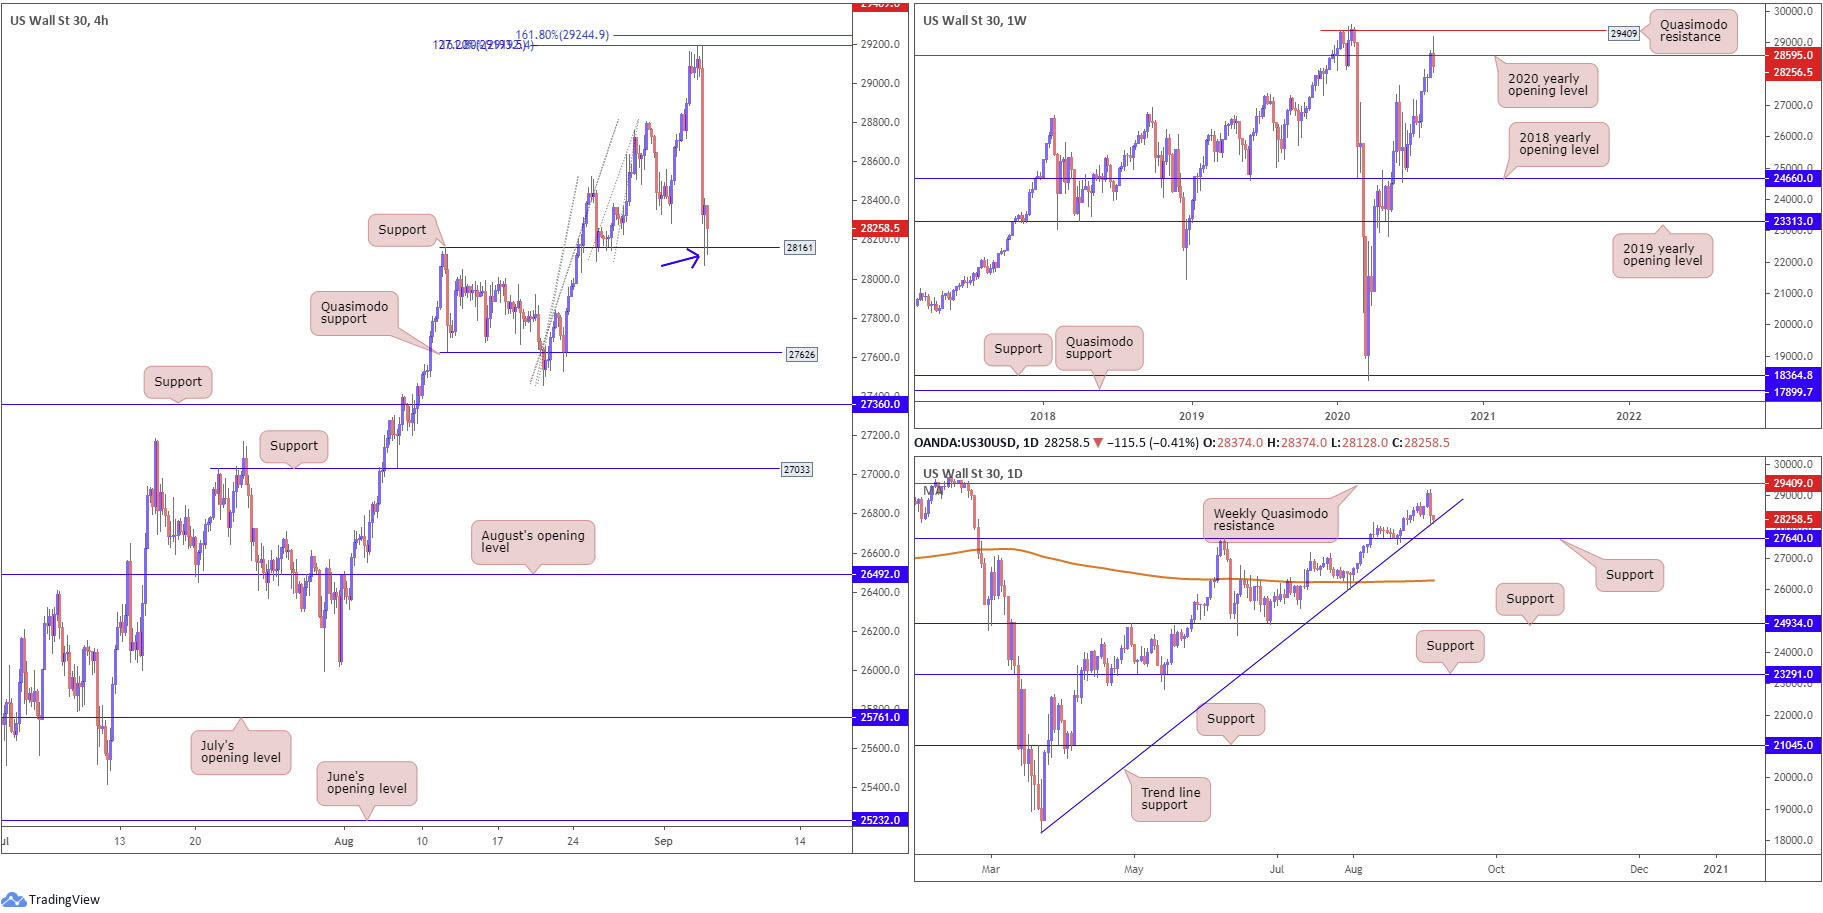
Dow Jones Industrial Average:
US equities plunged Thursday amid declines in technology stocks, including Apple dipping 8 percent, its largest one-day fall since March. The Dow Jones Industrial Average declined 807.77 points, or 2.78%; the S&P 500 fell 125.78 points, or 3.51% and the tech-heavy Nasdaq 100 traded lower by 649.18 points, or 5.23%.
On the technical front, weekly price snapped back beneath its 2018 opening value at 28595, after coming within striking distance of clipping Quasimodo resistance plotted at 29409. Daily price, on the other hand, is seen challenging trend line support, taken from the low 18213, with a violation here drawing focus to support coming in at 27640.
Across the page on the H4 timeframe, Thursday found resistance from a Fibonacci extension cluster around the 29200 point, consisting of 127.2% and 161.8% Fibonacci extension levels. This landed candle action back at support drawn from 28161. Should buyers continue defending this region, a recovery phase back to recent highs could be seen, yet drilling through current support throws Quasimodo support at 27626 into the mix.
Areas of consideration:
Daily trend line support recently entering the set, an ascending base that converges with H4 support mentioned above 28161, could be enough to prompt recovery gains today. We also recently spotted a half-hearted hammer candle formation (blue arrow), though has yet to generate much follow-through buying.
Breaking H4 support at 28161, nonetheless, could ignite bearish themes to daily support at 27640, plotted just north of H4 Quasimodo support at 27626.
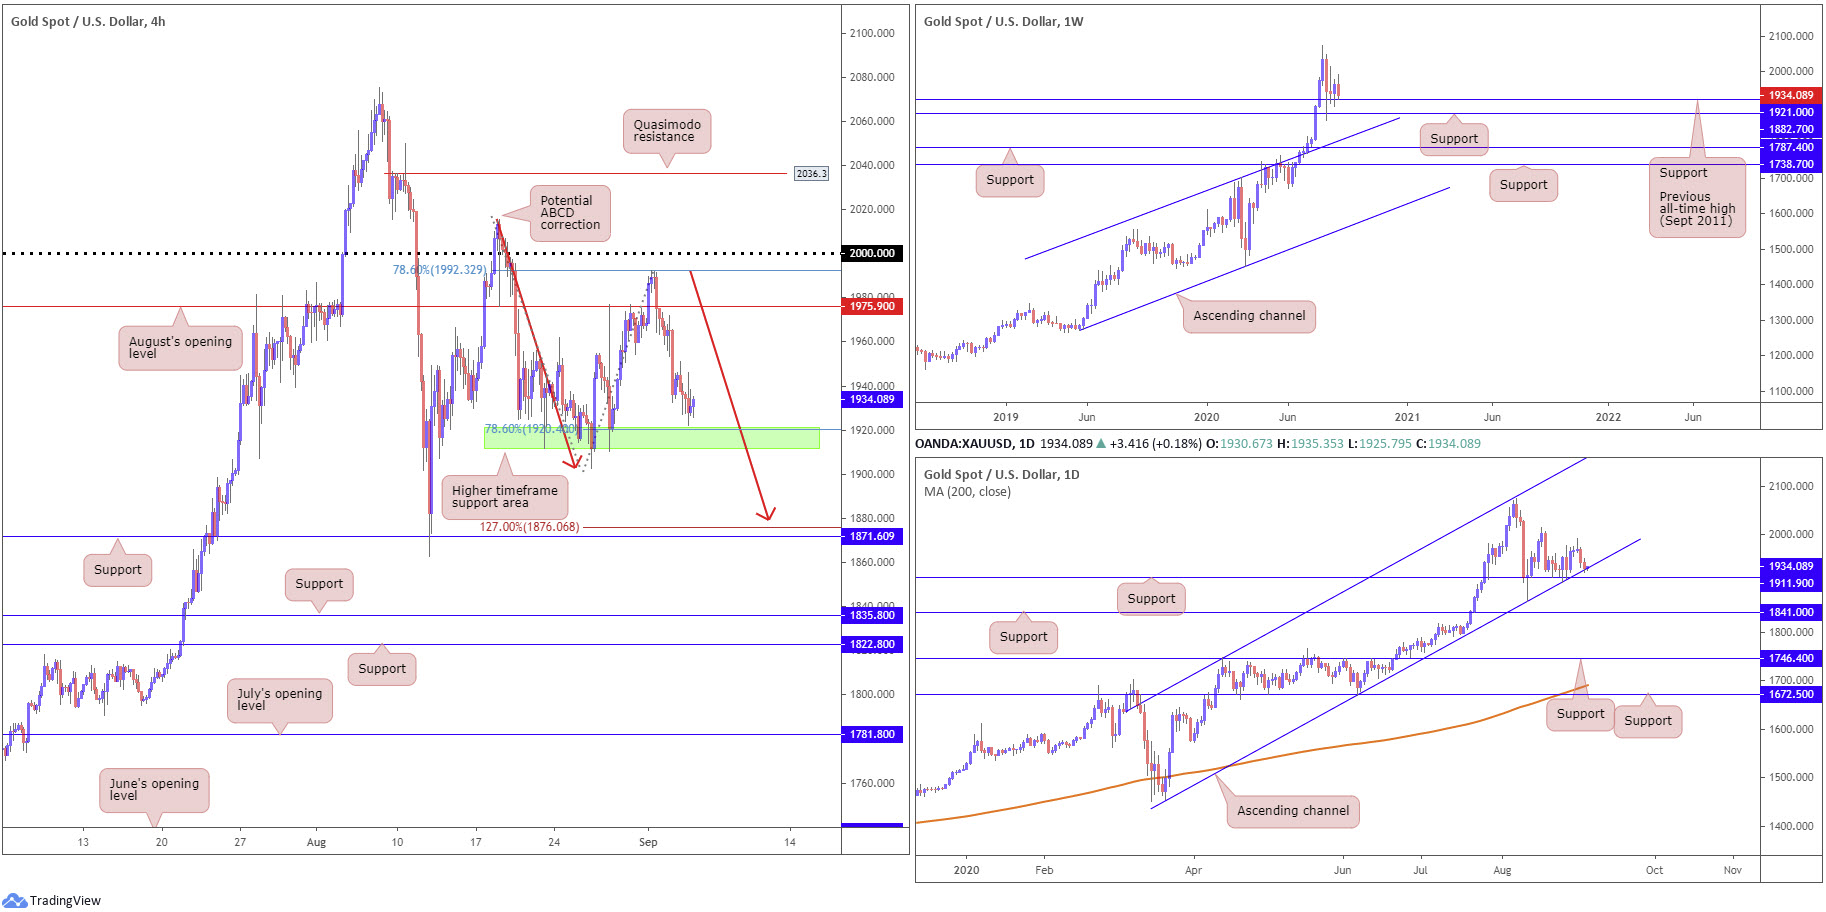
XAU/USD (GOLD):
Bullion marginally extended losses against the greenback Thursday, guiding daily price to channel support, extended from the low $1,455.32, a configuration that begun forming in March.
This has H4 action hovering just north of higher timeframe supports at $1,911.90-$1,921.00 (green – daily and weekly [previous all-time peak from Sept 2011] supports).
Another price action alternative on the H4 timeframe, assuming we overrun higher timeframe supports, is a potential ABCD correction (red arrows) at $1,879.94, with a BC projection standing at (1.27) $1,876.06 (given leg C terminated at 78.6%) ahead of H4 support coming in at $1,871.60.
Areas of consideration:
Overall, this remains a buyers’ market, according to the current trend – higher since bottoming in 2016.
Traders will be watching price action closely at channel support on the daily timeframe today. A H4 bullish candlestick formation printed from this region, for example, may draw in buyers. The same can be said if we cross paths with the $1,911.90-$1,921.00 higher timeframe support area, based on the H4 scale (green).
The accuracy, completeness and timeliness of the information contained on this site cannot be guaranteed. IC Markets does not warranty, guarantee or make any representations, or assume any liability regarding financial results based on the use of the information in the site.
News, views, opinions, recommendations and other information obtained from sources outside of www.icmarkets.com.au, used in this site are believed to be reliable, but we cannot guarantee their accuracy or completeness. All such information is subject to change at any time without notice. IC Markets assumes no responsibility for the content of any linked site.
The fact that such links may exist does not indicate approval or endorsement of any material contained on any linked site. IC Markets is not liable for any harm caused by the transmission, through accessing the services or information on this site, of a computer virus, or other computer code or programming device that might be used to access, delete, damage, disable, disrupt or otherwise impede in any manner, the operation of the site or of any user’s software, hardware, data or property.


