
Key risk events today:
Australia Retail Sales m/m; RBA Financial Stability Review; RBA Assist Gov Ellis Speaks; Canada Trade Balance; US Average Hourly Earnings m/m; US Non-Farm Employment Change; US Unemployment Rate; FOMC Member Rosengren Speaks; Fed Chair Powell Speaks.
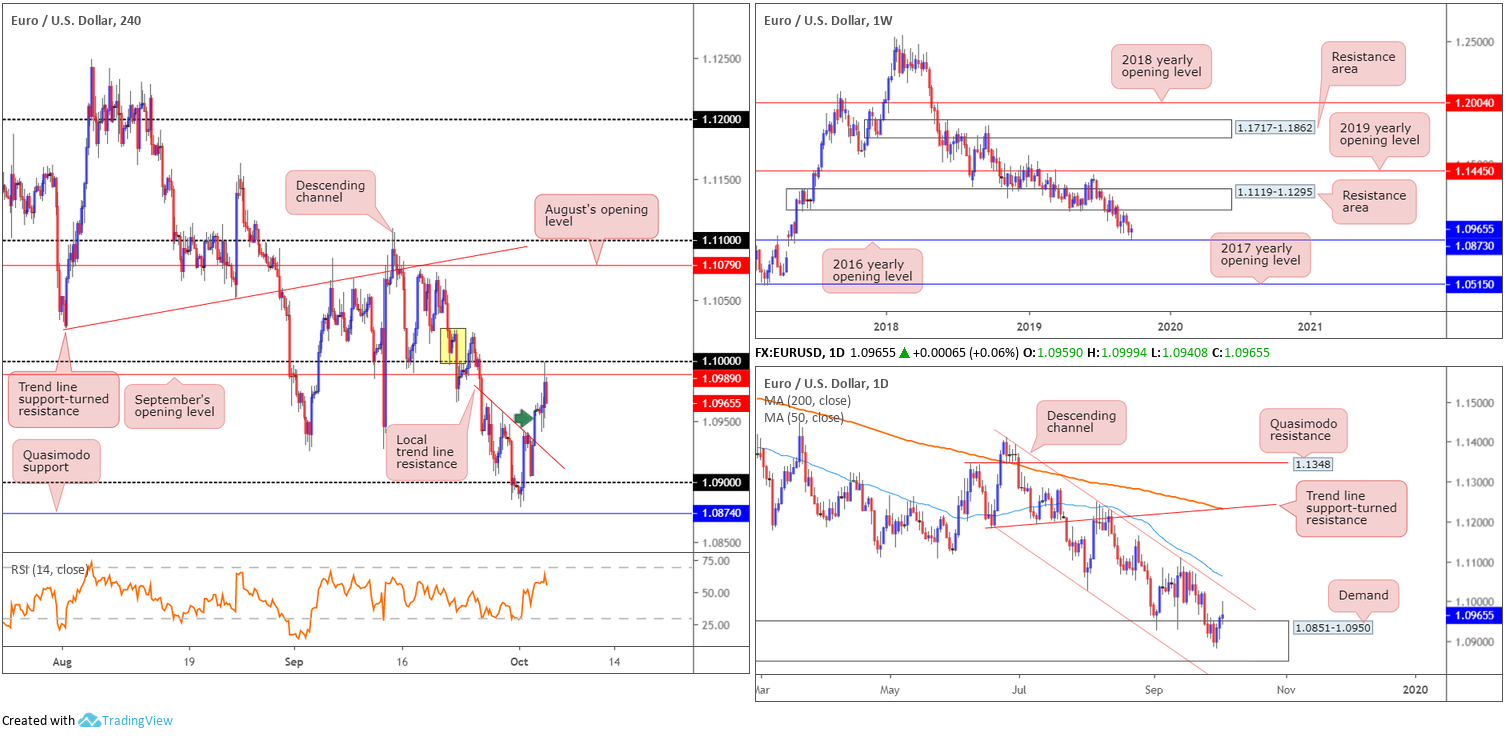
EUR/USD:
In wake of another downhearted US ISM survey – services headline missed consensus albeit holding above the 50 break-even line unlike the more contractionary manufacturing reading earlier in the week – the buck recorded its third successive loss Thursday, consequently underpinning the EUR/USD.
Traders who read Thursday’s technical briefing may recall the following pieces:
Noting weekly price rebounding higher just ahead of support at 1.0873, and daily price finding its feet within demand at 1.0851-1.0950, buyers appear to be gathering steam. The local H4 trend line resistance on the H4 timeframe (extended from the high 1.0967) recently gave way and has, at least from a technical standpoint, potentially confirmed upside back to at least September’s opening level at 1.0989, closely shadowed by the key figure 1.10.
Entry at current price (off the breakout candle – green arrow) is certainly an option (protective stop-loss orders plotted below the H4 breakout candle’s lower shadow), or, for the more conservative trader, waiting for a retest motion to take shape may be an idea (entry/risk parameters can be determined according to the rejection candle’s structure).
As evident from recent movement, the unit built on Wednesday’s gains and rallied to 1.10 on Thursday. Well done to any readers who managed to jump aboard this move. Price struck 1.10 to the point, and has begun retreating southbound, likely aided by H4 supply (yellow) at 1.1025/1.0996.
Areas of consideration:
Entering long at this point is problematic until the H4 candles decisively engulf 1.10 to the upside. Should this occur, a run to August’s opening level at 1.1079 may be on the cards. Before reaching this far north, though, traders are urged to pencil in channel resistance seen on the daily timeframe (1.1412), closely followed by the 50-day SMA (blue – 1.1063).
Selling the momentum derived off 1.10 is likely on the minds of some traders this morning, though given we’re coming off weekly support and out of daily demand, this is a tricky short.
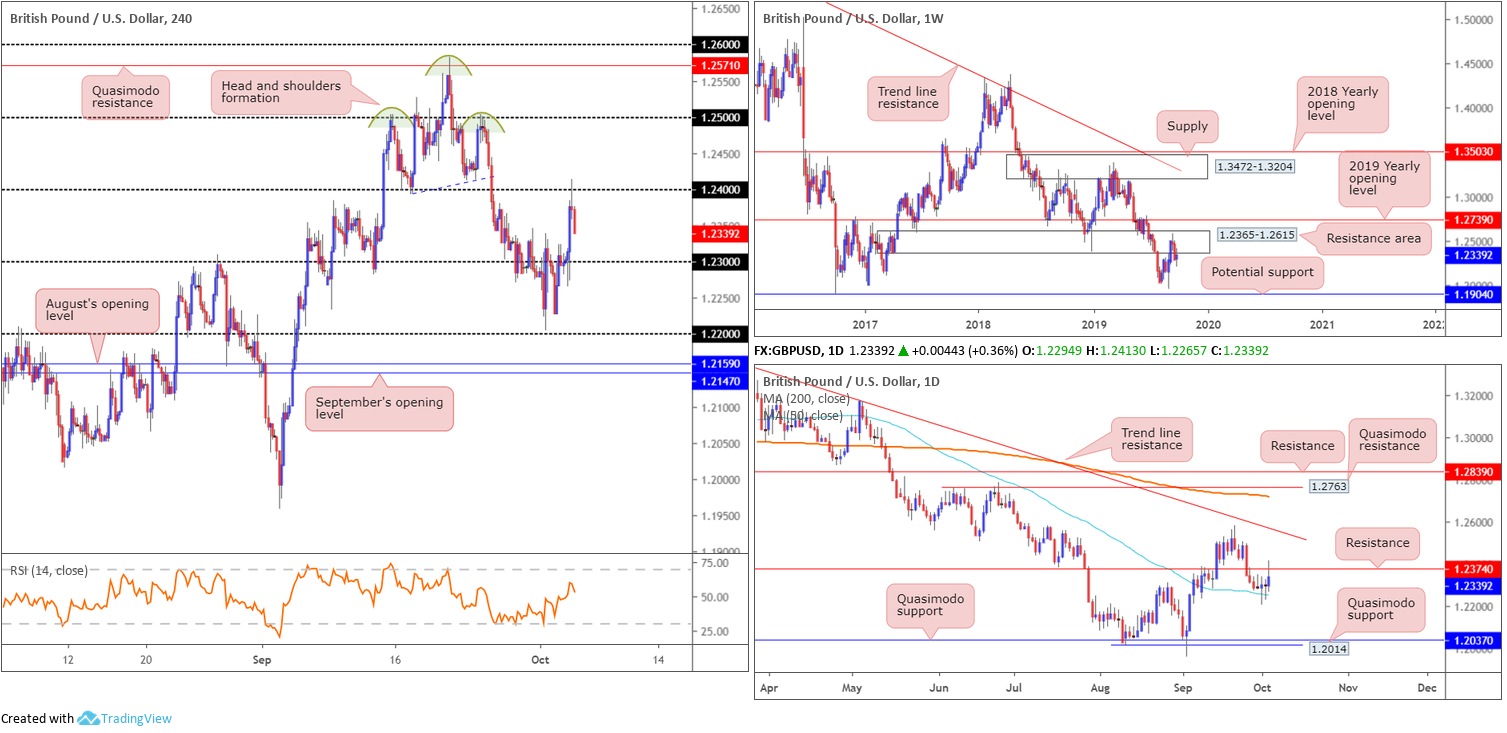
GBP/USD:
Renewed Brexit optimism as well as a waning buck provided a healthy boost to the British pound Thursday, clocking session highs at 1.2413 and running stops above the 1.24 handle on the H4 timeframe. On the data front, the latest IHS Markit / CIPS PMI data for the UK service sector signalled a contraction in activity in September, with the business activity index falling to 49.5, from 50.6 in August.
Despite the strong run higher yesterday – which not only likely tripped sellers’ stop-loss orders, but also drew in breakout buyers’ orders, too – recent movement is exploring lower ground, tunnelling through 1.2350 in the last hour. Technically, downside is weighed by a weekly resistance area at 1.2365-1.2615 and daily resistance coming in at 1.2374. This could lead to a revisit of 1.23 on the H4 scale, or possibly even a retest of the 50-day SMA (blue – 1.2249) on the daily scale.
Areas of consideration:
From a technical perspective, the charts continue to reflect a bearish vibe. However, it appears the only way to take advantage of this move is to either sell at current price with limited resistance to plot stop-loss orders behind, or drill down to the lower timeframes and attempt to find a short entry there, with 1.23 set as the immediate take-profit target.
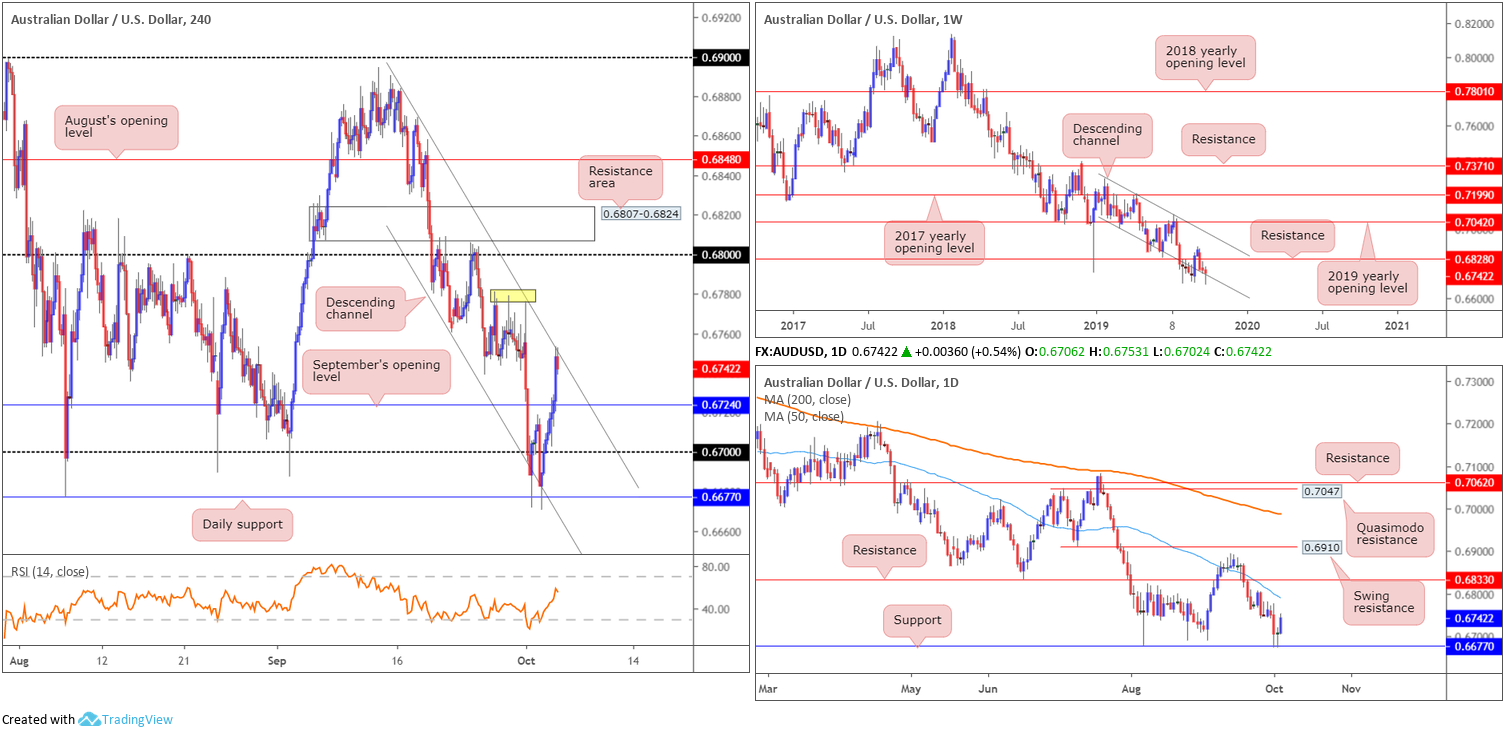
AUD/USD:
Downbeat US ISM non-manufacturing PMI data weighed considerably on the greenback Thursday, consequently propelling the commodity-linked Australian dollar to higher ground for a second consecutive session. Adding more than half-a-percent on the day, technical research on the weekly timeframe has the current candle attempting to take hold of its channel support (taken from the low 0.7003), which if successful may lead to a move towards resistance at 0.6828.
A closer interpretation of price action on the daily timeframe reveals support at 0.6677 remains in the fold, with nearby resistance in the form of a 50-day SMA (blue – 0.6789). Recent bidding on the H4 scale saw September’s opening level at 0.6724 give way and channel resistance (extended from the high 0.6883) make an appearance. Further upside here likely brings in tops around 0.6778 (yellow), followed by a possible approach to 0.68.
Although the trend remains pointing in a southerly direction since early 2018, the market appears to be attempting to recover somewhat – clearer on the daily timeframe off support at 0.6677.
Areas of consideration:
A decisive H4 close beyond the noted channel resistance possibly confirms further upside might be in store. And with both weekly and daily structure emphasising a somewhat bullish notion, the H4 candles could reach 0.68.
Entry on the close of the H4 breakout candle is an idea, with a protective stop-loss order beneath its lower shadow. Alternatively, a retest motion could be an option, basing entry and risk levels on the back of the rejecting candle’s structure. Irrespective of the entry method, traders are urged to consider risk/reward before pulling the trigger, ensuring at least a 1:2 ratio exists.
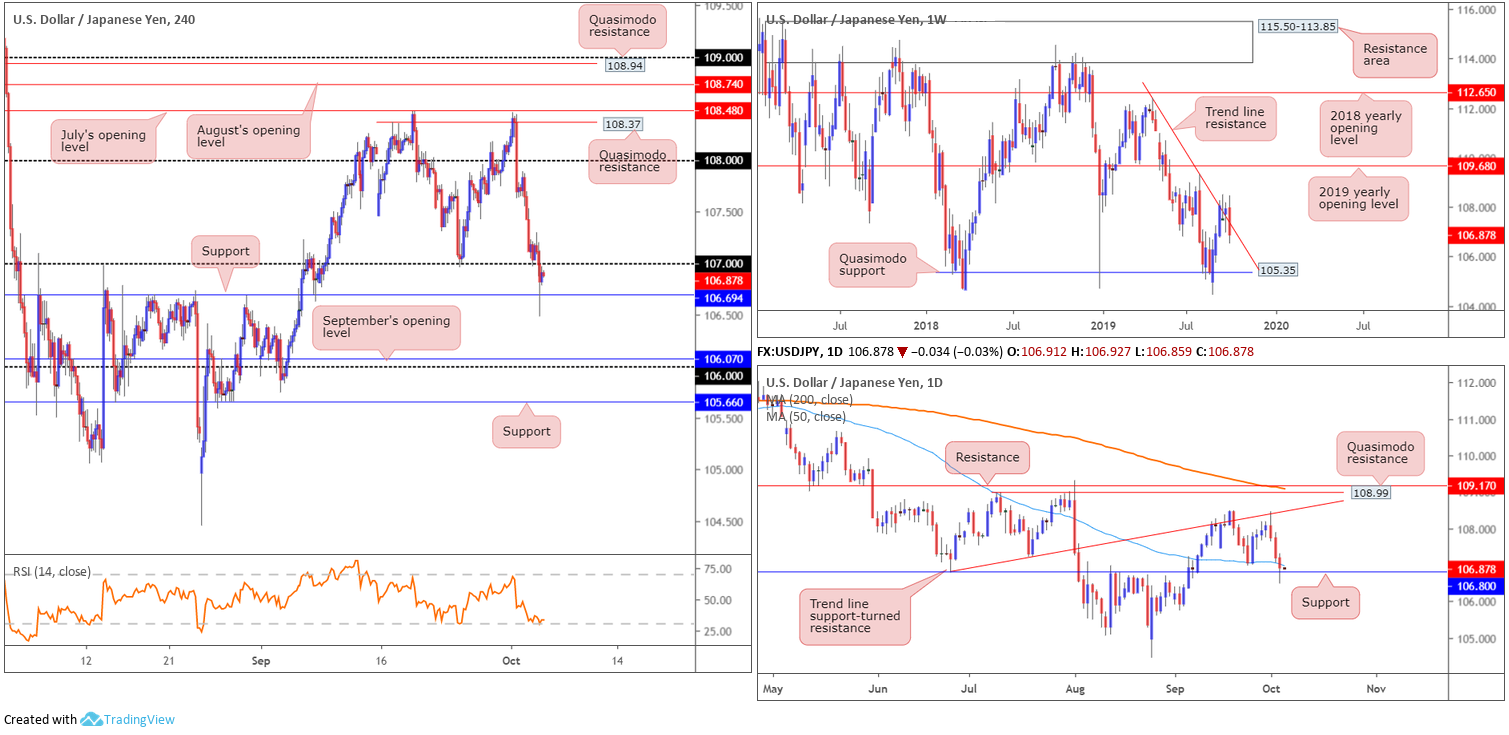
USD/JPY:
Less-than-stellar US ISM non-manufacturing PMI data ramped up demand for the safe-haven Japanese yen Thursday, pulling the USD/JPY through 107 to H4 support located at 106.69. Recent selling also drew daily support at 106.80 into the mix yesterday, marginally closing south of the 50-day SMA (blue – 106.98). The story on the weekly timeframe has seen the pair climb back beneath its trend line resistance (taken from the high 112.40), set to potentially finish the week in the shape of a bearish outside formation. Continued selling from this point has Quasimodo support at 105.35 to target.
Traders who read Thursday’s technical briefing may recall the following:
Many traders have eyes on a long from 107 this morning. Logically, it resembles stable support, having seen it hold price higher last week as well as aligning with the 50-day SMA at 107.01. While the level may well hold for a second time, the possibility of a fakeout through 107 to H4 support at 106.69 is certainly there, as the level boasts a connection to daily support at 106.80. In addition, the monumental number of stop-loss orders (sell orders) contained below 107 (psychological numbers commonly suffer stop runs) provides liquidity to buy the said H4 support.
An ideal scenario, particularly for the more conservative trader, is to wait for H4 price to fake 107, test 106.69 and close back above 107. The breakout back through 107 can be considered a strong bullish indicator and a possible entry point, with protective stop-loss orders plotted beneath 106.69.
While a run through stops at 107 has taken shape, with a test of H4 support materialising, a close back above 107 has yet to come to fruition.
Areas of consideration:
The H4 close back above 107 is required due to weekly price climbing back beneath trend line resistance. In the event the market reclaims 107, a reasonably clear run back to 108 is visible.
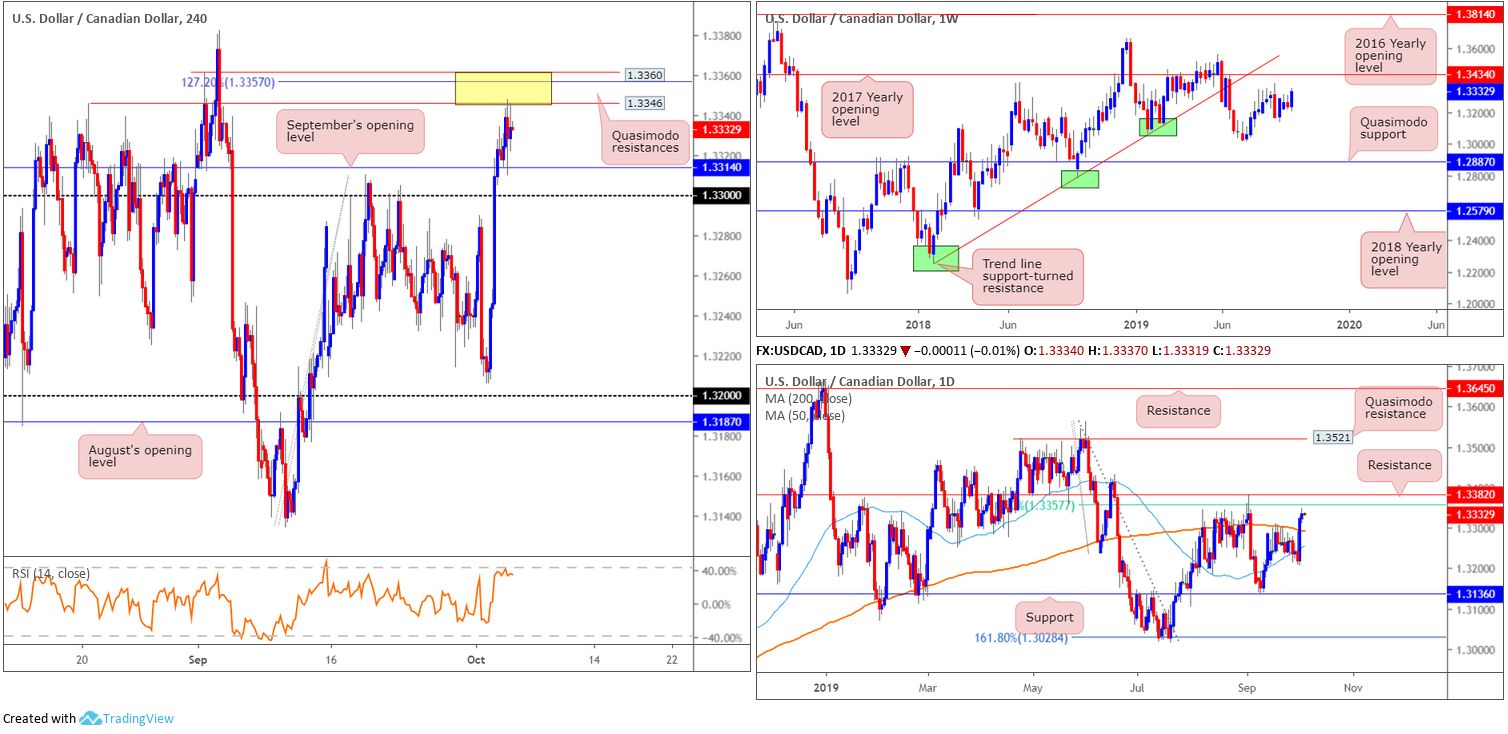
USD/CAD:
Thursday had the US dollar a shade higher against the Canadian dollar, clocking fresh monthly peaks at 1.3347. Crude benchmarks also extended losses going into the US session, with a weakening US ISM non-manufacturing providing no reprieve.
Chart studies on the H4 timeframe this morning show the candles crossed swords with an interesting area of resistance comprised of two layers of Quasimodo resistance 1.3360/1.3346 (yellow). Additionally, the 127.2% Fibonacci extension point is seen within at 1.3357 as is a 61.8% daily Fibonacci ratio at 1.3357. Before reaching this area, the pair retested September’s opening level at 1.3314 (a noted move to watch for in Thursday’s briefing), so well done to any readers who managed to spot this setup.
Sellers clearly have interest in 1.3360/1.3346, though are struggling to overthrow 1.3314. Also worth keeping in mind, though, is the possibility of a fakeout to daily resistance at 1.3382.
Areas of consideration:
As of now, movement is somewhat limited. H4 action is confined to 1.3360/1.3346 and September’s opening level at 1.3314, and daily flow has nearby resistance plotted at 1.3382 and 1.3357 and support in the form of a 200-day SMA (orange – 1.3292). It is only weekly price exhibiting room to move as far north as the 2017 yearly opening level at 1.3434.
Most medium-term traders would likely be interested in buying this market beyond daily resistance at 1.3382, though may request tight stops in case of price halting at the weekly resistance mentioned above at 1.3434.
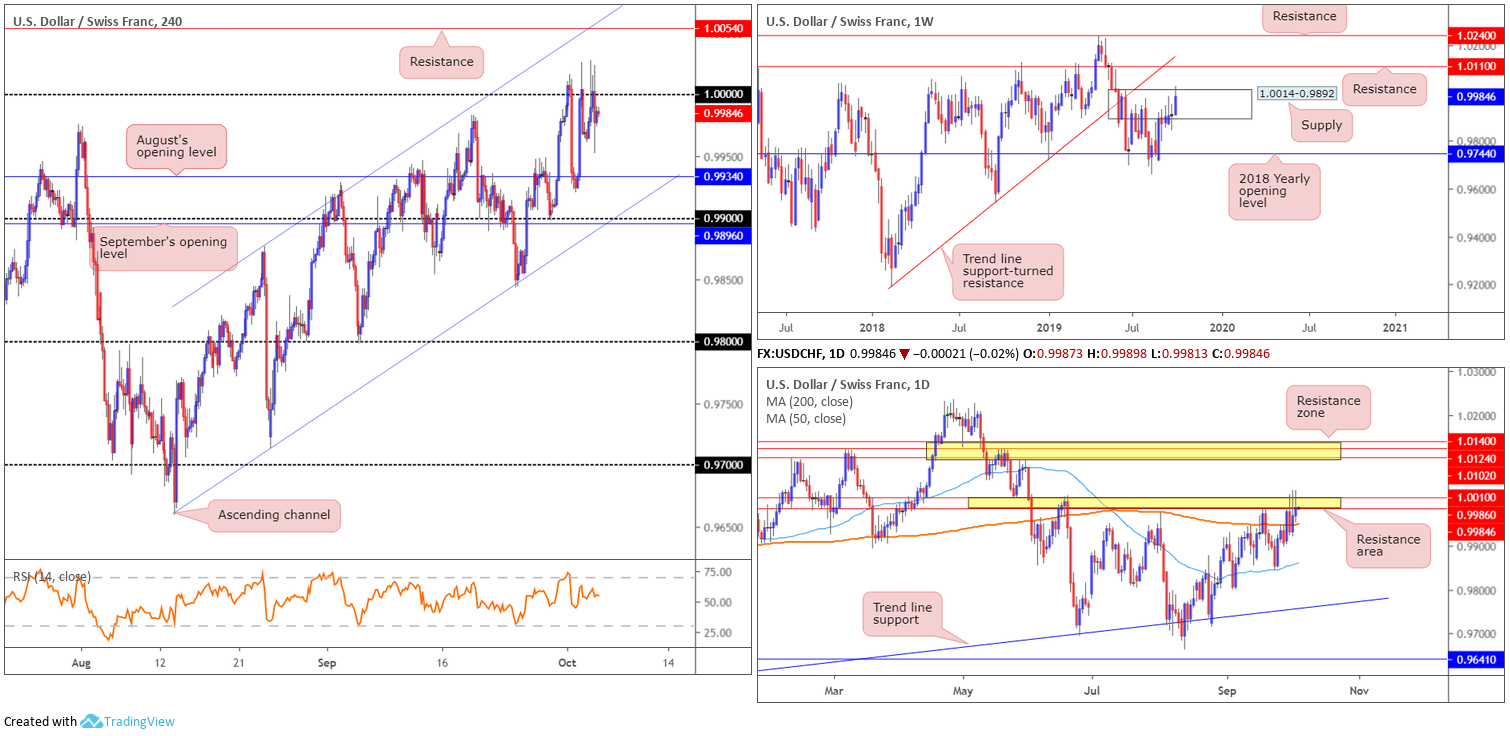
USD/CHF:
Buyers failed to sustain gains above the critical 1.0000 (parity) threshold Thursday, despite buy stops above the number likely filling. Above 1.0000, buyers have channel resistance (pencilled in from the high 0.9877) to contend with as well as resistance coming in at 1.0054, whereas familiar support in the mould of August’s opening level at 0.9934 is seen south of price.
We also have weekly price challenging the upper perimeter of supply at 1.0014-0.9892. While the recent move to multi-month peaks at 1.0026 possibly tripped some buy stops, there is clearly still some prevailing interest here from the sell side of the market. In the event of a push higher, traders are urged to note resistance coming in at 1.0110.
A closer reading of price action on the daily timeframe has the candles defending the underside of a narrow resistance zone at 1.0010/0.9986. Price action remains sited just north of the 200-day SMA (orange – 0.9949). Given the recent moves higher are reasonably considerable in comparison to the said resistance area, buyers appear to have the upper hand and could eventually mount an advance to the next resistance zone at 1.0140/1.0102.
Areas of consideration:
Outlook unchanged.
Selling pressure from 1.0000 has thus far been relatively feeble, halting at nearby support from 0.9934 and more recently failing to drive beyond 0.9960s. This – coupled with three conspicuous daily spikes through daily resistance at 1.0010/0.9986 (likely tripping stops) and weekly sellers lacking within supply at 1.0014-0.9892, buyers may have an edge here.
Ultimately, though, waiting for H4 price to reclaim 1.0000 before pulling the buy trigger might be a safe option, targeting the H4 resistance mentioned above at 1.0054 and channel resistance (0.9877) as the initial upside take-profit zones.
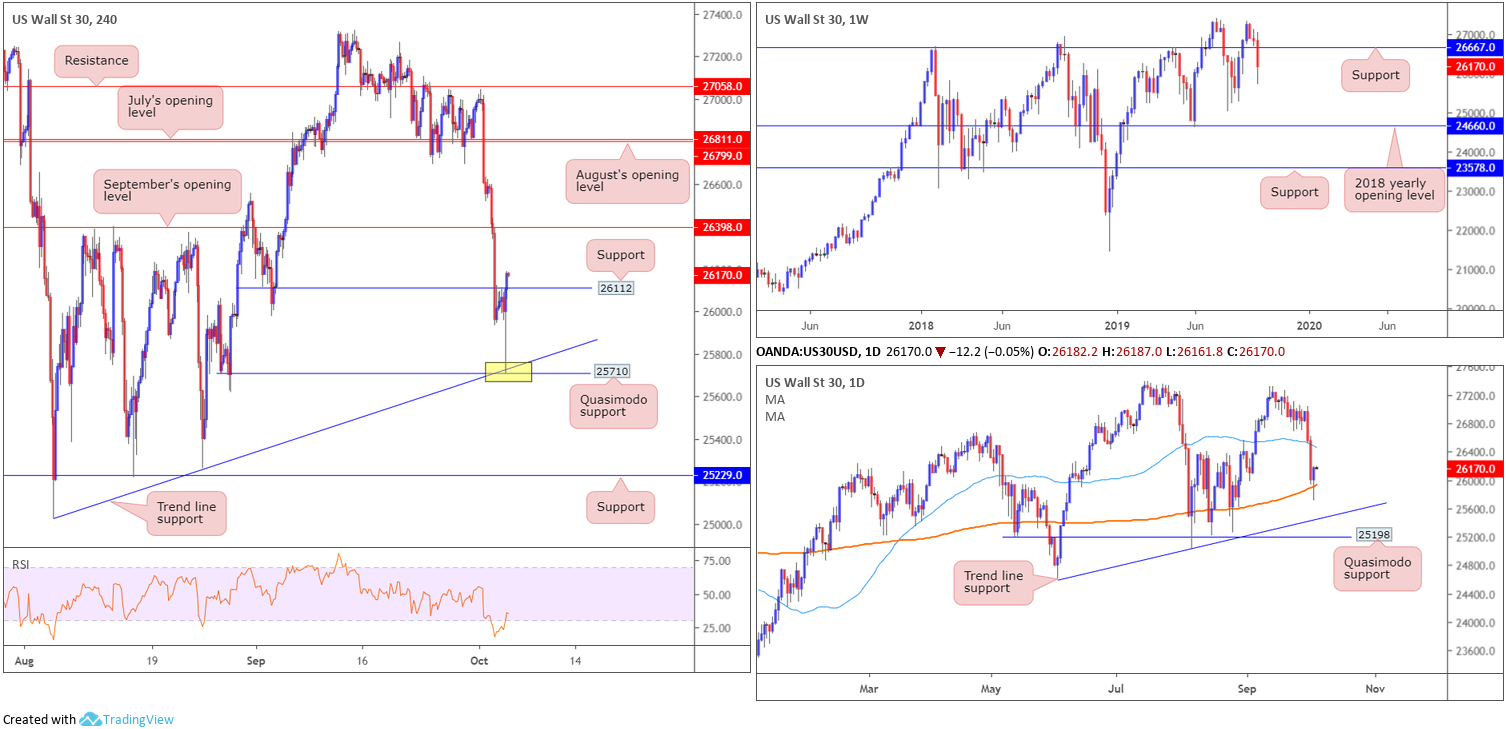
Dow Jones Industrial Average:
Reclaiming two days of losses, US equities wrapped up Thursday in positive territory as investors ramped up bets the Federal Reserve will cut rates this month to shore up an economy showing signs of slowing. The Dow Jones Industrial Average added 122.42 points, or 0.47%; the S&P 500 also rallied 23.02 points, or 0.80%, and the tech-heavy Nasdaq 100 added 87.61 points, or 1.16%.
Less-than-expected US ISM non-manufacturing PMI – services headline missed consensus – witnessed the Dow probe south and test an interesting level of H4 support shaped by a Quasimodo formation at 25710 and a trend line support extended from the low 25466. This was a noted area of support to watch for in Thursday’s technical briefing:
The point H4 Quasimodo support at 25710 and trend line support merge (yellow) is an area buyers may be watching today for potential opportunities. Note this combination also lies only a few points south of the 200-day SMA located on the daily timeframe. The first upside target from this neighbourhood has 26112 in sight.
H4 resistance at 26112 was recently taken (now likely to serve as support), consequently exposing September’s opening level at 26398 as the next viable resistance, closely trailed by the 50-day SMA (blue – 26462) on the daily timeframe.
In terms of where the market stands on the weekly timeframe, despite strong support recently coming into the market, price resides decisively beneath support at 26667, theoretically setting the stage for an approach towards the 25024 August 5 low, followed closely by the 2018 yearly opening level at 24660.
Areas of consideration:
Traders long from 25710 have likely reduced risk to breakeven and banked partial profits. Continued bidding is likely, according to H4 and daily structure, therefore any retest seen at 26112 might be a good opportunity to either pyramid any current long positions or consider joining the upside move. A retest in the shape of a H4 bullish candlestick signal would be a welcomed visual for most price action traders, identifying buyer intent and also providing structured entry and risk levels to work with.
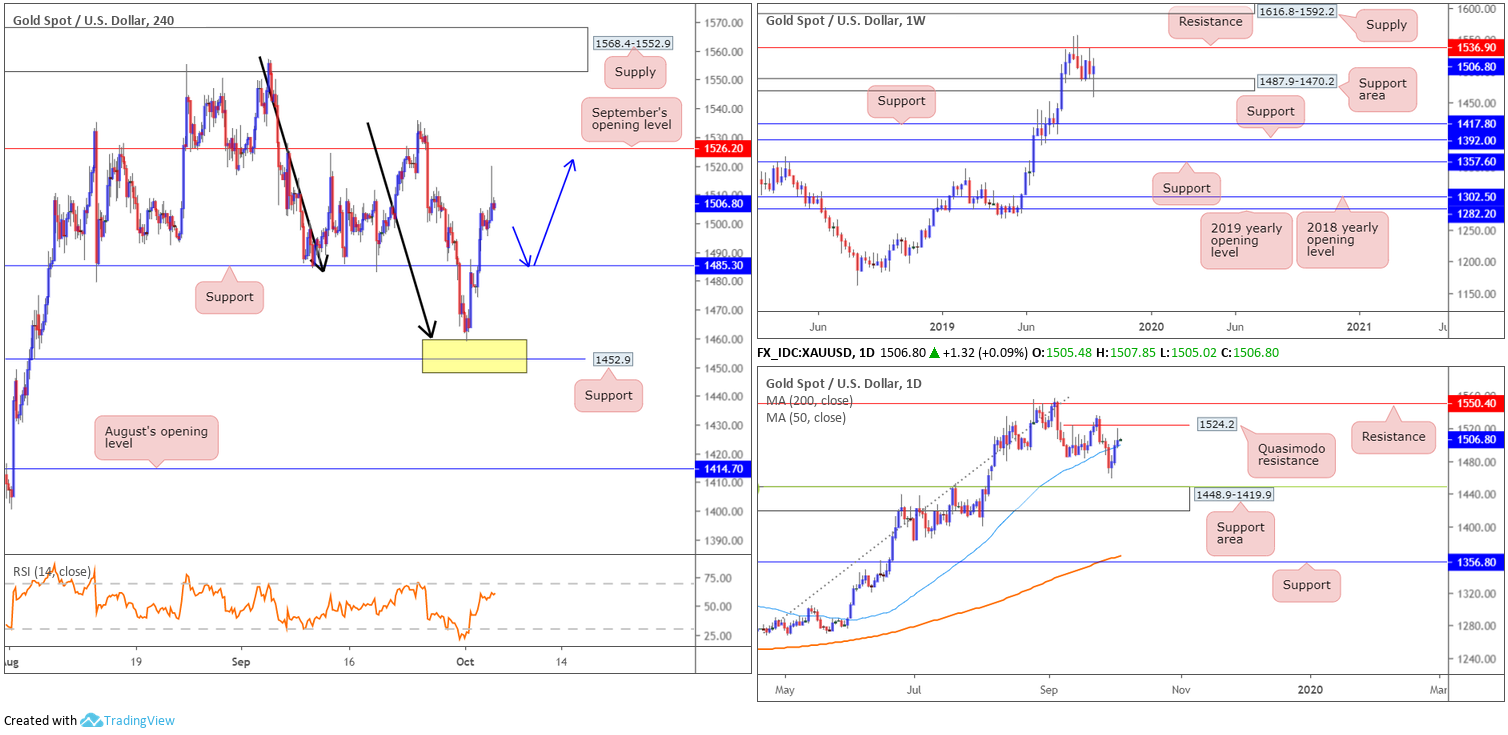
XAU/USD (GOLD):
Aside from a spike to highs of 1519.7, influenced by weaker-than-expected US ISM non-manufacturing PMI data, bullion traded mixed as US stocks recover on Fed rate-cut expectations.
Although a lacklustre performance, the unit has extended gains for a third consecutive session. The rally, originating from H4 support between 1448.9/1460.2 (comprised of the top limit of a daily support area at 1448.9-1419.9, a H4 support level at 1452.9 and a H4 AB=CD completion point at 1460.2 [black arrows]), could eventually lift H4 action to 1526.2: September’s opening level
Considering recent trading on the weekly timeframe, the support area at 1487.9-1470.2, although having its lower edge torn through earlier in the week, appears to have stabilised. Latest from the daily timeframe has price action a touch above its 50-day SMA (blue – 1498.2), eyeing a run towards local Quasimodo resistance at 1524.2 and possibly resistance at 1550.4.
Areas of consideration:
Outlook unchanged.
As all three timeframes exhibit space to press higher, longs likely remain the order of the day. Entering long at current price, however, is tricky, given limited support. A retest at H4 support drawn from 1485.3, nonetheless, would possibly entice buyers into the market, with an upside target set at the daily Quasimodo formation 1524.2, closely trailed by September’s opening level at 1526.2.
For conservative buyers, waiting for additional candlestick confirmation to form off 1485.3 might be an option worth exploring. This will help identify buyer intent before committing funds, and will also provide entry and risk levels.
The accuracy, completeness and timeliness of the information contained on this site cannot be guaranteed. IC Markets does not warranty, guarantee or make any representations, or assume any liability regarding financial results based on the use of the information in the site.
News, views, opinions, recommendations and other information obtained from sources outside of www.icmarkets.com.au, used in this site are believed to be reliable, but we cannot guarantee their accuracy or completeness. All such information is subject to change at any time without notice. IC Markets assumes no responsibility for the content of any linked site.
The fact that such links may exist does not indicate approval or endorsement of any material contained on any linked site. IC Markets is not liable for any harm caused by the transmission, through accessing the services or information on this site, of a computer virus, or other computer code or programming device that might be used to access, delete, damage, disable, disrupt or otherwise impede in any manner, the operation of the site or of any user’s software, hardware, data or property.


