
A note on lower timeframe confirming price action…
Waiting for lower timeframe confirmation is our main tool to confirm strength within higher timeframe zones, and has really been the key to our trading success. It takes a little time to understand the subtle nuances, however, as each trade is never the same, but once you master the rhythm so to speak, you will be saved from countless unnecessary losing trades. The following is a list of what we look for:
- A break/retest of supply or demand dependent on which way you’re trading.
- A trendline break/retest.
- Buying/selling tails/wicks – essentially we look for a cluster of very obvious spikes off of lower timeframe support and resistance levels within the higher timeframe zone.
- Candlestick patterns. We tend to stick with pin bars and engulfing bars as these have proven to be the most effective.
We search for lower timeframe confirmation between the M15 and H1 timeframes, since most of our higher-timeframe areas begin with the H4. Stops are usually placed 5-10 pips beyond confirming structures.
EUR/USD:
Going into the early hours of yesterday’s London segment the EUR declined in value. The move, as can be seen on the H4 chart, broke through both the trendline support extended from the high 1.1279 and support at 1.1074, before bottoming out around the top edge of a demand seen at 1.1049-1.1060. Bolstered by a lower than expected US ISM non-manufacturing PMI print amid the US open, the pair regained consciousness and eventually rallied back up to highs of 1.1120 to close the day marginally in the green.
With daily resistance lurking just ahead of current price at 1.1135, what’s likely in store for this market today? Well, traders need to be prepared for the possibility that price may whipsaw through this daily barrier to connect with a daily trendline resistance drawn from the low 1.0516 (green circle). On the other hand, we could also witness an attempt from the weekly bulls to drive the candles north up to the lower edge of the weekly resistance area at 1.1533-1.1278.
Our suggestions: In that the mighty NFP report is just around the corner, judging price movement is always tricky. However, the combination of the above said daily resistance along with a nearby daily trendline resistance is appealing for shorts. Of course, it’s down to the individual trader how he/she approaches these levels. We, nevertheless, will not consider this a valid trade if price strikes the aforementioned daily barriers 30 minutes pre/post NFP. Furthermore, our desk would also require at least a H4 bearish candle to form (indicating that the bears have interest) here before looking to pull the trigger.
Data points to consider: US Average hourly earnings, US Non-Farm employment change and the US unemployment rate all set to hit the wire at 12.30pm. Also, FOMC member Fischer is set to take the stage at 8pm GMT.

Levels to watch/live orders:
- Buys: Flat (stop loss: N/A).
- Sells: Watching the area seen between the current daily resistance at 1.1135 and the aforementioned daily trendline resistance – H4 bearish close required, while we feel the stop is best placed beyond the trigger candle.
GBP/USD:
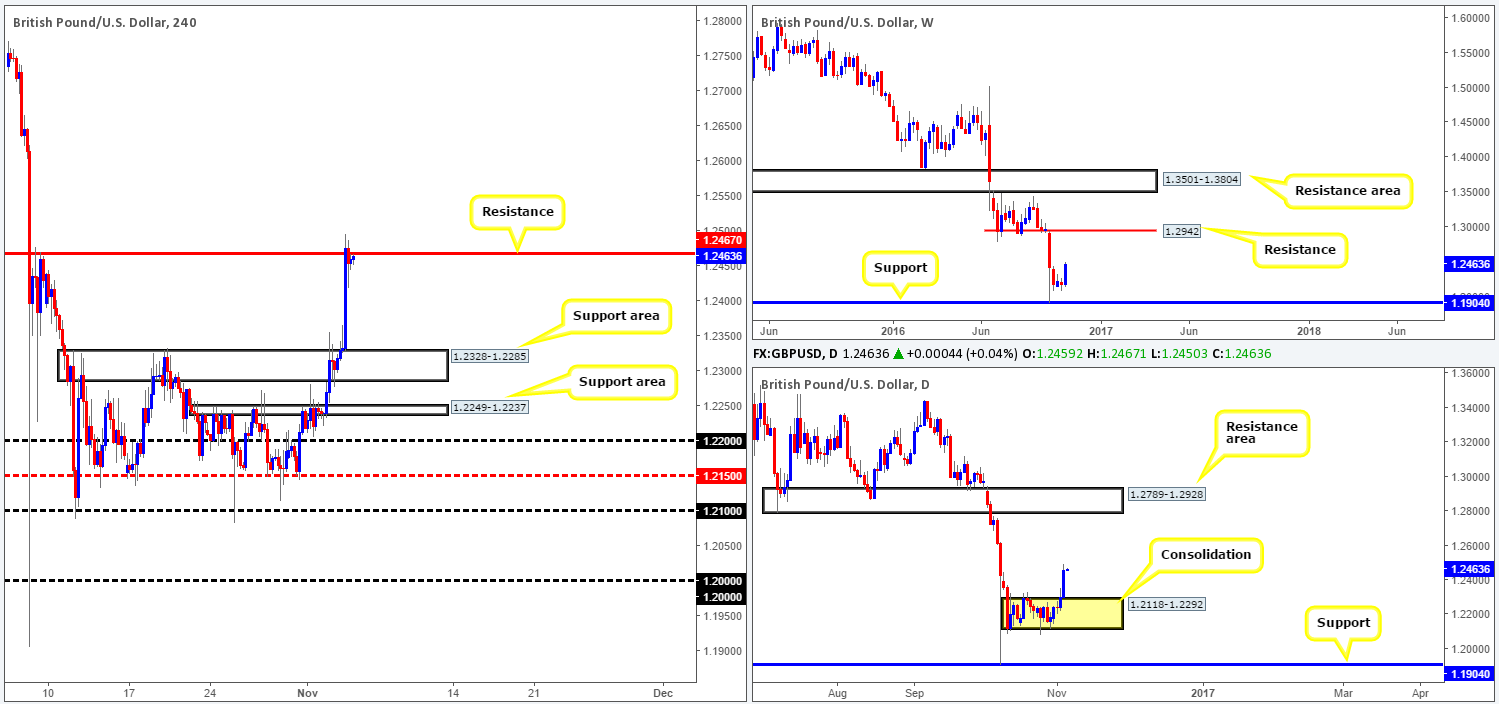
Following news that a British court ruled a vote must be held in Parliament prior to Brexit proceedings, along with the BoE stating that rates will not likely be cut again this year, the GBP benefitted hugely.
In consequence to this, yesterday’s daily candle aggressively closed above the consolidation fixed between 1.2118-1.2292 and now, at least from a technical viewpoint, looks set to stage a continuation move up to the resistance area coming in at 1.2789-1.2928. Be that as it may, before breakout buyers look to join the party, a word of warning – the H4 chart is not yet clear of resistance at 1.2467. Granted, the sellers do appear to be weak around this barrier at the time of writing, but we cannot ignore the fact that resistance is still at work in this market.
Our suggestions: In the event that the H4 candles manage to seal a reasonably sized H4 close above 1.2467 today, followed by a successful retest and a H4 bullish close, our team would, dependent on the time of day (NFP), look to buy here. In support of this move, let’s not forget that monthly price recently touched base with a large monthly demand seen here:
Data points to consider: US Average hourly earnings, US Non-Farm employment change and the US unemployment rate all set to hit the wire at 12.30pm. Furthermore, MPC member Forbes speaks at 2.45pm as well as FOMC member Fischer taking the stage at 8pm GMT.
Levels to watch/live orders:
- Buys: Watch for a close above the H4 resistance at 1.2467 and then look to trade any retest seen thereafter (H4 bullish close required – stop loss: ideally beyond the trigger candle).
- Sells: Flat (stop loss: N/A).
AUD/USD:
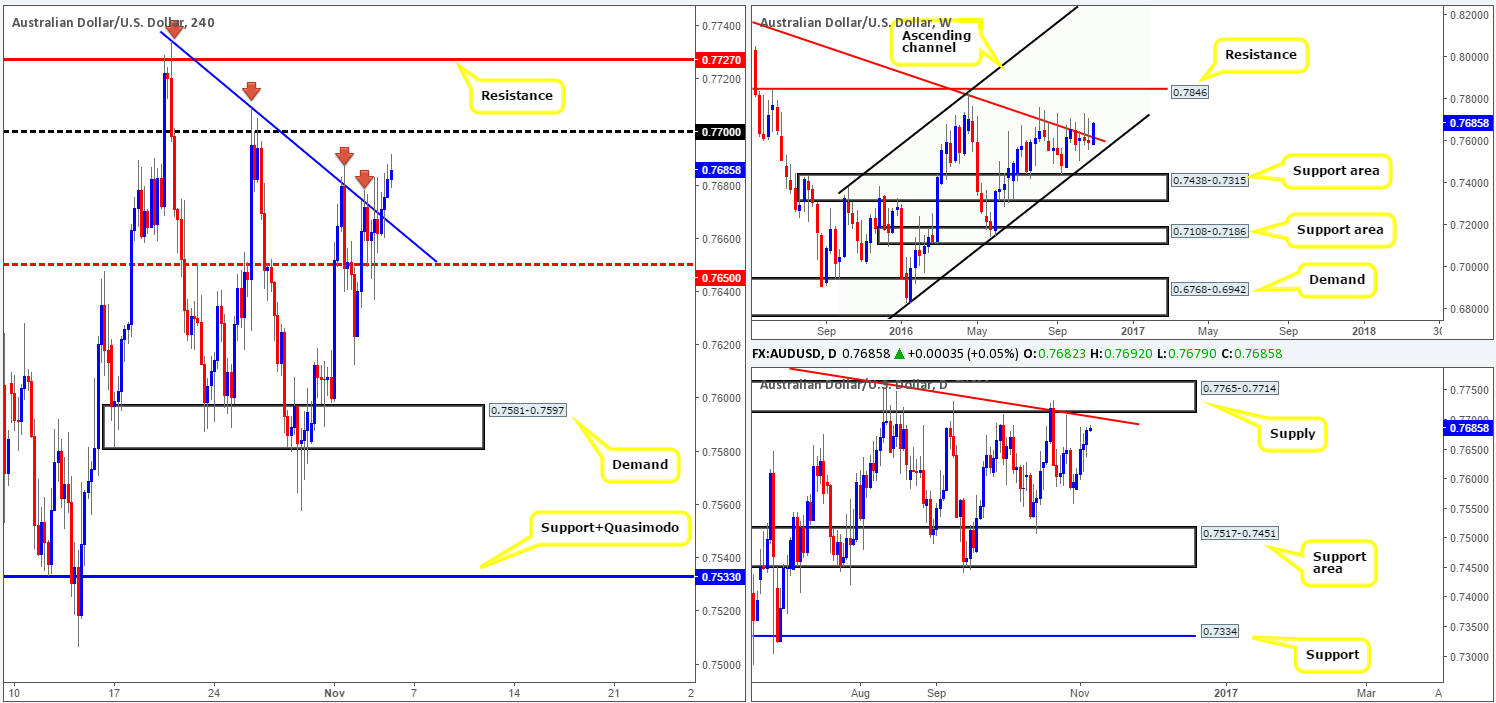
Australia’s international trade reported a better than expected month yesterday, consequently proving support to the market around the H4 mid-way barrier 0.7650. Thereafter, the Aussie continued to rally, taking out the H4 trendline resistance drawn from the high 0.7734 and closing the session in positive territory for the fifth consecutive day.
The pair’s current structure is interesting. Looking over to the weekly chart, the bulls look to be in good form and may end the week closing above the trendline resistance extended from the high 0.8295. This would be considered a bullish cue, right? Not necessarily. Turn your attention to the daily chart. Not only do we have a daily trendline resistance taken from the high 0.7835, but there’s also a supply zone seen chiseled in at 0.7765-0.7714, which has held prices lower since the beginning of May.
Our suggestions: In that we have the RBA taking the spotlight in less than 30 minutes as well as the Aussie retail sales report, we’d advise taking your finger off the trigger for now! Once the dust settles, we’ll have to reassess since higher-timeframe structure shows conflicting signals right now (see above in bold).
This will, unless the upcoming Aussie data drastically alters price, likely end with our team remaining on the sidelines, as by entering long you’re placing yourself against the aforementioned daily supply, and entering short, you’ve effectively gone up against weekly buyers!
Data points to consider: RBA (Reserve Bank of Australia) monetary policy statement, along with Australian retail sales at 12.30am. US Average hourly earnings, US Non-Farm employment change and the US unemployment rate all set to hit the wire at 12.30pm, FOMC member Fischer is set to take the stage at 8pm GMT.
Levels to watch/live orders:
- Buys: Flat (stop loss: N/A).
- Sells: Flat (stop loss: N/A).
USD/JPY:
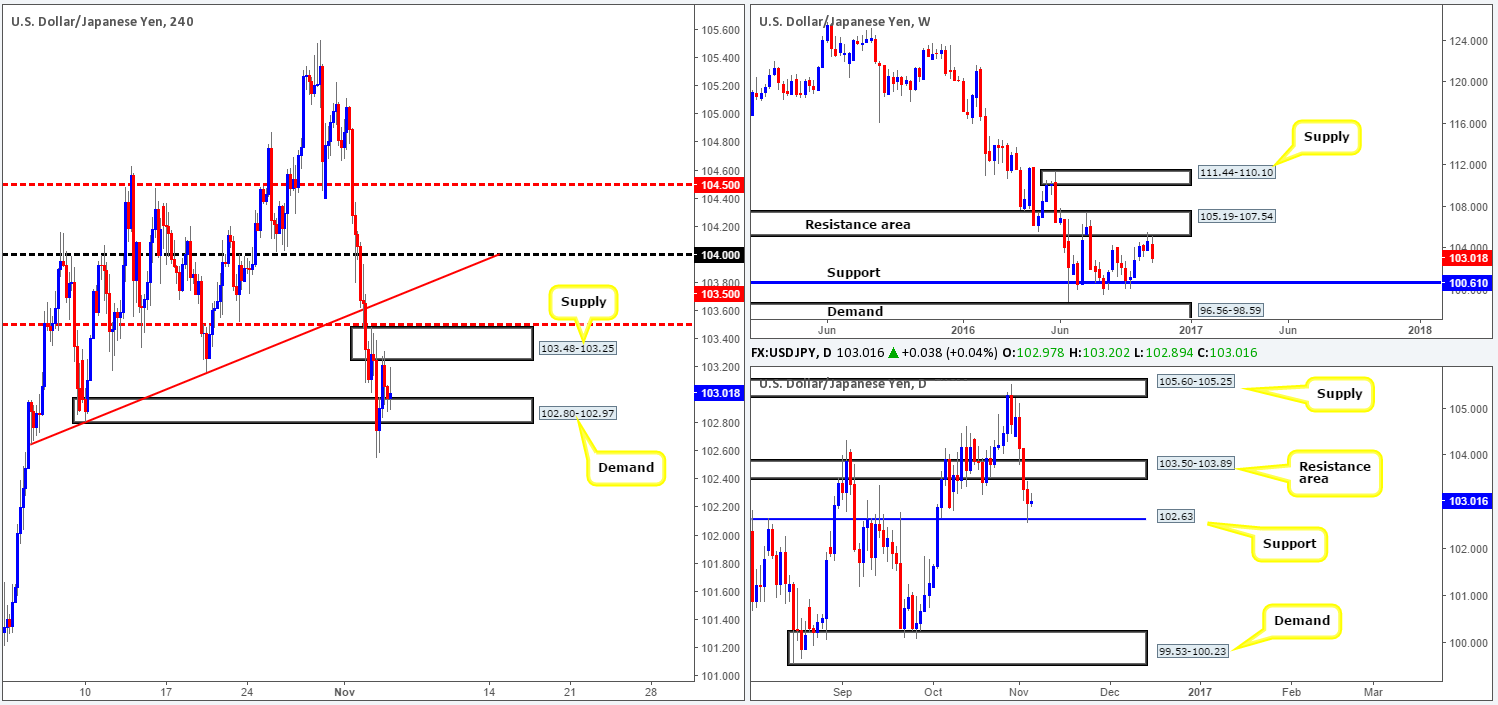
Kicking this morning’s report off with a look at the weekly chart shows that the sellers have so far managed to suppress buying from the underside of a resistance area seen at 105.19-107.54. Assuming that the bulls remain weak here, there’s a chance that the pair will revisit support at 100.61 in the not so distant future. Despite this, however, the daily bulls printed an end-of-day correction off support coming in at 102.63 yesterday. To our way of seeing things, the daily candles may retest the underside of the recently broken support area at 103.50-103.89 as resistance before continuing lower.
Stepping across to the H4 chart, we can see that the unit sold off in early trading, forcing price to close beyond demand at 102.80-102.97. The close lower, as you can see, proved to be unproductive as price bottomed out and rallied going into the London segment.
Our suggestions: In light of the pair finding support around the daily barrier at 102.63, and H4 price effectively now capped between the aforementioned demand and a H4 supply at 103.48-103.25, where does one go from here?
Looking at this purely from a technical standpoint, however, we still feel that a decisive close beyond the current H4 demand would likely indicate that daily support at 102.63 is the next line on the hit list to be taken out. A close below the daily level would potentially open up the path south down to the weekly support at 100.61 (the next downside target on the weekly timeframe), which sits just above daily demand at 99.53-100.23.
Therefore, a close below the H4 demand followed up with a retest and a reasonably sized H4 bear candle would, in our book, be considered sufficient enough to condone a short entry in this market, with an ultimate target set at 100.61: the weekly support. However, with one of the biggest economic indicators of the month being released today, technicals could take a back seat, so do trade carefully!
Data points to consider: US Average hourly earnings, US Non-Farm employment change and the US unemployment rate all set to hit the wire at 12.30pm, FOMC member Fischer is set to take the stage at 8pm GMT.
Levels to watch/live orders:
- Buys: Flat (stop loss: N/A).
- Sells: Watch for a close below the H4 demand at 102.80-102.97 and then look to trade any retest seen thereafter (H4 bearish close required – stop loss: ideally beyond the trigger candle).
USD/CAD:
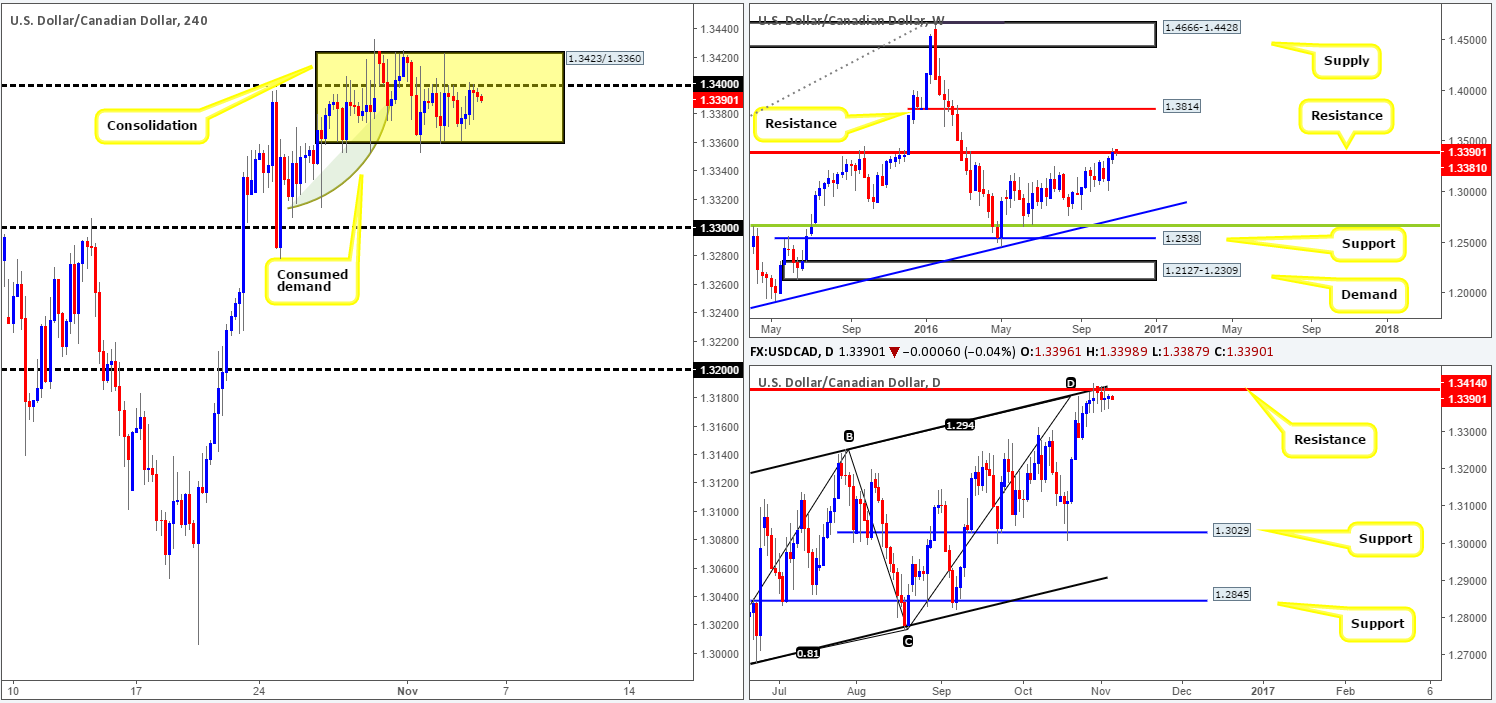
As oil prices continue to tumble, the USD/CAD pair remains fixed between 1.3423/1.3360, using the 1.34 handle as a central pivot. With the unit unable to find direction since the beginning of the week, this may well change going into today’s employment report!
Technically speaking, however, a break to the downside is more likely. Although weekly resistance at 1.3381 suffered a slight breach last week, upside momentum has been slow. Daily resistance at 1.3414 (boasts an AB=CD completion point around the 1.3384ish range and a channel resistance taken from the high 1.3241) on the other hand, continues to hold ground for now.
Our suggestions: Ideally, a close beyond the current H4 consolidation would be fantastic, as not only would this likely confirm downside strength from the above said higher-timeframe structures, it would also set the stage for a possible downside move towards the 1.33 handle, since there’s little active demand seen to the left of current price.
Data points to consider: CAD employment change and unemployment rate, alongside US Average hourly earnings, US Non-Farm employment change and the US unemployment rate all set to hit the wire at 12.30pm. Later on we also have FOMC member Fischer is set to take the stage at 8pm GMT.
Levels to watch/live orders:
- Buys: Flat (stop loss: N/A).
- Sells: Watch for a close below the H4 lows 1.3360 and then look to trade any retest seen thereafter (H4 bearish close required – stop loss: ideally beyond the trigger candle).
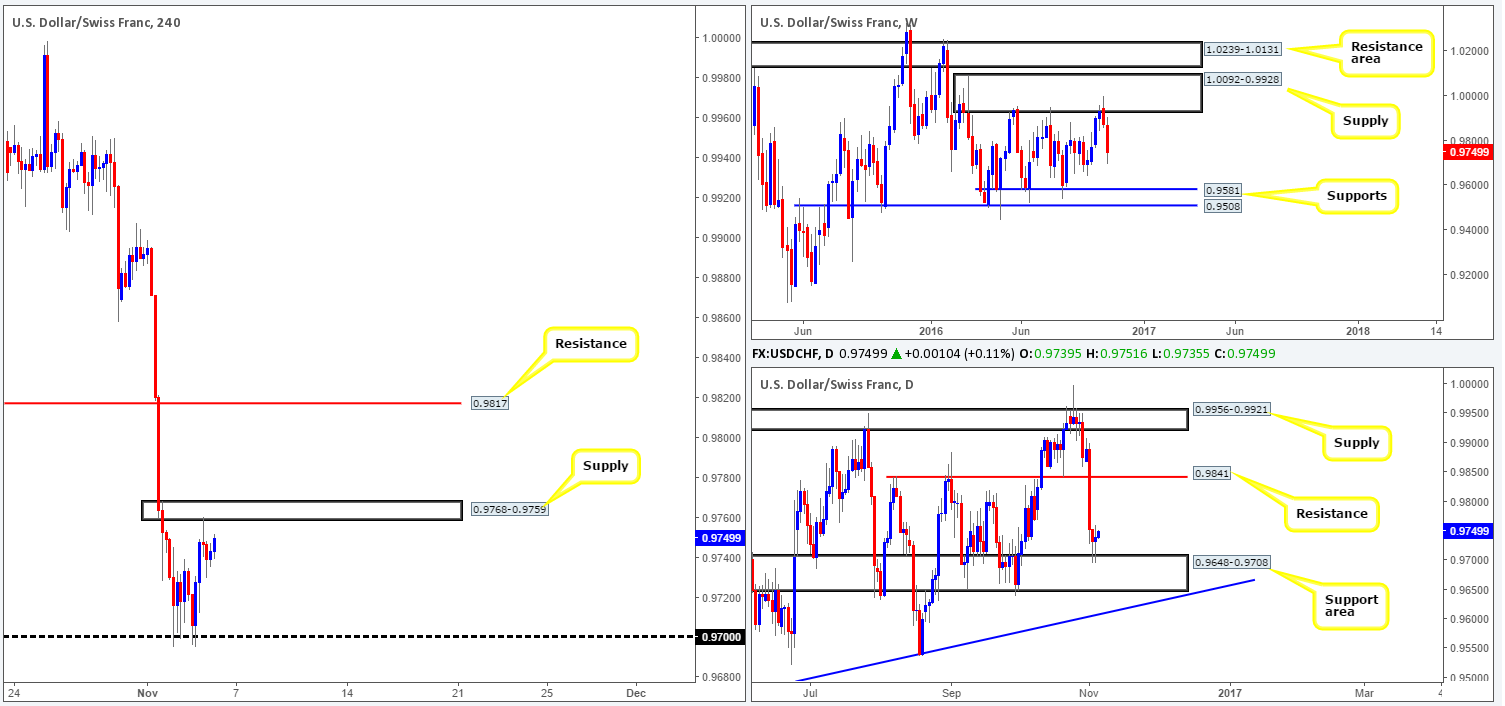
USD/CHF:
Looking at this market from the weekly chart this morning, we can see that the bears have been incredibly aggressive in extending the prior week’s bounce from supply at 1.0092-0.9928. Assuming that this continues, it’s possible in the not so distant future, that we may see price cross swords with the support level drawn from 0.9581: the lower edge of the current weekly range. Moving down to the daily chart, the daily candles depict a slightly different picture. Since Wednesday, price found a pocket of bids around the top edge of a support area coming in at 0.9648-0.9708, which, as far as we can see, has the potential to push prices back up to resistance penciled in at 0.9841.
As we moved into yesterday’s London session, H4 buyers bid prices north from the 0.97 handle and went on to touch base with a minor supply logged in at 0.9768-0.9759, formed from the break of the 7/10 low at 0.9767. While this is considered a minor area in relation to its size, it is a key zone for us!
Our suggestions: Put simply, a close above the current H4 supply would, in our opinion, suggest further upside is on the cards to H4 resistance at 0.9817, followed closely by daily resistance mentioned above at 0.9814. Should this come into view, a close higher coupled with a retest as demand along with a H4 bullish close, our team would have no hesitation in buying this market. Conversely, if the sellers manage to suppress buyers at the current H4 supply, this would likely point to a selloff and eventually a possible break below the current daily support area. To become sellers, nevertheless, we’d prefer to see the 0.97 handle taken out beforehand. This would offer traders the opportunity to trade short on any retest seen to the underside of this number (H4 bearish close required).
Data points to consider: US Average hourly earnings, US Non-Farm employment change and the US unemployment rate all set to hit the wire at 12.30pm, FOMC member Fischer is set to take the stage at 8pm GMT.
Levels to watch/live orders:
- Buys: Watch for a close above the H4 supply at 0.9768-0.9759 and then look to trade any retest seen thereafter (H4 bullish close required – stop loss: ideally beyond the trigger candle).
- Sells: Watch for a close below the 0.97 and then look to trade any retest seen thereafter (H4 bearish close required – stop loss: ideally beyond the trigger candle).
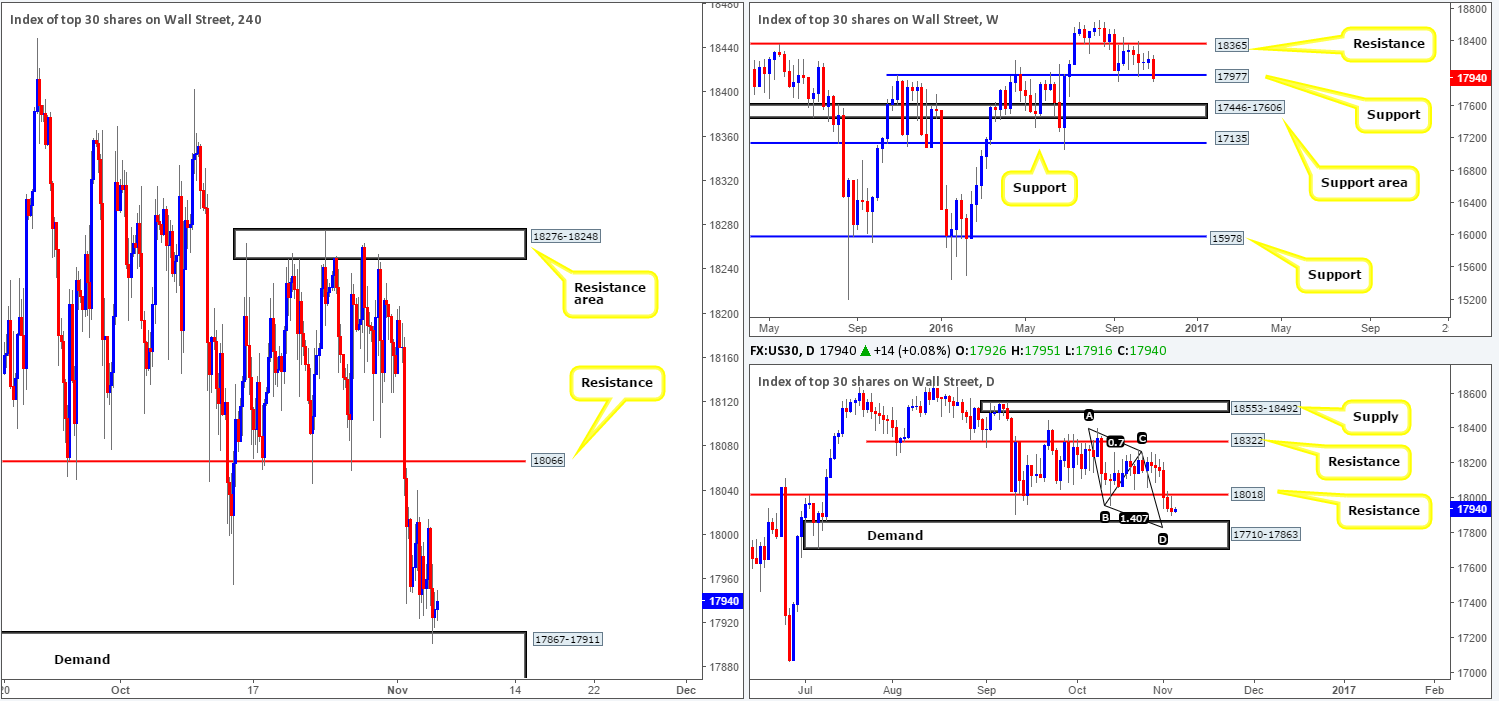
DOW 30:
In view of weekly price seen trading slightly beyond the support level at 17977, and daily price recently coming to within a cat’s whisker of retesting daily resistance at 18018, we feel the unit may end up connecting with the daily demand base seen at 17710-17863 sometime today. However, before price can reach this daily demand, a H4 demand at 17867-17911 is standing in the way. In fact, if the current H4 demand gives way, it’s likely we’ll see the DOW shake hands with a H4 demand seen at 17710-17793, which sits within the extremes of the current daily demand and also just below the completion point (17827) of the daily AB=CD pattern taken from the high 18404.
Our suggestions: Given the uncertainty surrounding the upcoming elections, and the fact that we have the US employment report to contend with today, the only area our team remains comfortable trading from is the H4 demand seen at 17710-17793. Be that as it may, we would not advise trading this zone 30 minutes pre/post NFP!
Levels to watch/live orders:
- Buys: 17710-17793 ([H4 bullish close required] stop loss: ideally beyond the trigger candle).
- Sells: Flat (stop loss: N/A).
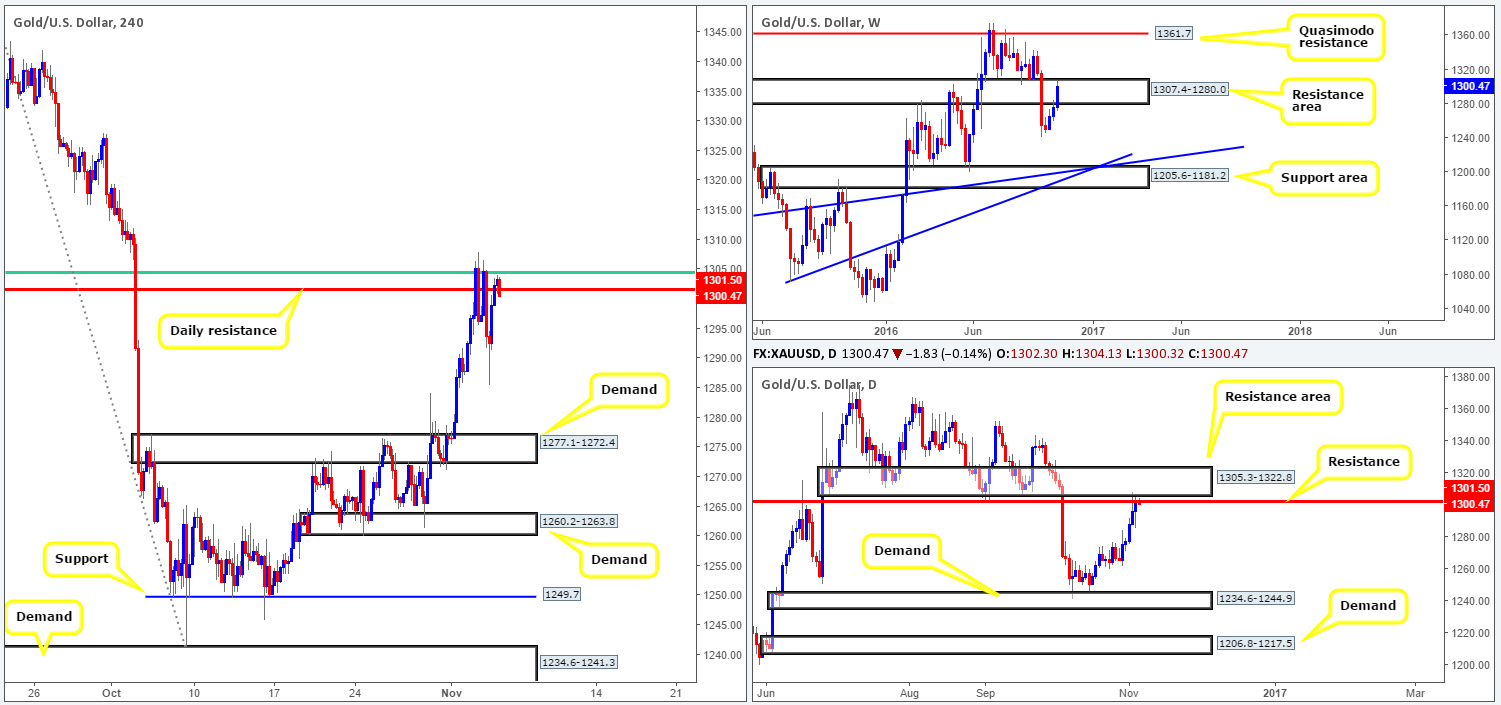
GOLD:
(Trade update: we were taken out for breakeven at 1295.0 – for details see the previous report)
Despite the gold market seen trading deep within a weekly resistance area at 1307.4-1280.0, and daily action trading at the underside of both the daily resistance level at 1301.5 and the nearby daily resistance area drawn from 1305.3-1322.8, the yellow metal still managed to print a fifth consecutive daily bull candle yesterday.
While price did stabilize itself around the H4 61.8% Fib resistance at 1304.5 (green line) and the above said daily resistance level this week, the bears seem to be struggling to find a foothold. All of this – coupled with the expected volatility today’s US employment report will likely bring, our team is wary trading this unit today despite it being structurally overbought. With that being said, our desk will place this market on the back burner for now and reassess the situation post NFP.
Levels to watch/live orders:
- Buys: Flat (stop loss: N/A).
- Sells: Flat (stop loss: N/A)


