
EUR/USD:
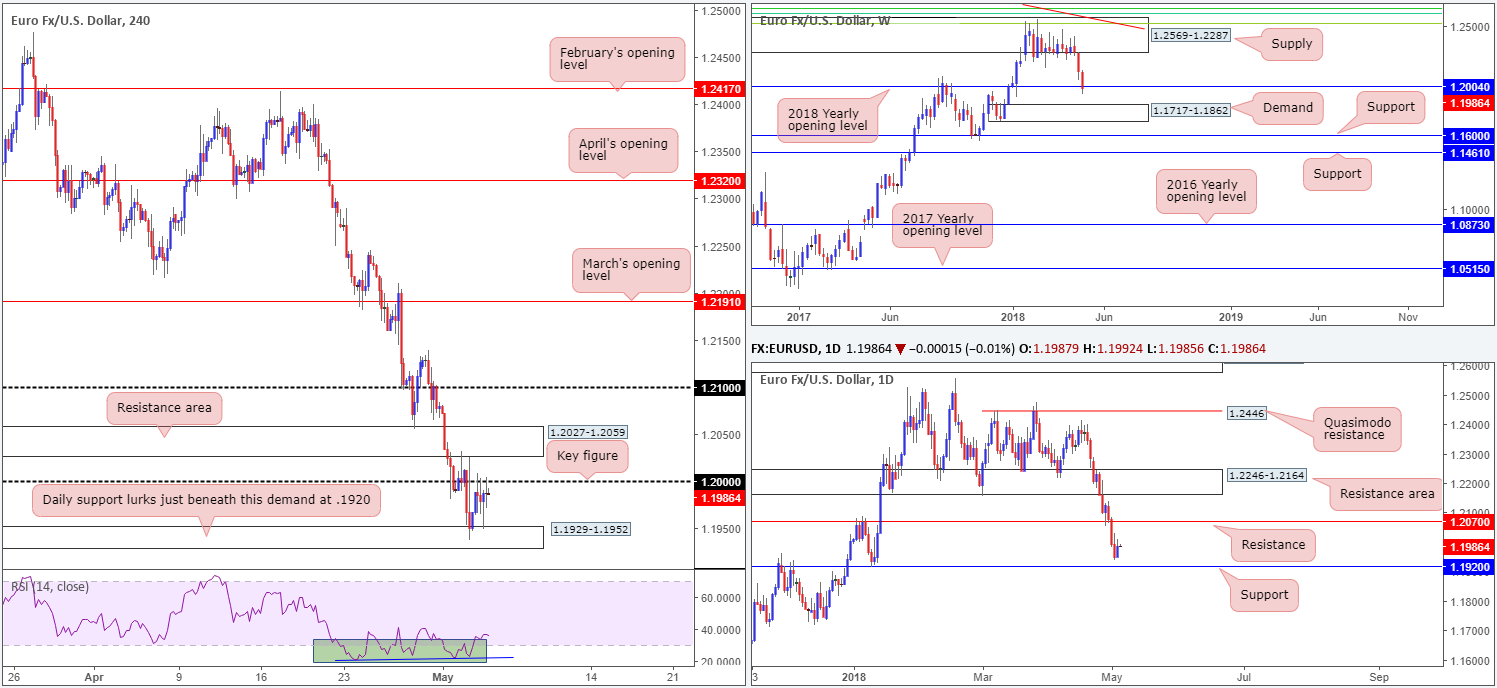
The value of the euro penciled in a marginal gain on Thursday, consequently fracturing a three-day bearish phase. H4 demand at 1.1929-1.1952, as you can see, managed to hold ground and eventually forced a retest of the nearby key figure 1.20. Undermined by disappointing EU preliminary inflation figures and reasonably sound US economic data, the pair remained rooted between these two H4 structures going into the close. Overall, it appears the markets are still considering the policy implications of the Fed’s new symmetrical approach to inflation targeting.
Longer term, the pair is seen marginally rupturing the 2018 yearly opening level at 1.2004, following a dominant selloff from a major-league weekly supply at 1.2569-1.2287. A violation of the current support may call for a test of weekly demand positioned at 1.1717-1.1862. Daily movement, on the other hand, recently bottomed just north of a daily support level priced in at 1.1920 in the shape of a bullish inside candle formation. Further upside from this point could lead to daily resistance at 1.2070 being brought back into the fray.
Potential trading zones:
As highlighted in Thursday’s update, the current H4 demand, although holding price action higher, has ‘fakeout’ painted all over it. The daily support lurking just beneath it at 1.1920 provides an ideal platform to wipe out traders that bought from this area, and also trap breakout sellers. As such, all eyes remain on the 1920ish region today for an intraday bounce to the upside. Why only a bounce? Well, let’s not forget that the euro continues to emphasize a relatively strong bearish vibe at present, and weekly action is currently seen testing price levels beyond the 2018 yearly opening level, thus indicating the potential for a test of weekly demand mentioned above at 1.1717-1.1862.
Traders should also remain cognizant of today’s economic news: the US job’s report, which can, and usually does, alter short-term technical readings.
Data points to consider today: German Buba President Weidmann speaks; US job’s data; FOMC members Dudley, Williams and Quarles also take to the stage.
GBP/USD:
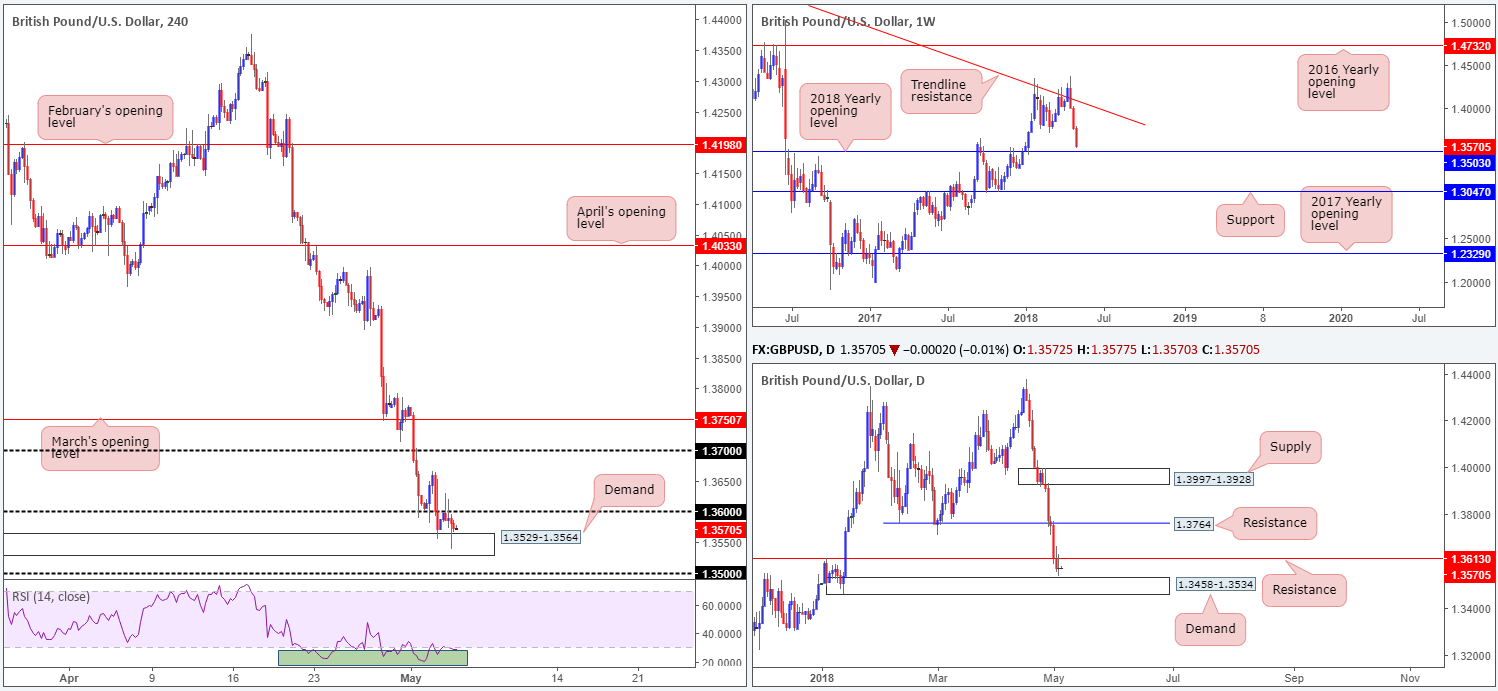
The British pound, despite a ‘sterling’ effort, was unable to sustain gains above the 1.36 barrier on Thursday. Undermined by a lower-than-expected UK services PMI print amid early London hours, H4 price receded from highs of 1.3629 and retested nearby H4 demand at 1.3529-1.3564. Beyond the H4 demand base, the team has noted to keep eyes on the 1.35 handle, shadowed closely by a H4 Quasimodo support at 1.3482.
As previously explained in Thursday’s report, the current H4 demand is a rather compelling zone. Not only is it fastened to the top edge of a daily demand area at 1.3458-1.3534, we can also see that the daily demand houses the 2018 yearly opening level at 1.3503 seen on the weekly chart.
Potential trading zones:
The GBP/USD remains in an interesting position right now. Sentiment clearly favors downside at the moment. Nevertheless, the current H4 demand and its connecting higher-timeframe areas noted above is going to be a stiff floor to break through, in our opinion.
Therefore, we should see some form of correction take shape soon. The psychological number, along with the aforementioned H4 Quasimodo support, is likely an area that’ll hold for at least an intraday bounce. From here, one could look to place stops below the lower edge of the current daily demand at a distance of 25 or so pips. However, do remain aware that US non-farm payrolls is scheduled for release later on today!
Data points to consider today: US job’s data; FOMC members Dudley, Williams and Quarles also take to the stage.
AUD/USD:
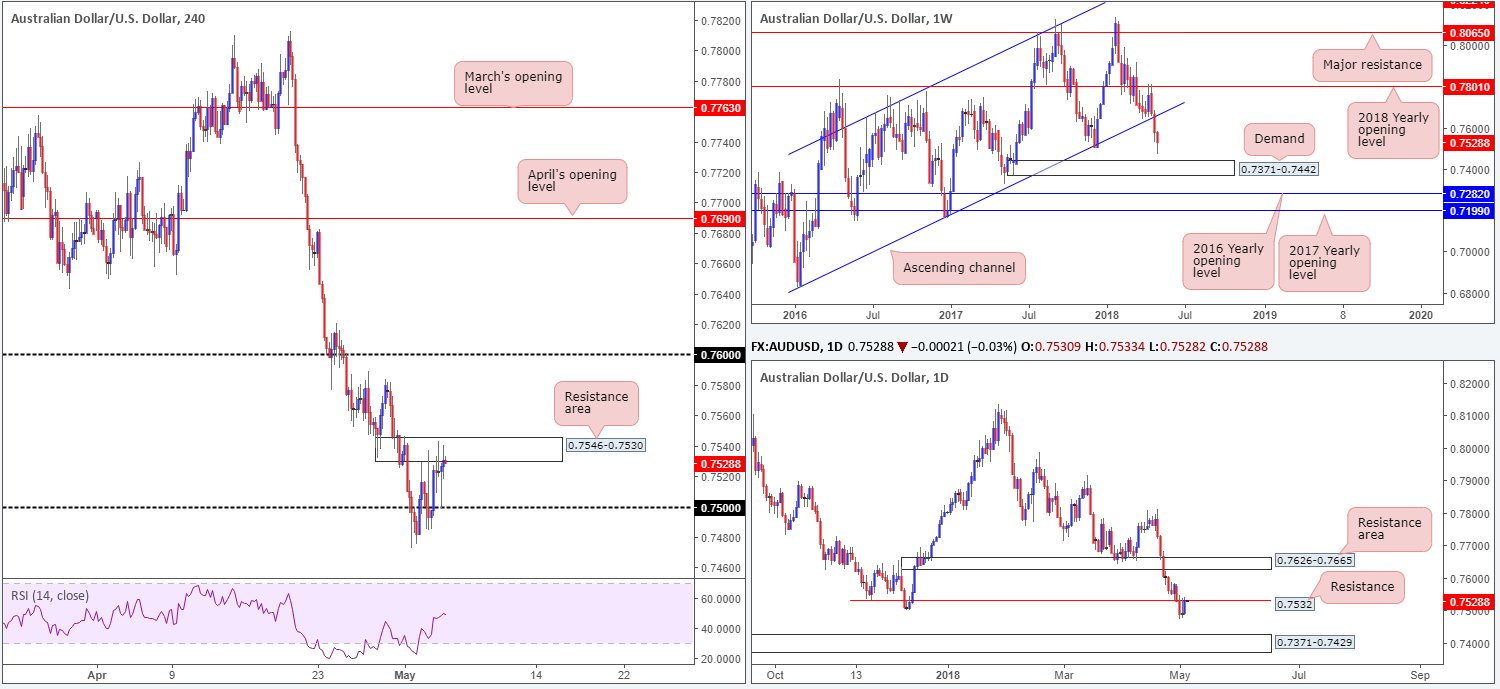
Spurred on by encouraging Australian economic data, the AUD/USD extended gains above the 0.75 number in early trade. Australian building permits posted a 2.6% increase vs. 1.1% expected and trade balance more than doubled the market’s expectations of 0.68B, reporting a healthy 1.53B reading. Despite stellar numbers, follow-through buying diminished once the H4 candles shook hands with a local H4 resistance zone at 0.7546-0.7530 and converging daily resistance at 0.7532.
Weekly flow, as you can see, is currently printing a clear buying tail just north of a weekly demand at 0.7371-0.7442. Continued buying in this market could eventually see the unit retest the underside of a weekly channel support-turned resistance taken from the low 0.6827.
Potential trading zones:
Buying this market is currently capped by both H4 and daily structure. Until a decisive H4 close is seen above the current H4 resistance area, entering long is difficult. Targets above this region can be seen at 0.76, followed then by the daily resistance area at 0.7626-0.7665. As for the sell-side of this market, a H4 close beneath 0.75 is required. Downside targets from this angle can be seen at a H4 demand area coming in at 0.7422-0.7439 that is glued to the top edge of a daily demand area at 0.7371-0.7429 (both areas not seen on the screen), which itself is located within the lower limits of the aforementioned weekly demand.
Data points to consider today: RBA monetary policy statement; China’s Caixin services PMI; US job’s data; FOMC members Dudley, Williams and Quarles also take to the stage.
USD/JPY:
The Japanese yen gained momentum across the board amid a decline in US equity prices and falling US Treasury yields. Following a minor breach of H4 support at 109.73, the pair retested this number as resistance during the early hours of Thursday and fell sharply lower, taking out February’s opening level at 109.19 and testing the 109 handle. Beyond 109, we have H4 channel support etched from the low 104.62, shadowed closely by H4 mid-level support at 108.50.
From another point of view, higher-timeframe movement shows that weekly price is on track to complete a bearish pin-bar formation within the walls of a weekly supply zone printed at 110.48-108.68. Should this come to fruition, additional downside to weekly support at 107.45 may be on the cards. Also potentially promoting further selling is the daily timeframe. Consequent to yesterday’s bout of selling, daily support at 108.52 is back on the radar, which aligns beautifully with the H4 mid-level support mentioned above at 108.50 and noted H4 channel support.
Potential trading zones:
Regardless of higher-timeframe structure indicating further downside, selling into the 109 handle is not a setup we would label high probability. That being the case, the team has noted to keep a close eye out for a H4 close beneath this number. Should a follow-up retest of this number be observed, an intraday short that targets 108.50s could be an option. A break of this level, however, could extend the target to 108, followed closely by daily support marked at 107.81.
Data points to consider today: US job’s data; FOMC members Dudley, Williams and Quarles also take to the stage; Japanese banks are closed in observance of Greenery Day.

USD/CAD:
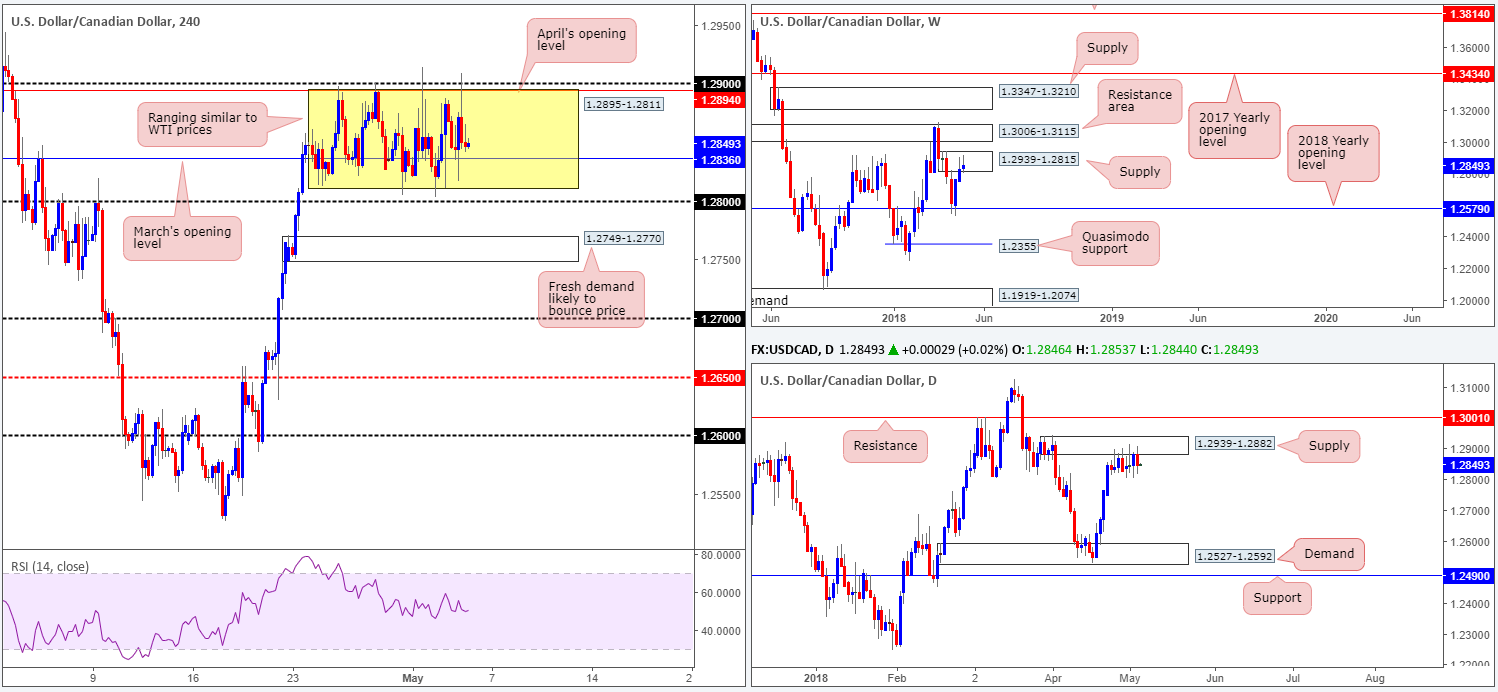
Since April 25, the USD/CAD has emphasized a somewhat directionless state. Canadian trade balance figures came in lower than expected on Thursday, sparking an immediate rally to highs of 1.2875 (seen clearer on the M30 chart). However, this had zero effect on current structure.
In similar fashion to WTI prices, the H4 candles continue to fluctuate between 1.2895/1.2811 (within the area is March’s opening level seen at 1.2836). As highlighted in previous writings, the team is still biased to the downside in spite of the ranging structure we’re seeing at the moment. This is largely due to where price is positioned on the bigger picture. Weekly action is seen trading from within the boundaries of a weekly supply at 1.2939-1.2815, following a stronger-than-expected rebound off the 2018 yearly opening level at 1.2579 two weeks ago. In conjunction with weekly flow, daily price recently crossed swords with a daily supply zone at 1.2939-1.2882 and has held ground since April 25.
Potential trading zones:
A break of 1.28 would likely spark a round of selling. However, traders need to account for the fresh H4 demand based just beneath it at 1.2749-1.2770 as it is highly likely to bounce price. With that in mind, we recommend waiting for the current H4 demand area to be engulfed (and preferably retested as resistance) before considering short positions. Although the next downside target is relatively close: 1.27, we feel it is still a trade worthy of attention given that the next support target on the bigger picture does not come into view until daily demand at 1.2527-1.2592!
Data points to consider today: US job’s data; FOMC members Dudley, Williams and Quarles also take to the stage; CAD Ivey PMI.
USD/CHF:
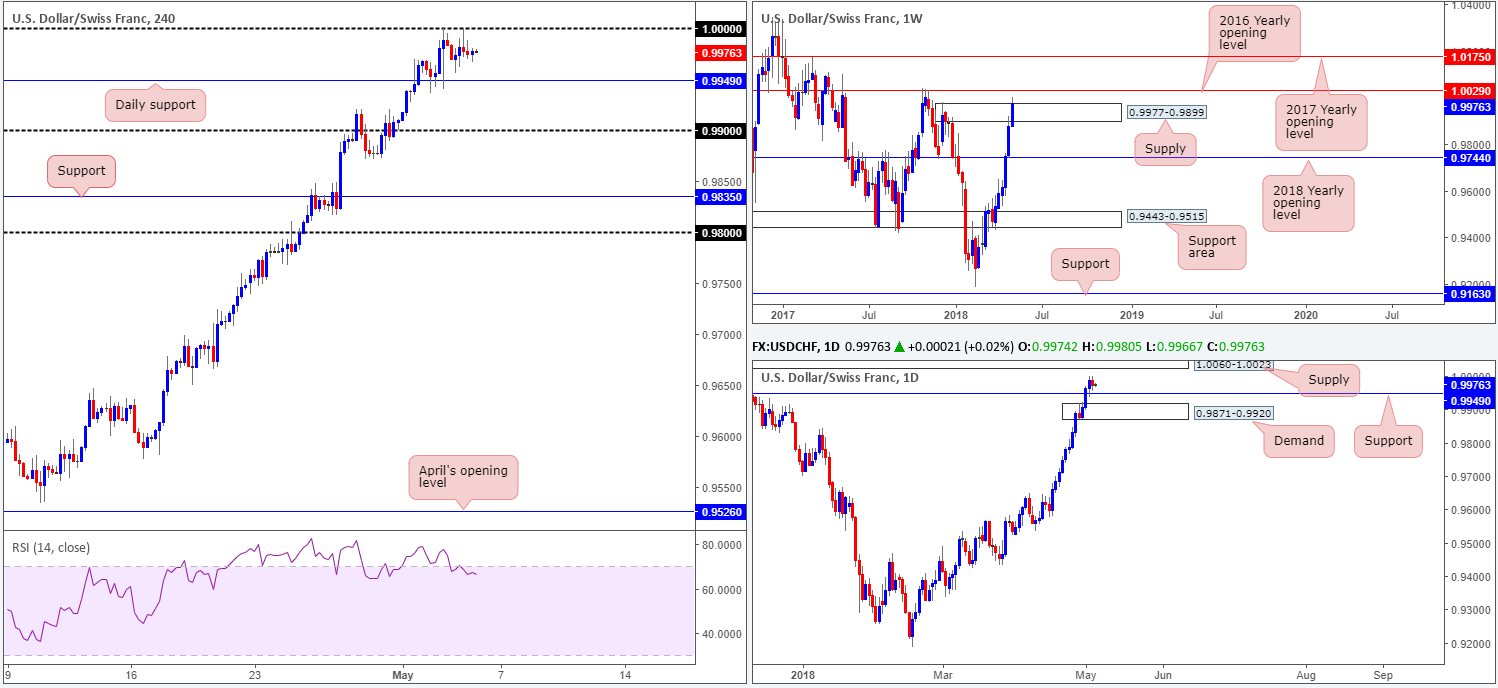
In the same manner as the EUR/USD, its inversely correlated cousin the USD/CHF also printed lackluster movement on Thursday. Parity (1.0000), as you can see, remains an overhead barrier, so far managing to withstand two bullish attacks on Wednesday and Thursday. Nearby daily support at 0.9949, which held beautifully on Wednesday on the retest, also remains in view.
Over on the weekly timeframe, recent upside breached the top edge of a weekly supply zone at 0.9977-0.9899, likely triggering sellers’ stops and filling breakout buyers’ orders. The next objective beyond this area can be seen at 1.0029: the 2016 yearly opening level. Meanwhile, daily action shows room to pop higher until we shake hands with daily supply positioned at 1.0060-1.0023 which happens to house the 2016 yearly opening level mentioned above on the weekly timeframe at 1.0029.
Potential trading zones:
With the above in mind, we still feel that the daily support is high probability for potential long plays today, with an overall take-profit target set at 1.0060-1.0023: daily supply, which, as already mentioned, is the next upside target on the daily scale. Reducing risk to breakeven once/if H4 price closes above 1.0000 should also be considered.
Data points to consider today: US job’s data; FOMC members Dudley, Williams and Quarles also take to the stage.
Dow Jones Industrial Average:
In recent trading, the DJIA drove to lows of 23531 and reacted to a H4 AB=CD completion point (see red arrows) that formed just north of a H4 demand area coming in at 23356-23452 (happens to be embedded within the walls of a weekly demand area at 23242-23494). Also of interest is the daily Quasimodo support positioned just above the current H4 demand at 23509. As is shown on the daily timeframe, recent movement chalked up a reasonably healthy pin-bar formation to the upside from just ahead of the Quasimodo. This – coupled with the nearby aforementioned supports – could attract buyers into the market today.
Potential trading zones:
Despite the potential for additional buying, the team is recommending caution. Unless a test of the H4 demand area is seen, we feel there is risk to the downside still present. Therefore, we’re watching for H4 price to breach yesterday’s low 23531 – fill stop-loss orders – and then test the H4 demand. Should a H4 full or near-full-bodied bull candle present itself, this would be a clear sign to buy, targeting H4 supply noted at 24579-24448, and quite possibly the H4 resistance area at 25024-24803.
Data points to consider today: US job’s data; FOMC members Dudley, Williams and Quarles also take to the stage.
GOLD (XAU/USD SPOT):
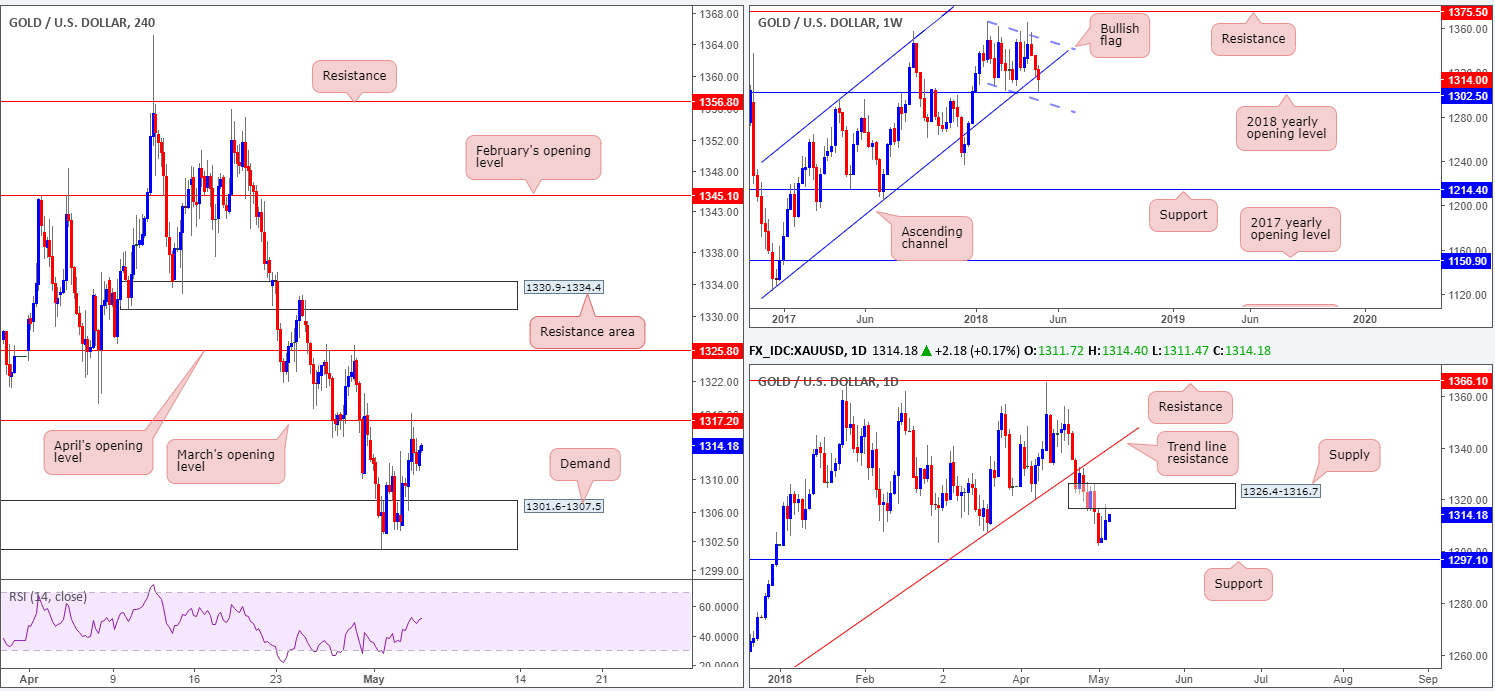
As anticipated, H4 demand at 1301.6-1307.5 held firm and eventually lifted the price of gold higher. Well done to those who jumped aboard this move as the first upside target was recently met at 1317.2: March’s opening level. The move, we believe, was likely bolstered by the 2018 yearly opening level recently brought into view on the weekly timeframe at 1302.5. Further buying in this market is, of course, a possibility, but it may be a trifle more challenging that daily supply at 1326.4-1316.7 is now in play. Interestingly, this daily supply area was the ‘decision point’ to initially probe below the long-term weekly channel support taken from the low 1122.8. Therefore, it is significant, in our humble opinion.
Potential trading zones:
It seems the yellow metal has hit a crossroads. Buying appears to be the way forward on the weekly timeframe, but challenging on the daily and H4 timeframes. With this being the case, neither a long nor short seems attractive at this time.
This site has been designed for informational and educational purposes only and does not constitute an offer to sell nor a solicitation of an offer to buy any products which may be referenced upon the site. The services and information provided through this site are for personal, non-commercial, educational use and display. IC Markets does not provide personal trading advice through this site and does not represent that the products or services discussed are suitable for any trader. Traders are advised not to rely on any information contained in the site in the process of making a fully informed decision.
This site may include market analysis. All ideas, opinions, and/or forecasts, expressed or implied herein, information, charts or examples contained in the lessons, are for informational and educational purposes only and should not be construed as a recommendation to invest, trade, and/or speculate in the markets. Any trades, and/or speculations made in light of the ideas, opinions, and/or forecasts, expressed or implied herein, are committed at your own risk, financial or otherwise.
The use of the site is agreement that the site is for informational and educational purposes only and does not constitute advice in any form in the furtherance of any trade or trading decisions.
The accuracy, completeness and timeliness of the information contained on this site cannot be guaranteed. IC Markets does not warranty, guarantee or make any representations, or assume any liability with regard to financial results based on the use of the information in the site.
News, views, opinions, recommendations and other information obtained from sources outside of www.icmarkets.com.au, used in this site are believed to be reliable, but we cannot guarantee their accuracy or completeness. All such information is subject to change at any time without notice. IC Markets assumes no responsibility for the content of any linked site. The fact that such links may exist does not indicate approval or endorsement of any material contained on any linked site.
IC Markets is not liable for any harm caused by the transmission, through accessing the services or information on this site, of a computer virus, or other computer code or programming device that might be used to access, delete, damage, disable, disrupt or otherwise impede in any manner, the operation of the site or of any user’s software, hardware, data or property.


