
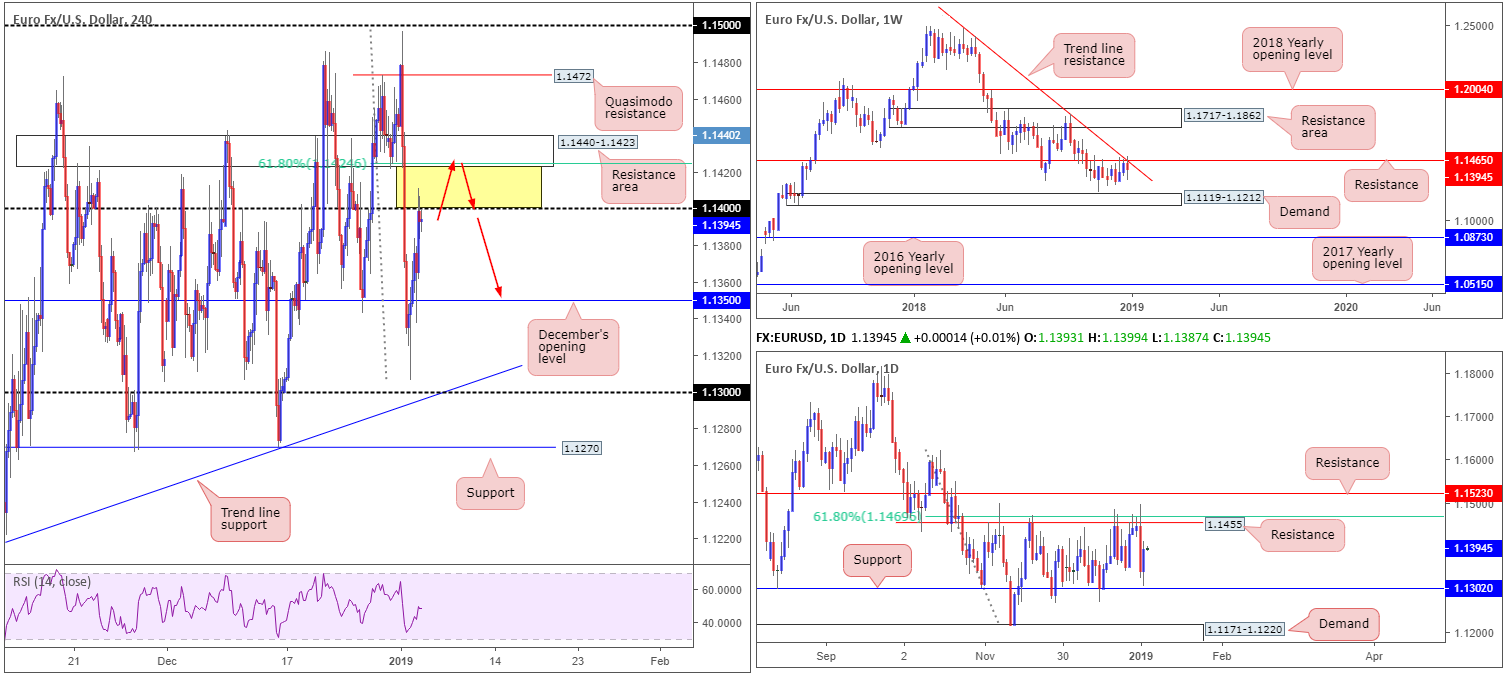
EUR/USD:
Despite Wednesday’s blip lower in EUR/JPY which led the EUR/USD to a session low of 1.1306, buyers put up a strong fight Thursday and reclaimed a large portion of lost ground. The unit picked up the pace following a dismal US ISM Manufacturing reading (54.1 vs. expected 57.7), allowing H4 action to shake hands with the underside of 1.14.
Though the H4 candles are visibly respecting 1.14 in early Asia, directly above this number rests an attractive resistance area at 1.1440-1.1423 that holds a 61.8% Fibonacci resistance at 1.1424 within. The area between the two barriers (yellow) likely contains a truckload of stop-loss order from those attempting to fade 1.14. In addition, we also believe a collection of buy orders from traders looking to play any breakout above 1.14 reside within this area as well.
Weekly movement remains languishing beneath resistance at 1.1465, which happens to overlap with a trend line resistance (etched from the high 1.2476). Further selling from this point has demand at 1.1119-1.1212 to target. The outlook on the daily chart, however, places the market within a reasonably firm range between resistance at 1.1455 (converging 61.8% Fibonacci resistance value at 1.1469) and support located at 1.1302.
Areas of consideration:
On the bigger picture, the research team remains biased to the downside until weekly resistance mentioned above at 1.1465 is violated.
Medium term (H4), nonetheless, we feel a fakeout above 1.14 into the H4 resistance area at 1.1440-1.1423 is appealing for a bounce lower (red arrows). Stop-loss order placement appears best above 1.1440, with the expectation of a H4 close forming beneath 1.14 to reduce risk to breakeven. Beyond 1.14, the next support target falls in around December’s opening level at 1.1350.
Today’s data points: EUR CPI Flash Estimate y/y; EUR Core CPI Flash Estimate y/y; US Average Hourly Earnings m/m; US Non-Farm Employment Change; US Unemployment Rate; Fed Chair Powell Speaks; FOMC Member Bostic Speaks.
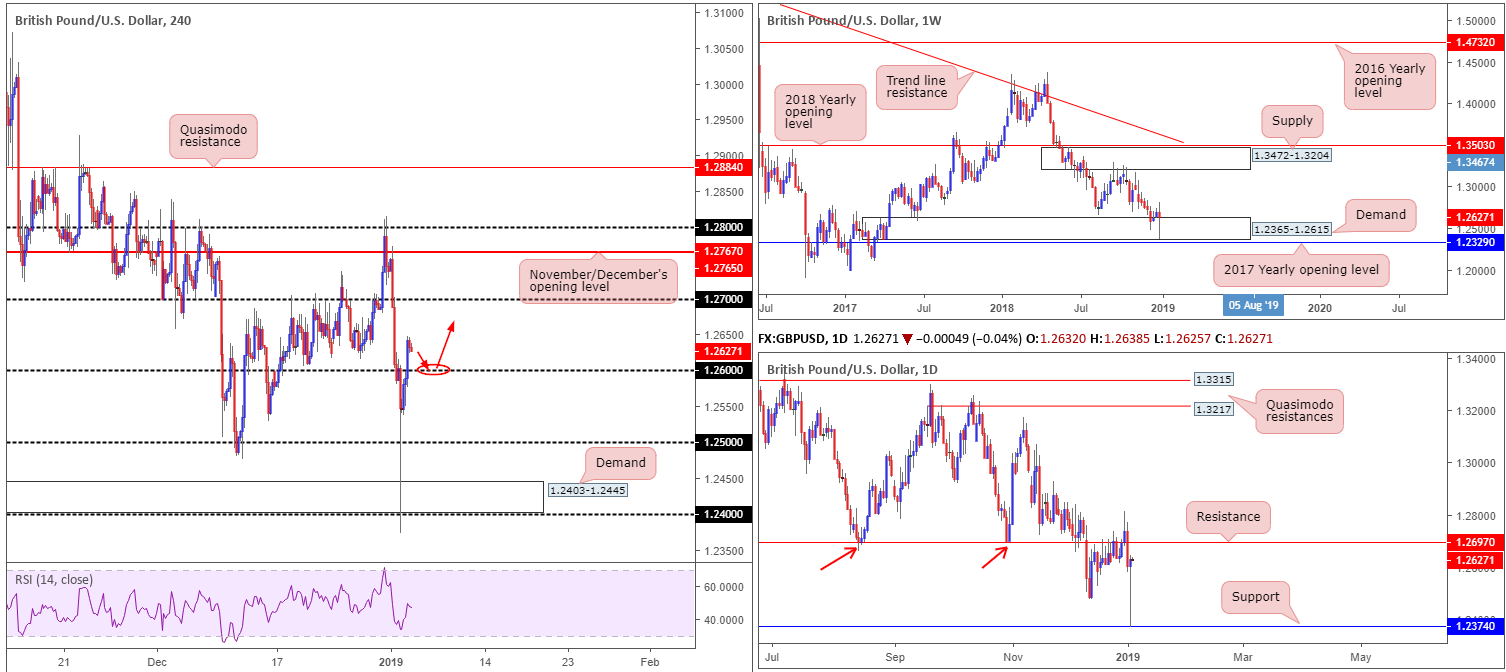
GBP/USD:
In recent sessions, the British pound recouped all of its lost ground from the so-called ‘flash crash’ observed in early Asian hours Thursday that struck lows of 1.2373. Broad-based USD softness, influenced by a dismal US ISM Manufacturing reading (54.1 vs. expected 57.7), enabled H4 action to reclaim 1.26 to the upside into the closing bell.
According to our technical reading the market is displaying signs it wants to explore higher ground. Weekly movement checked in with the lower limits of a demand area seen at 1.2365-1.2615. Assuming buyers remain defensive here, a run towards supply painted at 1.3472-1.3204 may be in store. In terms of where we stand on the daily timeframe, yesterday’s action chalked up a nice-looking bullish pin-bar formation off support drawn from 1.2374, with room on this timeframe seen to extend to resistance plotted at 1.2697.
Across the charts, H4 price is seen hovering above 1.26. A retest of this number as support today (red arrows) by way of a H4 bullish candlestick formation (entry/stop parameters can be defined according to this pattern), would likely be viewed as an attractive long, targeting 1.27 on this timeframe.
Areas of consideration:
In view of both weekly and daily price showing signs of further upside, a long on any retest seen at 1.26, as highlighted above, is considered high probability. As for take-profit targets, the research team are looking at daily resistance drawn from 1.2697 as the initial port of call, followed closely by 1.27 on the H4 timeframe.
Today’s data points: UK Net Lending to Individuals m/m; UK Services PMI; US Average Hourly Earnings m/m; US Non-Farm Employment Change; US Unemployment Rate; Fed Chair Powell Speaks; FOMC Member Bostic Speaks.
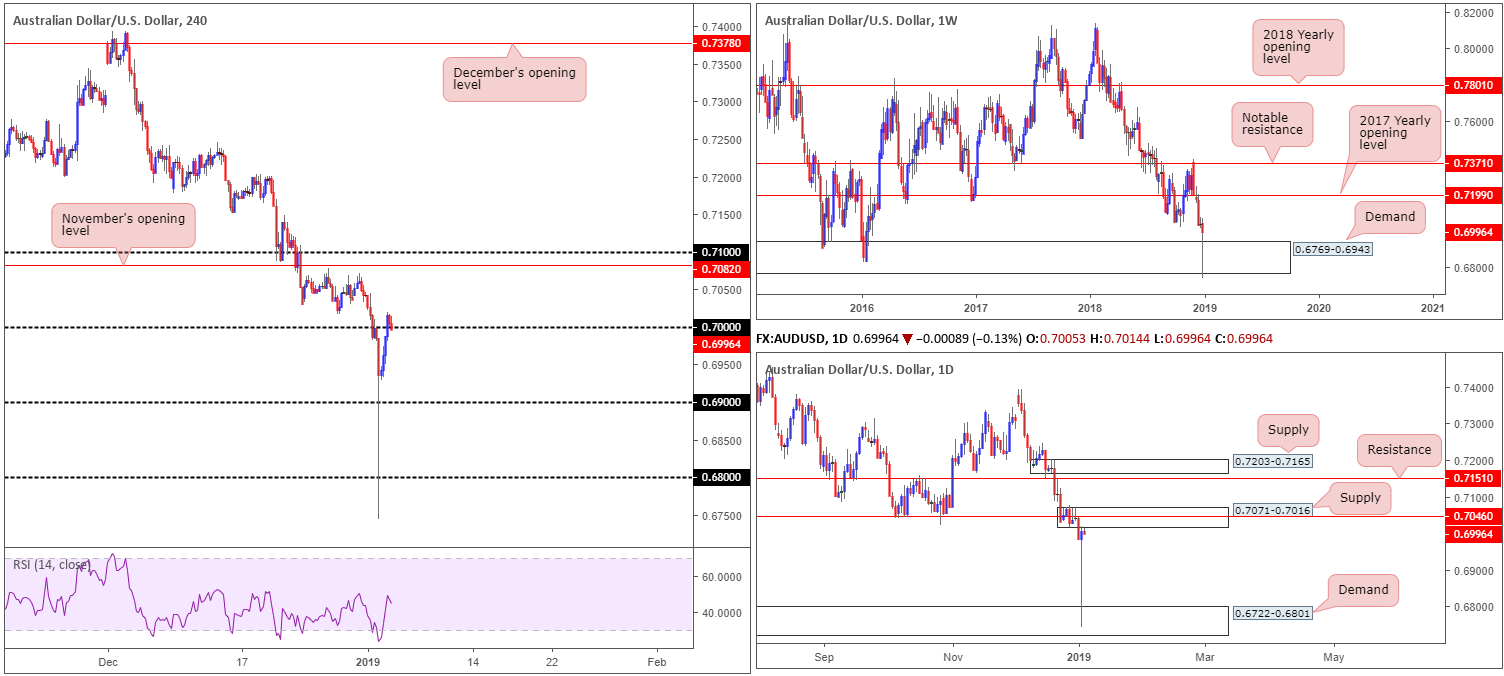
AUD/USD:
In similar fashion to the GBP/USD, the AUD/USD recovered all lost ground following Thursday’s lemming-like stampede.
The key observation on the weekly timeframe is demand coming in at 0.6769-0.6943. Though price action marginally breached the lower edge of this zone during yesterday’s movement, the move was probably not sufficient enough to take out stop-loss orders on this scale
Lower down on the curve, daily flow rebounded beautifully from a demand base at 0.6722-0.6801 (extended from March of 2009) in the shape of a pin-bar formation. By and of itself, this is likely enough to excite candlestick enthusiasts, though given daily flow connected with supply at 0.7071-0.7016, which happens to hold additional resistance at 0.7046 within, buyers may struggle to lift this market higher.
A closer reading reveals H4 activity reclaimed 0.70 into the closing stages of Thursday. This number, as you’re probably aware, draws a huge amount of attention from both sides of the market: traders looking to fade and buy the breakout.
Areas of consideration:
In light of our technical reading, equal opportunity to trade both long and short around 0.70 is a possibility. Buyers here have weekly demand backing a trade, while sellers bring with them daily supply and resistance.
Irrespective of which direction you select, waiting for additional candlestick confirmation is recommended. That way not only do we have intent, we also have clear entry and stop parameters as defined by the candlestick pattern.
Today’s data points: US Average Hourly Earnings m/m; US Non-Farm Employment Change; US Unemployment Rate; Fed Chair Powell Speaks; FOMC Member Bostic Speaks.
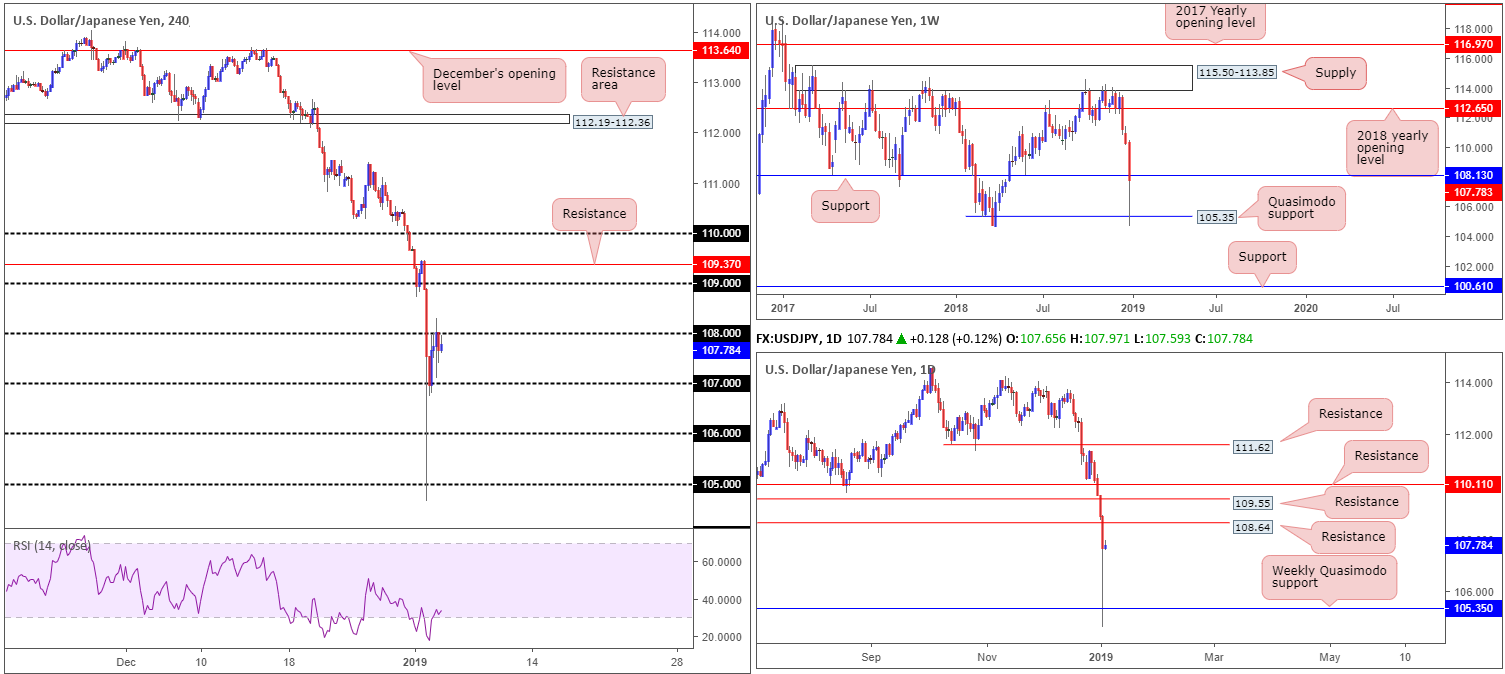
USD/JPY:
The US dollar recovered in strong fashion after Thursday’s so called ‘flash crash’ witnessed in early Asia. Despite several attempts from the buyers, though, they were unable to overthrow 108 on the H4 timeframe in spite of price popping as high as 108.30 at one point. A violation of 108 today could lead to a move materializing towards 109, shadowed closely by resistance at 109.37.
Against the backdrop of intraday flow, the weekly Quasimodo support at 105.35 entered the fold Thursday and has so far offered a strong floor to this market. It may be worth noting, however, the unit has yet to reclaim the recently shattered weekly support at 108.13. Daily movement, on the other hand, exhibits room to press as far north as resistance priced in at 108.64. This level is essentially a Quasimodo support-turned resistance.
Areas of consideration:
Similar to Thursday’s outlook, our technical reading shows possible buying opportunities above 108. A H4 close beyond this number that’s followed up with a retest (preferably in the shape of a bullish candlestick formation – entry/stop parameters can be defined according to this pattern) is likely to be sufficient enough to justify a buy in this market, targeting 108.64 (the daily resistance) as the initial upside target. Traders are, however, reminded to keep risk/reward considerations in mind, targeting at least a 1:1 ratio towards the first take-profit zone.
Today’s data points: US Average Hourly Earnings m/m; US Non-Farm Employment Change; US Unemployment Rate; Fed Chair Powell Speaks; FOMC Member Bostic Speaks.
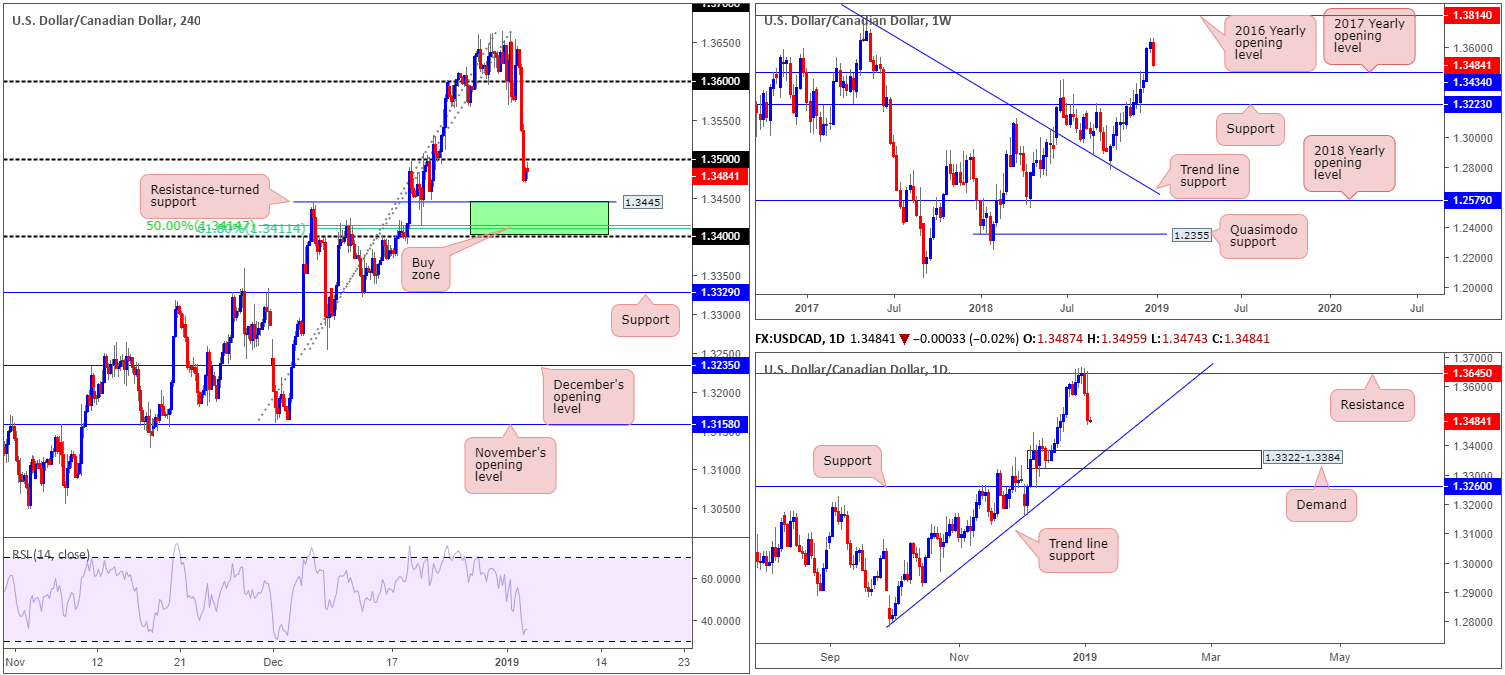
USD/CAD:
Dismal US ISM Manufacturing PMI data, along with oil extending recent gains, pulled the USD/CAD southbound amid US trading hours Thursday, registering its second consecutive daily loss and conquering both 1.36 and 1.35. This, on the H4 scale, exposes nearby support at 1.3445, followed closely by a 61.8% Fibonacci support value at 1.3411, a 50.0% support value at 1.3414 and the 1.34 handle (green). It may also interest some traders to note the RSI indicator is seen fast approaching its oversold limit.
Interestingly, within the green H4 zone, the research team also notes weekly support standing at 1.3434 in the form of the 2017 yearly opening level. The only grumble here, according to our technical markings, is a fakeout under 1.34 could come to fruition as daily price may look to test the top edge of its demand area seen at 1.3322-1.3384 (merges closely with trend line support extended from the low 1.2782).
Areas of consideration:
Ultimately, the green zone highlighted above between 1.34/1.3445 is of interest today. Given the threat of a potential fakeout play being seen below 1.34 into daily demand at 1.3384, however, traders may wish to wait for additional candlestick confirmation before pulling the trigger. By doing so, you have clear entry/stop levels (as defined by the candlestick structure) and possible intent. In regard to take-profit targets out of 1.34/1.3445, the underside of 1.35 is an option.
Today’s data points: US Average Hourly Earnings m/m; US Non-Farm Employment Change; US Unemployment Rate; Fed Chair Powell Speaks; FOMC Member Bostic Speaks; CAD Employment Change; CAD Unemployment Rate; CAD RMPI m/m.
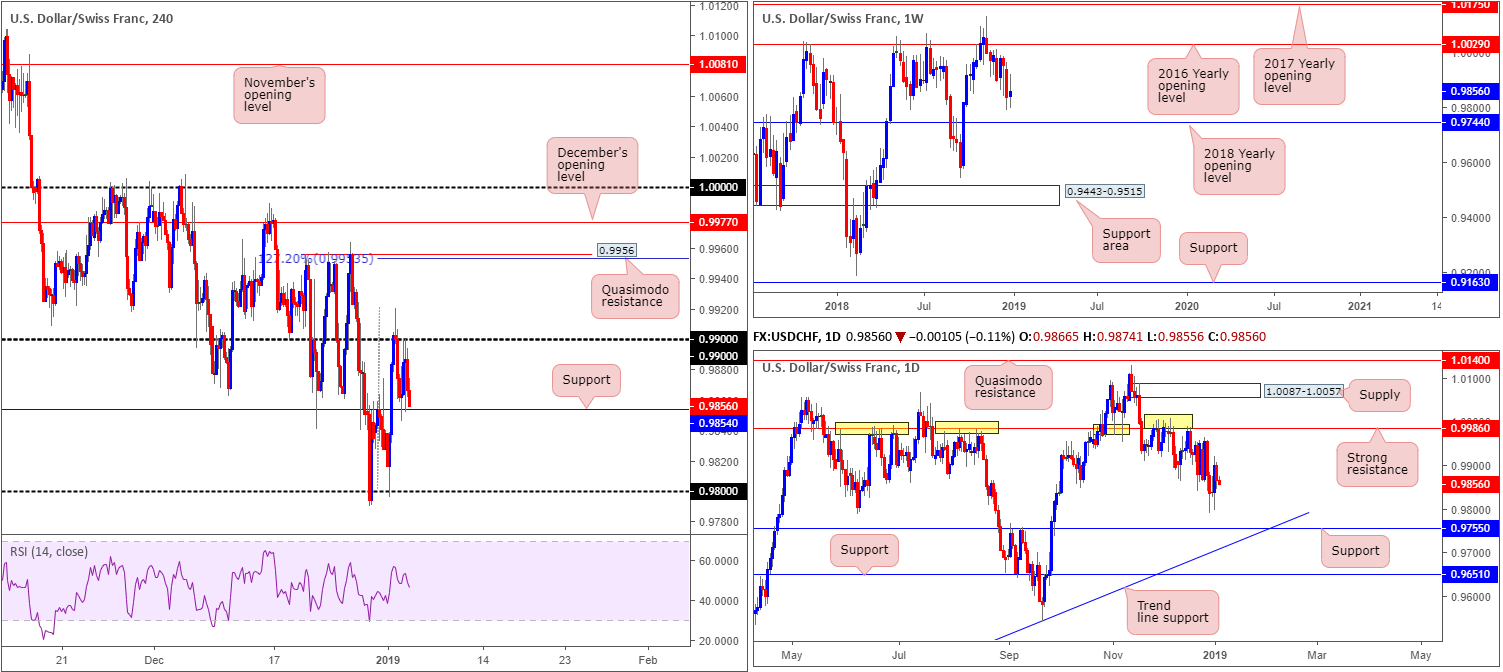
USD/CHF:
Trading volume, as you can see, diminished amid Thursday’s sessions as buyers and sellers battled for position between the 0.99 handle and H4 support priced in at 0.9854. Areas of interest outside of this intraday range fall in at a Quasimodo resistance carved from 0.9956 (also holds a 127.2% Fibonacci ext. point at 0.9953) and the 0.98 handle (support).
It is likely intraday traders will be looking to trade the limits of the current H4 range today, at least until the US non-farm payrolls report hits the wires. Overall, though, the research team believes price will eventually look to discover lower ground, in view of where the market is sited on the higher timeframes. Weekly flow shows room to press as far south as the 2018 yearly opening level at 0.9744. By the same token, daily action also shows space to attack support coming in at 0.9755, which happens to fuse closely with a trend line support (extended from the low 0.9187).
Areas of consideration:
On account of the above reading, should the H4 candles close beneath support at 0.9854, further selling is likely to be observed towards 0.98. Traders have the choice of either selling the breakout candle (and placing stop-loss orders beyond the breakout candle’s wick), or, more conservatively, wait and see if a retest play to the underside of 0.9854 takes shape before pulling the trigger (preferably in the shape of a bearish candlestick formation as this helps with entry/stop placement). Irrespective of the entry method chosen, traders are urged to ensure they have at least a 1:1 risk/reward ratio to 0.98.
Today’s data points: US Average Hourly Earnings m/m; US Non-Farm Employment Change; US Unemployment Rate; Fed Chair Powell Speaks; FOMC Member Bostic Speaks.
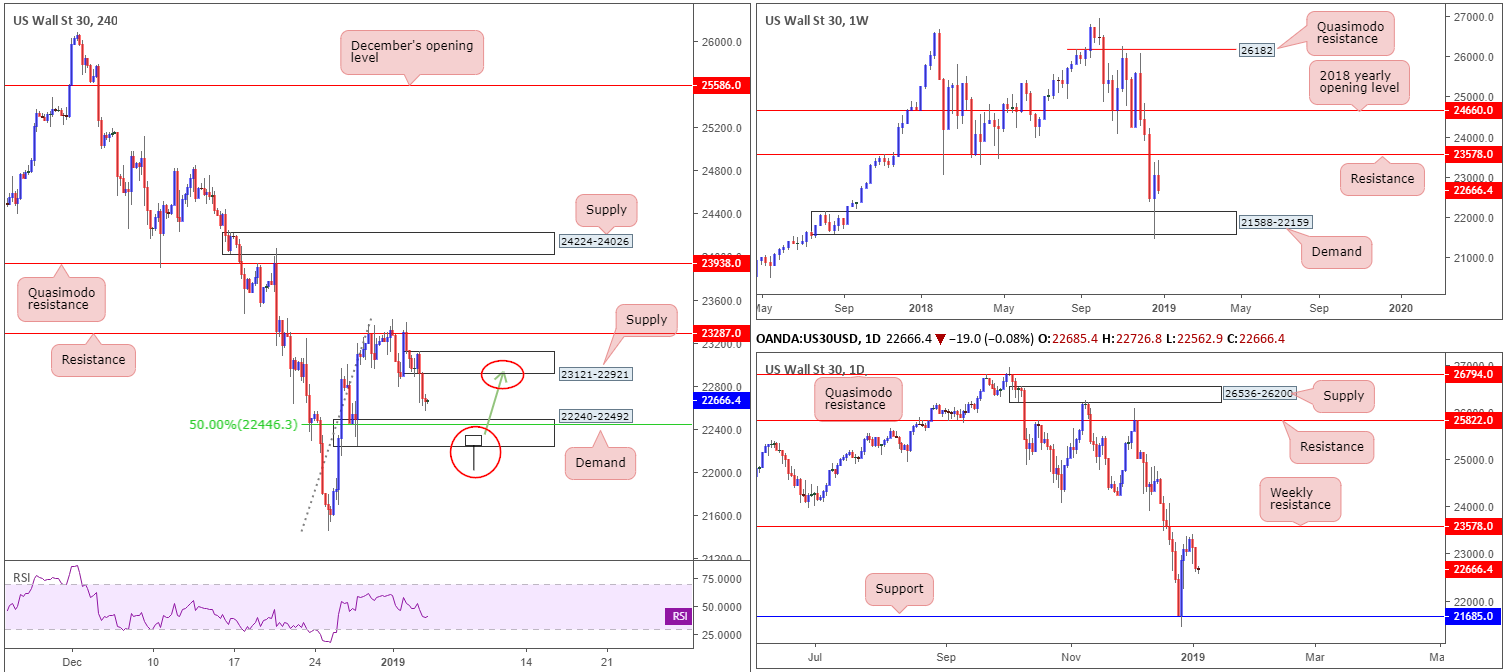
Dow Jones Industrial Average:
US benchmarks concluded Thursday’s segment firmly in negative territory, following Apple’s Tim Cook announcing a downgrade in quarterly projections, largely on the back of US/China trade tensions. H4 flow extended Wednesday’s rejection off resistance at 23287 yesterday, placing the candles just north of demand at 22240-22492 into the close, which happens to intersect with a 50.0% support value at 22446.
Although the current H4 demand is likely to entice buyers into the market for at least a bounce, the area lacks higher-timeframe support unfortunately. In fact, the zone is ominously positioned just north of a weekly demand coming in at 21588-22159. This, therefore, has ‘fakeout’ written all over it as higher-timeframe structure tends to take precedence over its lower-timeframe counterparts.
Areas of consideration:
Entering long from the current H4 demand has an incredibly strong red flag against it knowing weekly demand is lurking just beneath it. With that being the case, should a H4 bullish pin bar formation take shape that pierces through the lower edge of the said H4 demand and tags the top edge of weekly demand (see H4 chart for a visual), there’s a high probability buyers will enter the fold and look to lift this market higher, targeting H4 supply at 23121-22921 as the first port of call.
Today’s data points: US Average Hourly Earnings m/m; US Non-Farm Employment Change; US Unemployment Rate; Fed Chair Powell Speaks; FOMC Member Bostic Speaks.
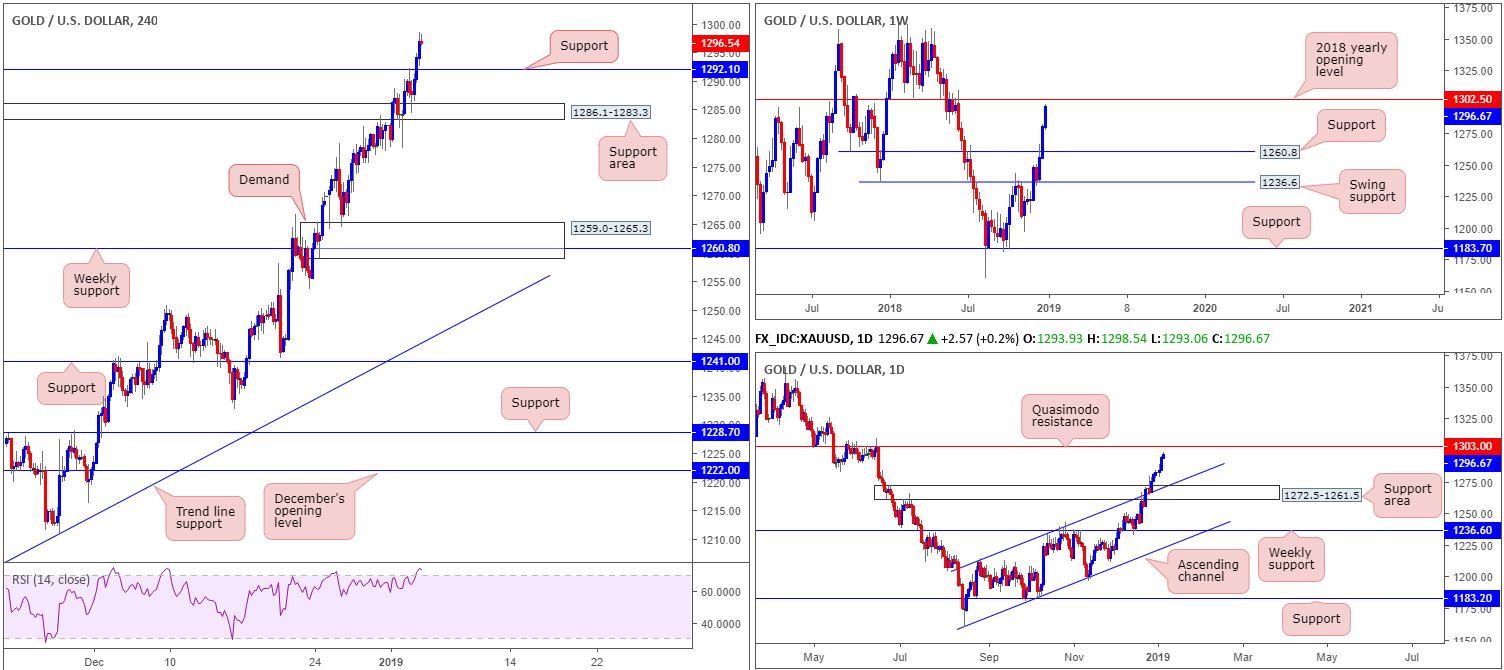
XAU/USD (Gold):
The yellow metal continues to explore higher ground this week, up 1.30% thus far against its US counterpart.
While the bulls remain on strong footing, weekly resistance at 1302.5 (the 2018 yearly opening level) suggests bullion’s days in the sun may be numbered. A similar picture is also present on the daily timeframe: the unit is seen fast approaching a Quasimodo resistance priced in at 1303.0.
Having seen the H4 candles rebound from a nearby support area coming in at 1286.1-1283.3 and overthrow resistance at 1292.1 (now acting support), a retest play could, therefore, be in the offing today.
Areas of consideration:
Keeping it as simple as possible, the research team has discovered a possible buying opportunity should the H4 candles retest support mentioned above at 1292.1. A retest of this number in the shape of a bullish candlestick (entry/stop parameters can be defined according to this pattern) formation (prior to striking the 2018 yearly opening level at 1302.5 on the weekly timeframe) is, according to our technical reading, a high-probability buying opportunity, targeting 1302.5/1303.0. Traders are, however, urged to consider risk/reward considerations prior to pulling the trigger. Aim for at least a 1:1 ratio or more before resistance enters the fold.
The use of the site is agreement that the site is for informational and educational purposes only and does not constitute advice in any form in the furtherance of any trade or trading decisions.
The accuracy, completeness and timeliness of the information contained on this site cannot be guaranteed. IC Markets does not warranty, guarantee or make any representations, or assume any liability with regard to financial results based on the use of the information in the site.
News, views, opinions, recommendations and other information obtained from sources outside of www.icmarkets.com.au, used in this site are believed to be reliable, but we cannot guarantee their accuracy or completeness. All such information is subject to change at any time without notice. IC Markets assumes no responsibility for the content of any linked site. The fact that such links may exist does not indicate approval or endorsement of any material contained on any linked site.
IC Markets is not liable for any harm caused by the transmission, through accessing the services or information on this site, of a computer virus, or other computer code or programming device that might be used to access, delete, damage, disable, disrupt or otherwise impede in any manner, the operation of the site or of any user’s software, hardware, data or property.


