
DXY:
The DXY instrument is currently in a bearish trend, with a potential for a bearish continuation towards the 1st support level at 102.00. This support level serves as a pullback support and aligns with the 23.60% Fibonacci Retracement level.
If the price declines past the 1st support, the 2nd support level at 101.46, also acting as an overlap support, is expected to prevent further decline. This level aligns with the 38.20% Fibonacci Retracement.
On the other hand, if the price starts to rise, the 1st resistance at 102.77, functioning as an overlap resistance, might hinder bullish progression. This level coincides with the 78.60% Fibonacci Retracement. If the price surges past this resistance, the 2nd resistance at 103.44, which corresponds to a multi-swing high resistance, could pose an additional obstacle.

EUR/USD:
The EUR/USD pair is currently showing a bullish trend. However, in the short term, we could potentially see a drop towards the 1st support level at 1.0918. This support level acts as an overlap support which may hold the price.
If the price breaks below the 1st support level, we can expect the 2nd support at 1.0838 (a multi-swing low support) to act as a strong barrier to prevent further decline.
If the price bounces off from the support levels, the 1st resistance to challenge the bulls would be at 1.0959. This level serves as an overlap resistance and is also in line with the 78.60% Fibonacci Projection level.
Should the price move beyond this point, the 2nd resistance at 1.1034 (also an overlap resistance) could pose a further obstacle to upward price movement.
.

EUR/JPY:
EUR/JPY exhibits a bullish momentum on the chart and there is potential for a bullish bounce off the 1st support and a move towards the 1st resistance.
The 1st support level is at 155.89 and can be identified as an overlap support, which coincides with the 23.60% Fibonacci retracement level, potentially providing a strong base for the price.
If the price drops further, the 2nd support level at 155.08, being a pullback support and aligning with the 38.20% Fibonacci retracement level, could provide a strong floor for the price.
On the upside, the 1st resistance is at 157.50. This level serves as a multi-swing high resistance and is in line with the 100% Fibonacci projection level, indicating a significant level for potential price reversal.
Should the bullish momentum continue, the 2nd resistance level to watch would be at 158.05. This level is a multi-swing high resistance and could provide another target for buyers.

EUR/GBP:
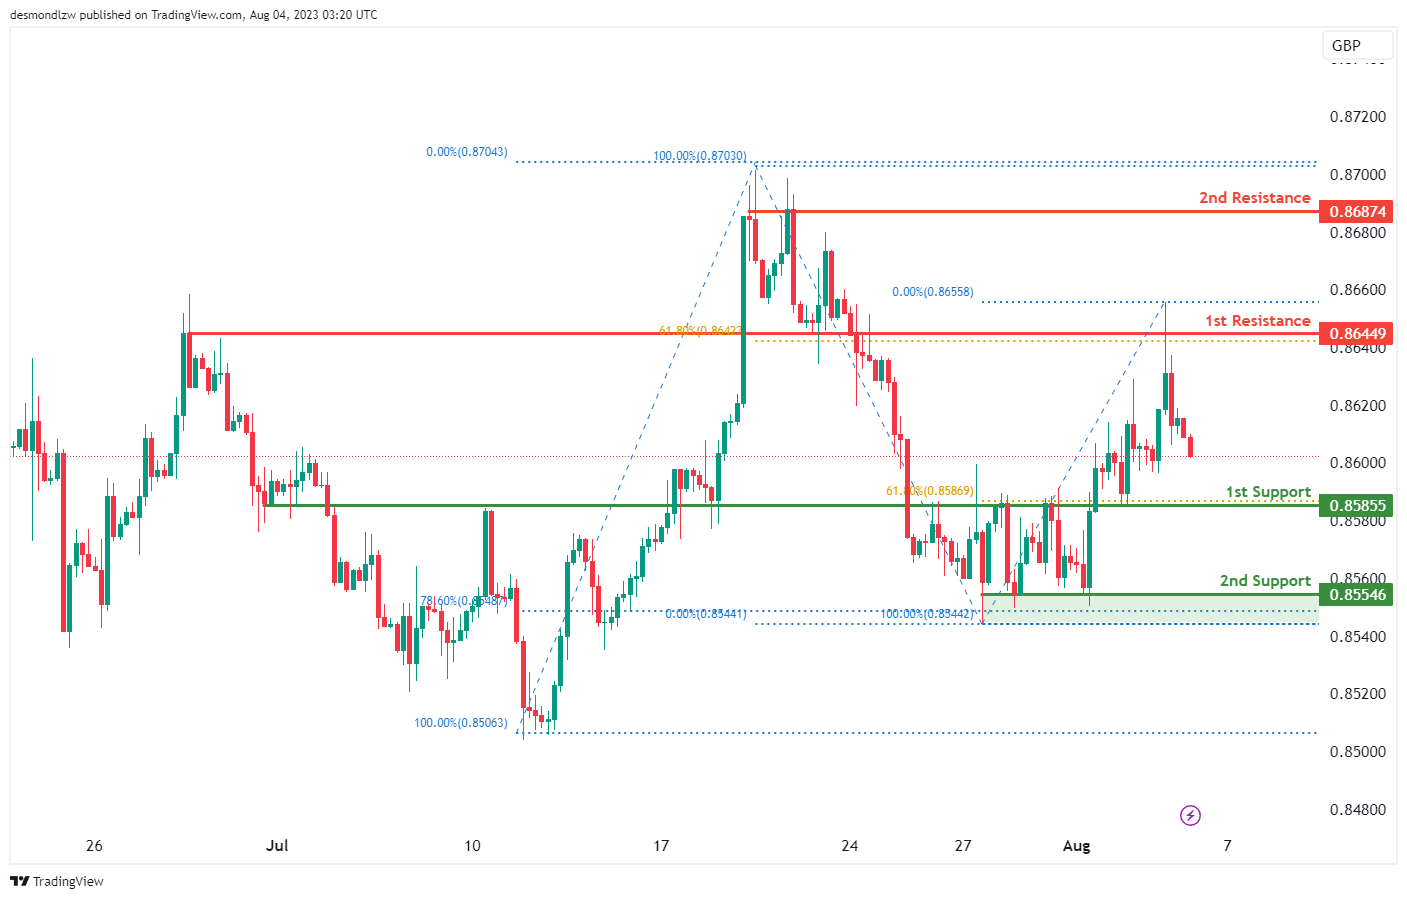
The EUR/GBP chart exhibits a bearish momentum and there is potential for a bearish continuation towards the 1st support.
The 1st support level is at 0.8585 and it can be identified as an overlap support, coinciding with the 61.80% Fibonacci retracement level. This confluence could potentially provide a strong floor for the price.
Should the price decline further, the 2nd support level is at 0.8554. This level, being a multi-swing low support and aligning with the 38.20% Fibonacci retracement level, could provide another base for the price.
On the upside, the 1st resistance level is at 0.8644. This level serves as an overlap resistance and coincides with the 61.80% Fibonacci retracement level, indicating a significant level for potential price rejection.
Should the bearish momentum stall and a reversal occur, the 2nd resistance level to watch would be at 0.8687.
GBP/USD:
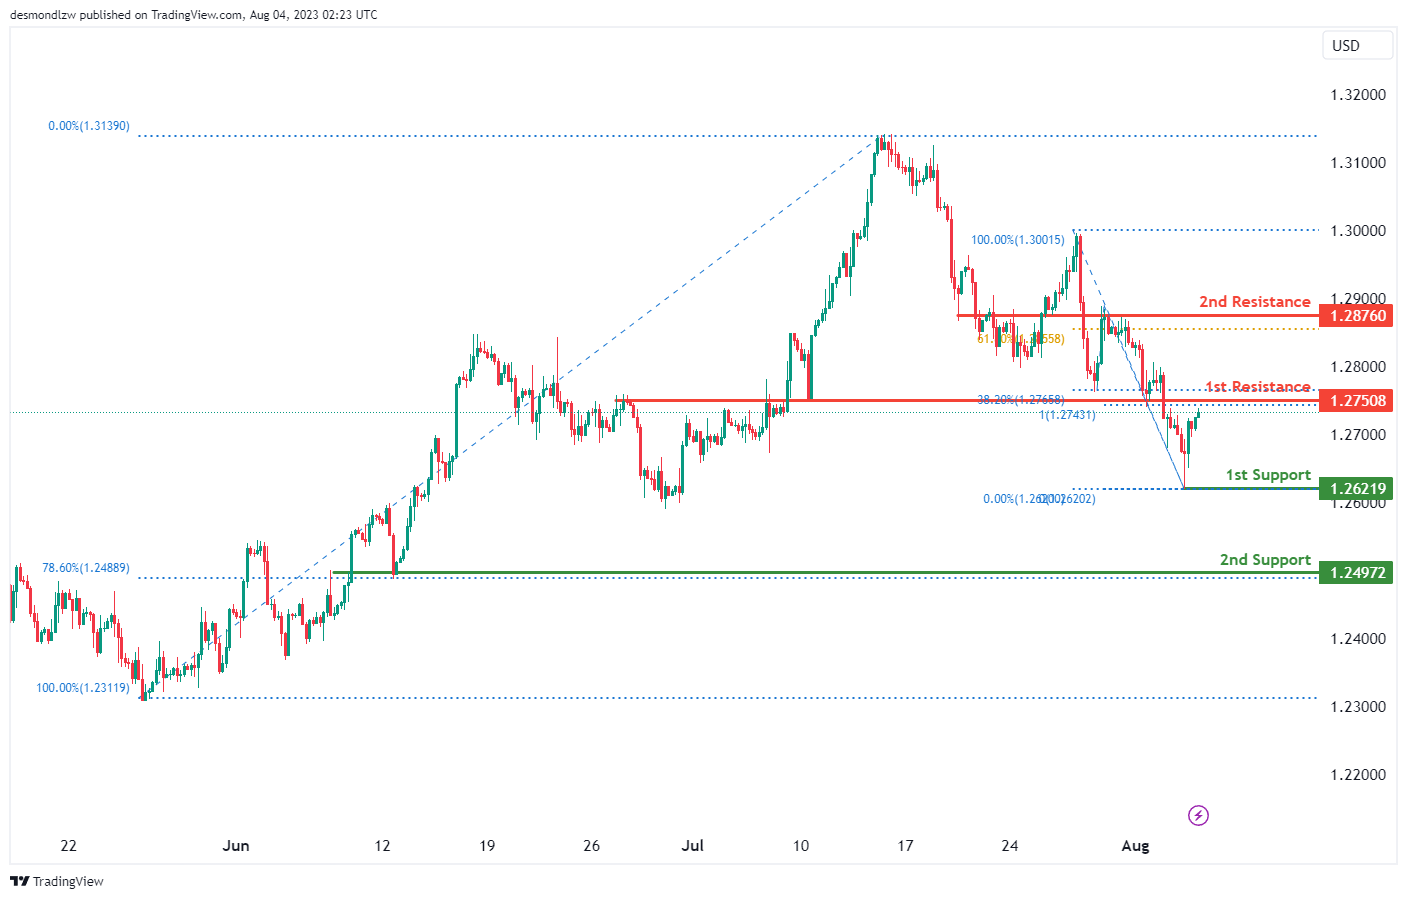
The GBP/USD pair currently shows a bullish trend. However, in the short term, we might see a drop towards the 1st support level at 1.2621, which serves as a swing low support, before it bounces back towards the resistance levels.
If the price dips below the 1st support level, the next potential floor is the 2nd support at 1.2497. This is an overlap support and also corresponds to the 78.60% Fibonacci retracement level, providing a solid barrier against further price decline.
On the other hand, if the price rebounds off from the support levels and starts ascending, the 1st resistance level at 1.2750 could pose a challenge to the bulls. This level acts as an overlap resistance and aligns with the 38.20% Fibonacci retracement and 100% Fibonacci projection levels, indicating a potential area of Fibonacci confluence.
Should the price momentum remain bullish and break through the 1st resistance, the 2nd resistance at 1.2876 (an overlap resistance corresponding to the 61.80% Fibonacci retracement level) could stand as the next hurdle for the bulls.
GBP/JPY:
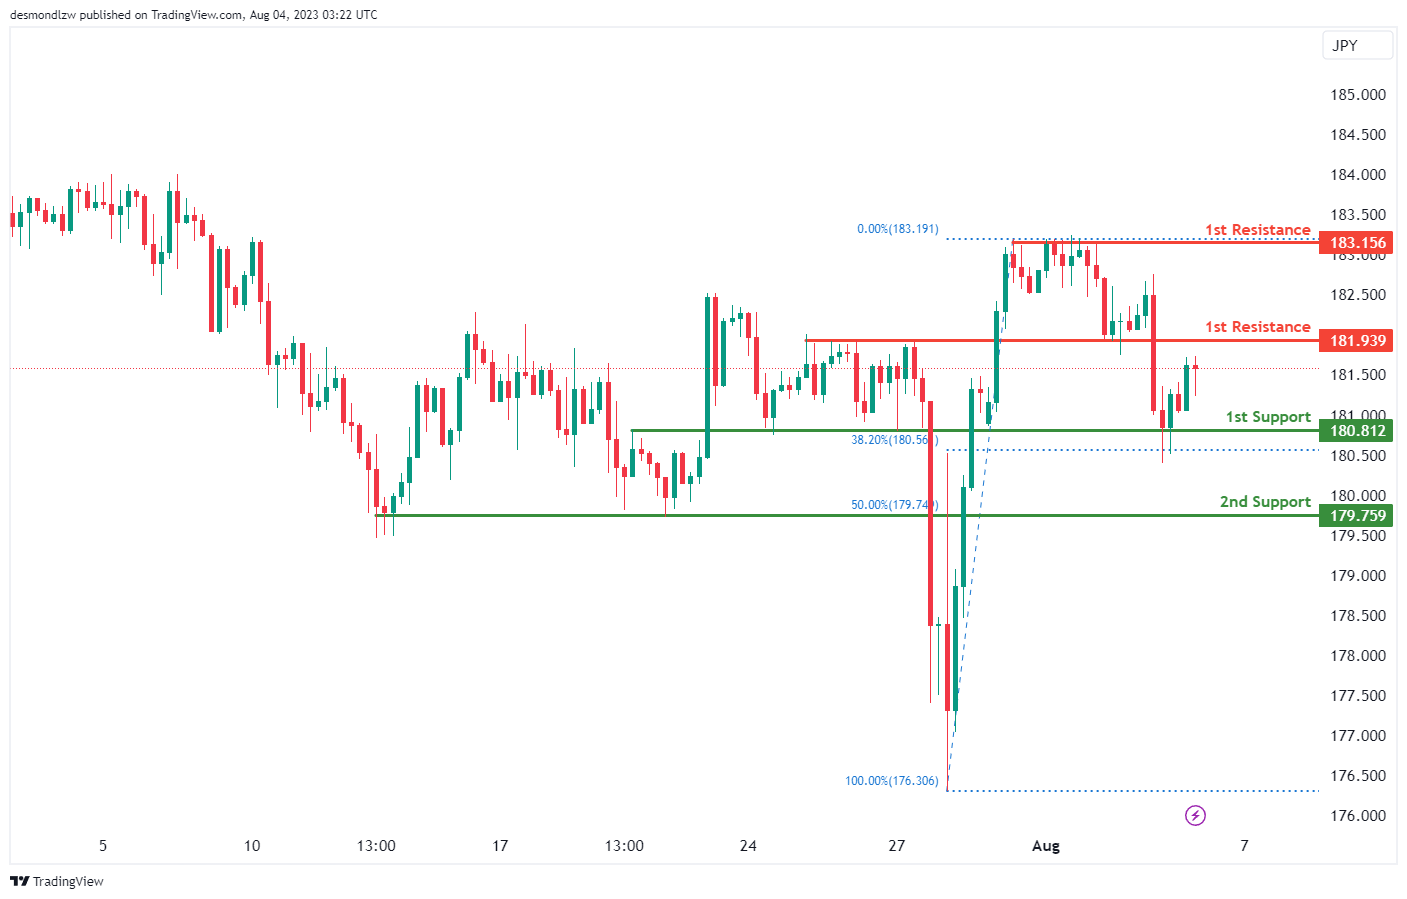
The GBP/JPY chart shows a bullish momentum, indicating potential for a bullish continuation towards the 1st resistance.
The 1st support level is at 180.81. This overlap support level aligns with the 38.20% Fibonacci retracement, making it a significant price level.
If the price drops further, the 2nd support level is at 179.75. This is considered a pullback support and coincides with the 50% Fibonacci retracement, providing another substantial price floor.
On the upside, the 1st resistance level is at 181.93. This pullback resistance could serve as an initial barrier for the price on its upward path.
If the bullish momentum continues and the price breaks through the 1st resistance, the 2nd resistance to watch is at 183.15. This multi-swing high resistance level could potentially halt the price rise or induce a price reversal.
USD/CHF:
The USD/CHF pair is currently on a bearish trend, which suggests that the price might continue to decline towards the 1st support level.
The 1st support level is at 0.8698, which serves as a pullback support, and also coincides with the 38.20% Fibonacci retracement level. This creates a potentially strong barrier against the further downward movement of the price.
If the price manages to break below the 1st support, the next key level to watch would be the 2nd support at 0.8631, which is also a pullback support.
In the event of a trend reversal and the price starts to rise, it may encounter resistance at the 1st resistance level of 0.8793. This level is considered as a swing high resistance, which could halt the upward movement of the price.
Should the upward momentum continue to the point of surpassing the 1st resistance, the next hurdle would be at the 2nd resistance level at 0.8868, which serves as a pullback resistance.

USD/JPY:
The USD/JPY pair is currently demonstrating a bearish trend, suggesting a continuation of this trend towards the 1st support level.
The 1st support level is at 141.94 and this has been determined as an overlap support, which has proven to be a strong barrier in the past, making it a significant level for traders to observe.
If the price breaks through this 1st support, the 2nd support level is at 140.79. This level is a pullback support and aligns with both the 50% Fibonacci retracement and 78.6% Fibonacci expansion. This confluence of Fibonacci levels adds to the credibility of this support level.
On the flip side, if there is a reversal of trend and the price begins to rise, the 1st resistance level is at 143.86, which is an overlap resistance. This could prove to be a significant obstacle for upward price movement.
Should the price manage to breach this 1st resistance, the 2nd resistance at 144.86 could come into play.

USD/CAD:
The USD/CAD pair is currently in a bearish trend, indicating a possible continuation of this trend towards the 1st support level.
The 1st support level is at 1.3270, identified as a pullback support. This is additionally reinforced by the 50% Fibonacci retracement level, suggesting it could be a significant level for traders to watch.
If the price breaks below this level, the 2nd support level is at 1.3253. This level has been recognized as a multi-swing low support, adding to its potential credibility.
On the other hand, if the trend reverses and the price starts to rise, the 1st resistance level is at 1.3377. This level is identified as a swing high resistance, making it a potential obstacle for an upward price movement.
Should the price break above this level, the 2nd resistance at 1.3447 may come into play. This level is an overlap resistance and could prove challenging for the bullish momentum to

AUD/USD:
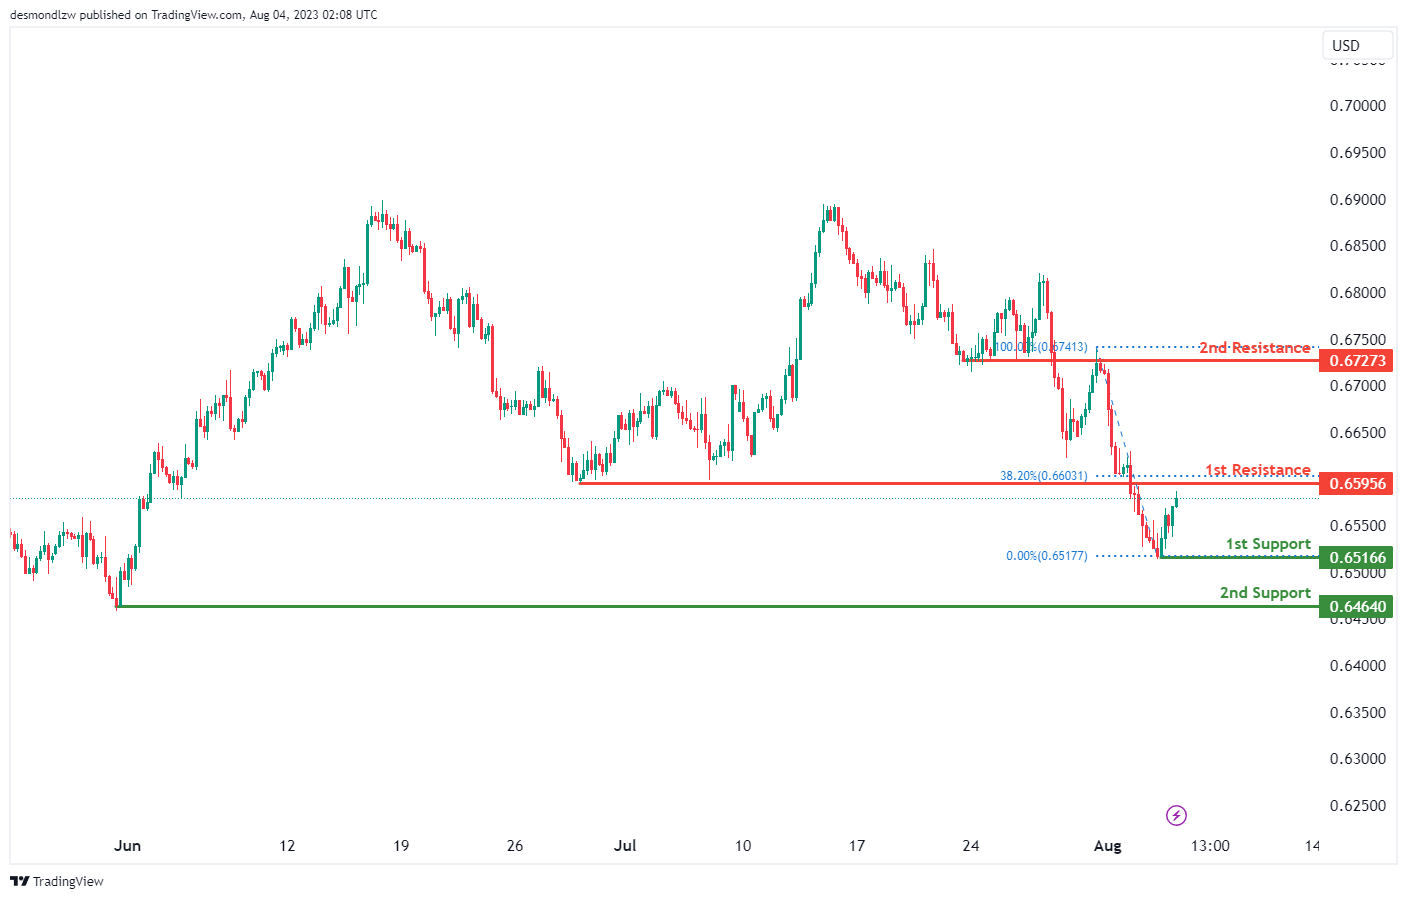
The AUD/USD pair is currently demonstrating a bearish trend. The expectation is for a bearish reaction off the 1st resistance level leading to a drop to the 1st support level.
The 1st support level is at 0.6595, recognized as a pullback support. This level might see an increase in buying pressure if the price continues to fall.
If the price breaches this level, the 2nd support level is at 0.6464. This level has been identified as a swing low support, indicating it could be a significant level for traders to monitor.
On the contrary, if the trend reverses and the price starts to rise, the 1st resistance level is at 0.6595. This level is identified as a swing high resistance and further reinforced by the 38.20% Fibonacci retracement level. This means it could be a challenging hurdle for an upward price movement.
Should the price break above this level, the 2nd resistance at 0.6727 may come into focus. This level is recognized as an overlap resistance, potentially presenting an obstacle for bullish momentum to continue.
NZD/USD
The NZD/USD pair is currently showing a bullish trend. The expectation is for a bullish continuation towards the 1st resistance level.
The 1st support level is at 0.6064. This level is identified as a multi-swing low support, suggesting that this level might attract buying interest if the price retreats.
If the price breaches this level, the 2nd support level is at 0.5991. This level has been identified as another multi-swing low support, indicating it could be a significant level for traders to monitor if the 1st support level is broken.
On the other hand, if the bullish trend continues, the 1st resistance level is at 0.6132. This level is identified as a pullback resistance and is further reinforced by the 50% Fibonacci retracement and 78.60% Fibonacci expansion levels, indicating a strong Fibonacci confluence. This means it could pose a challenge for the price to break through.
Should the price surpass this level, the 2nd resistance is at 0.6220. This level is recognized as a swing high resistance, suggesting that it could be a tough level for the bullish momentum to overcome.

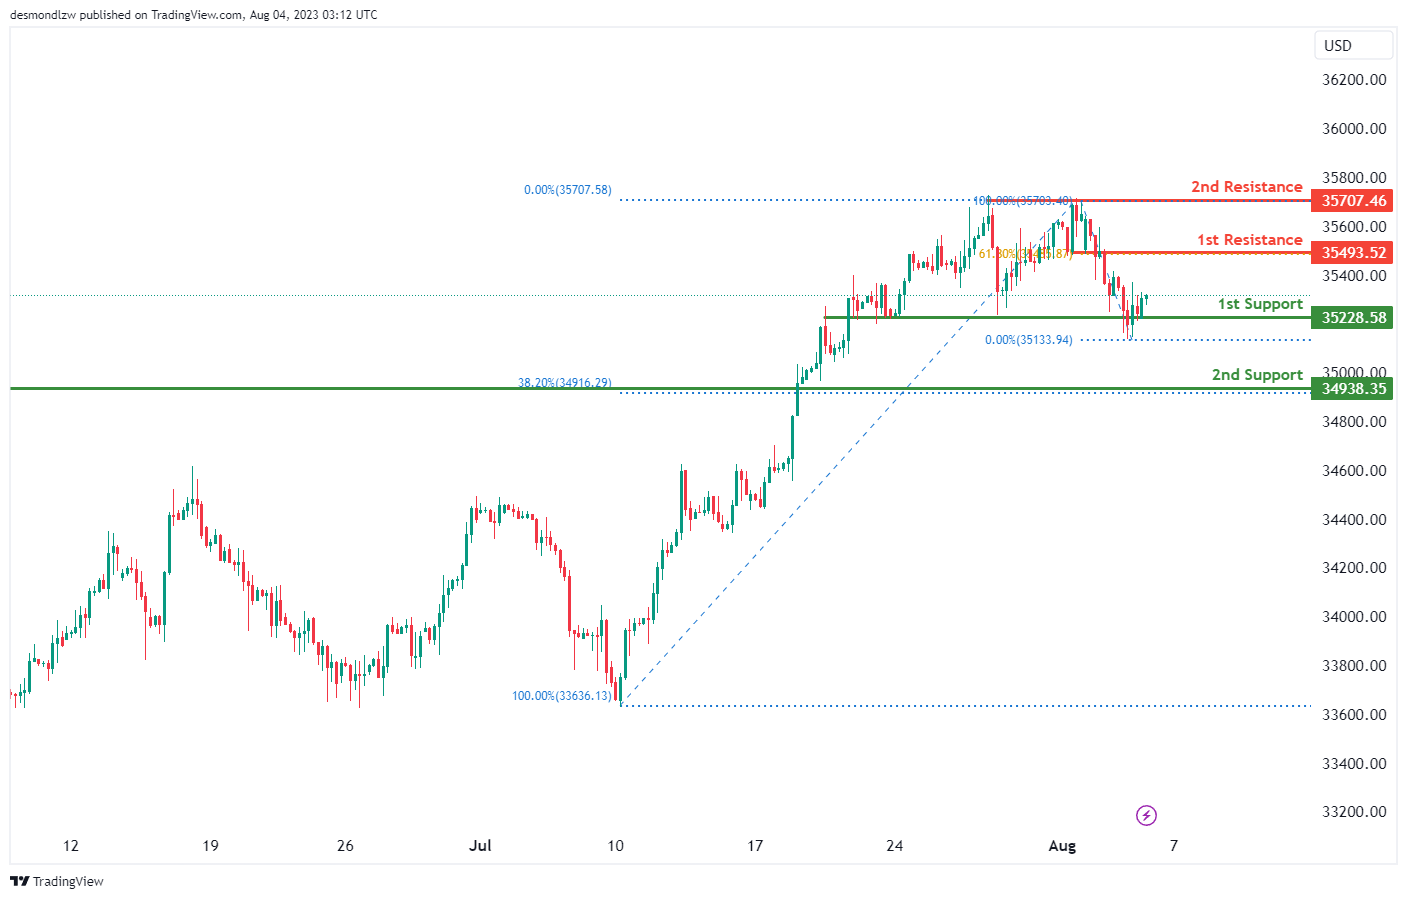
DJ30:
The DJ30 chart exhibits a bullish momentum, and there is potential for a bullish continuation towards the 1st resistance.
The 1st support level is at 35228.58 and is identified as an overlap support. This level could potentially provide a firm base for the price.
If the price retreats further, the 2nd support level is at 34938.35. This level, being a pullback support and aligning with the 38.20% Fibonacci retracement level, could offer another significant floor for the price.
On the upside, the 1st resistance level is at 35493.52. This level coincides with the 61.80% Fibonacci retracement level, indicating a significant level for potential price rejection or reversal.
Should the bullish momentum continue, the 2nd resistance level to watch would be at 35707.46
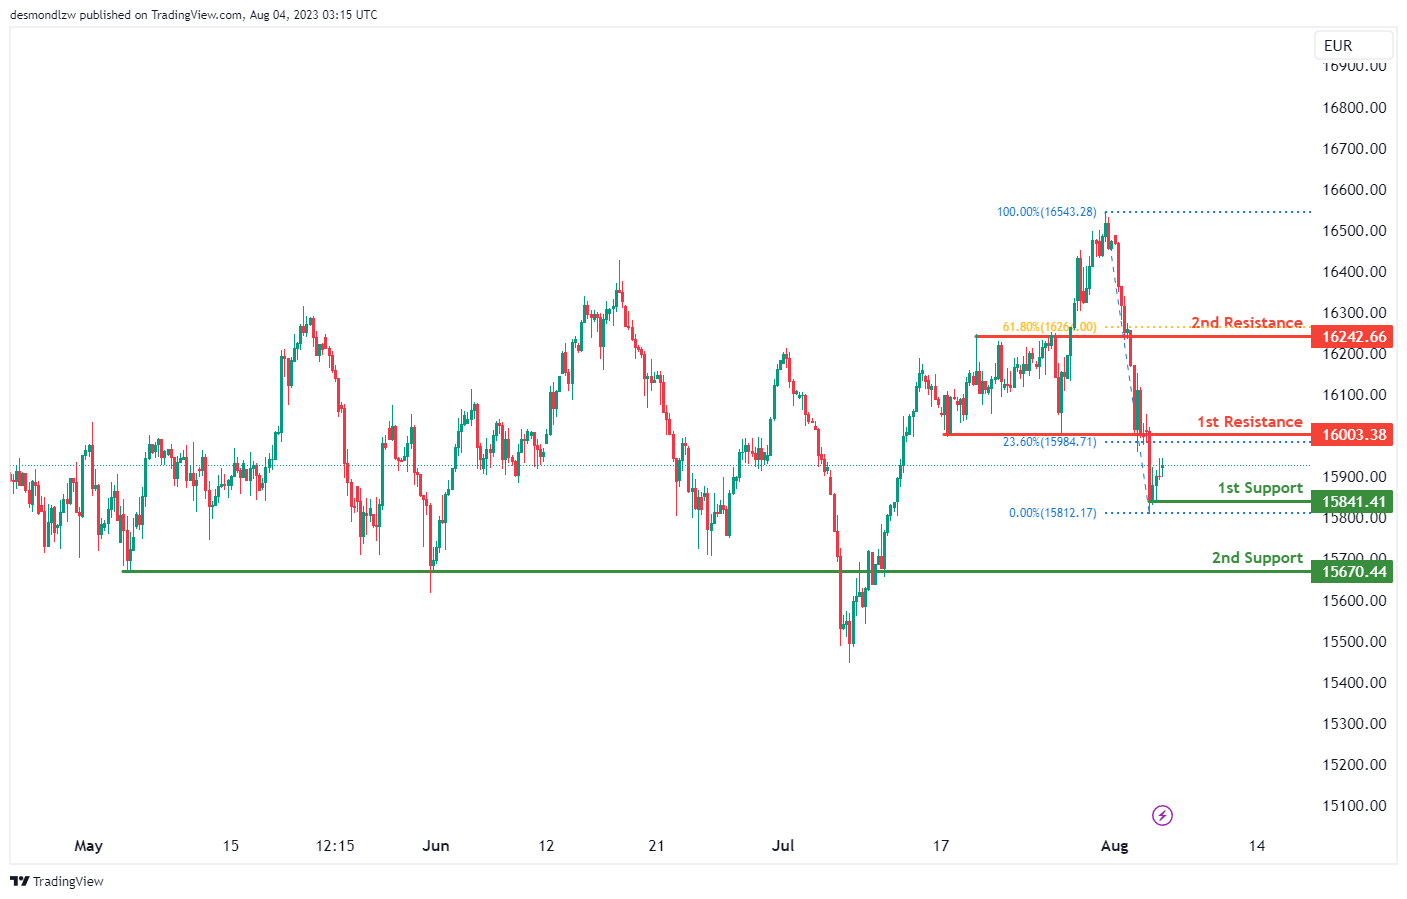
GER30:
The GER30 chart shows a bullish momentum, and there is potential for a bullish continuation towards the 1st resistance.
The 1st support level is at 15841.41 and is identified as a swing low support. This level could potentially provide a firm base for the price.
If the price retreats further, the 2nd support level is at 15670.44. This level is identified as a pullback support and could offer another significant floor for the price.
On the upside, the 1st resistance level is at 16003.38. This level is a pullback resistance and may act as a hurdle for the price to overcome on its way up.
Should the bullish momentum continue, the 2nd resistance level to watch would be at 16242.66. This level is also a pullback resistance and aligns with the 61.80% Fibonacci retracement level, making it a significant level for potential price rejection or reversal.
US500
The US500 chart shows a bullish momentum, indicating potential for a bullish continuation towards the 1st resistance.
The 1st support level is at 4486.2. This level, recognized as an overlap support, could potentially provide a strong foundation for the price.
If the price moves down further, the 2nd support level is at 4455.7. This pullback support could offer another significant floor for the price, preventing further downward movement.
Looking at the upside, the 1st resistance level is at 4532.0. Identified as an overlap resistance, this could act as an obstacle for the price to overcome on its way up.
If the bullish momentum continues, the 2nd resistance level to watch would be at 4578.0. This is a pullback resistance and it coincides with the 78.60% Fibonacci retracement level,

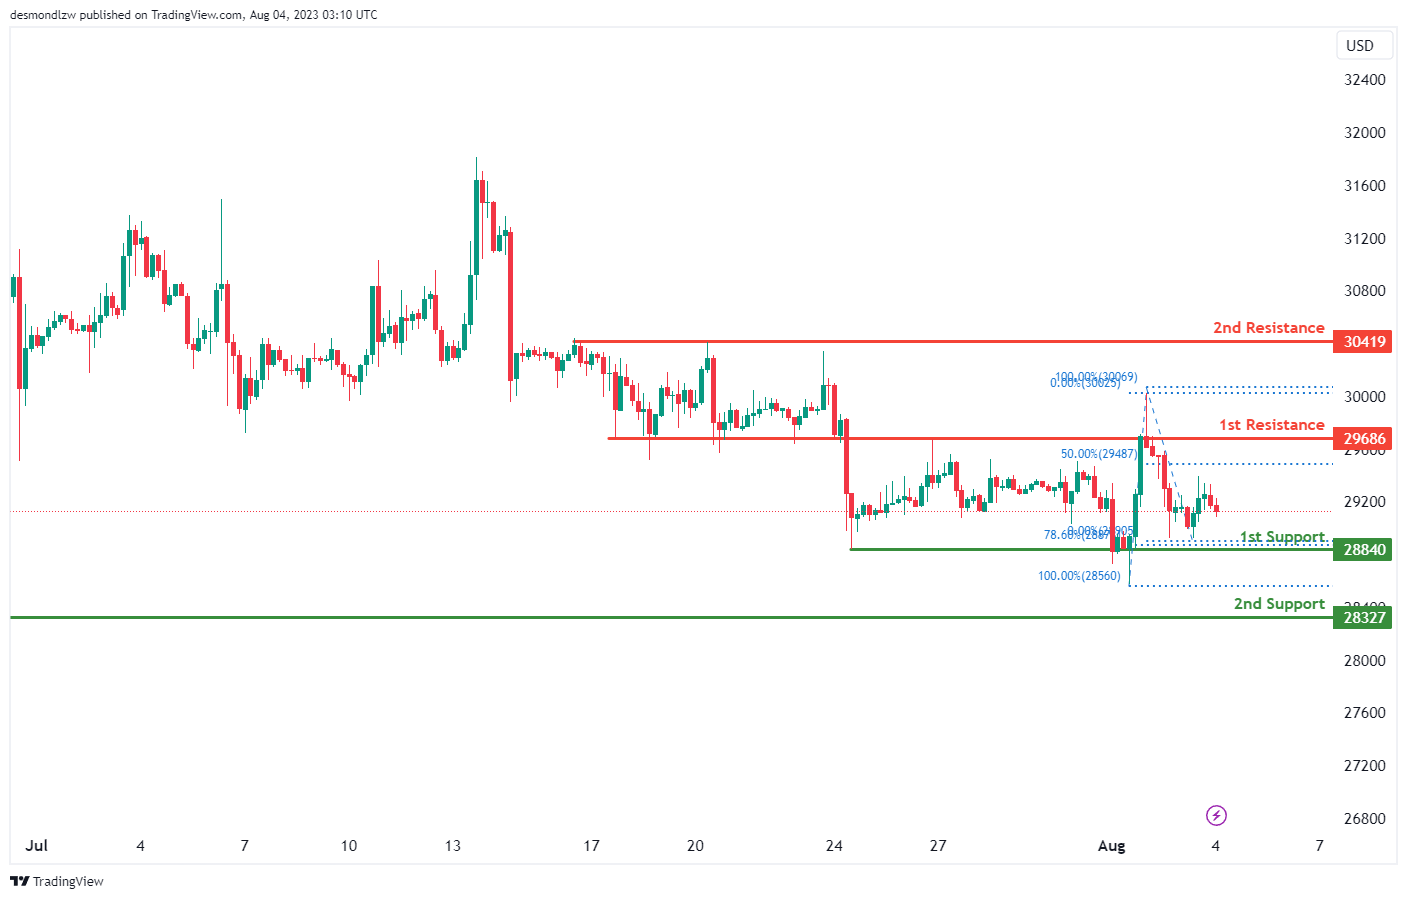
BTC/USD:
The BTC/USD chart shows a bearish momentum, which could potentially lead to a bearish continuation towards the 1st support.
The 1st support level is at 28840. This level is marked by a pullback support and also corresponds with the 78.60% Fibonacci retracement level. This combination makes it a strong support area.
If the price breaks below the 1st support, the 2nd support is at 28327, also marked as a pullback support, providing an additional safeguard against further decline.
On the upside, the 1st resistance level is at 29686. This is recognized as a pullback resistance and coincides with the 50% Fibonacci retracement level, potentially making it a tough level for the price to break.
If the price manages to push beyond the 1st resistance, the 2nd resistance level is at 30419, which is marked by a multi-swing high resistance
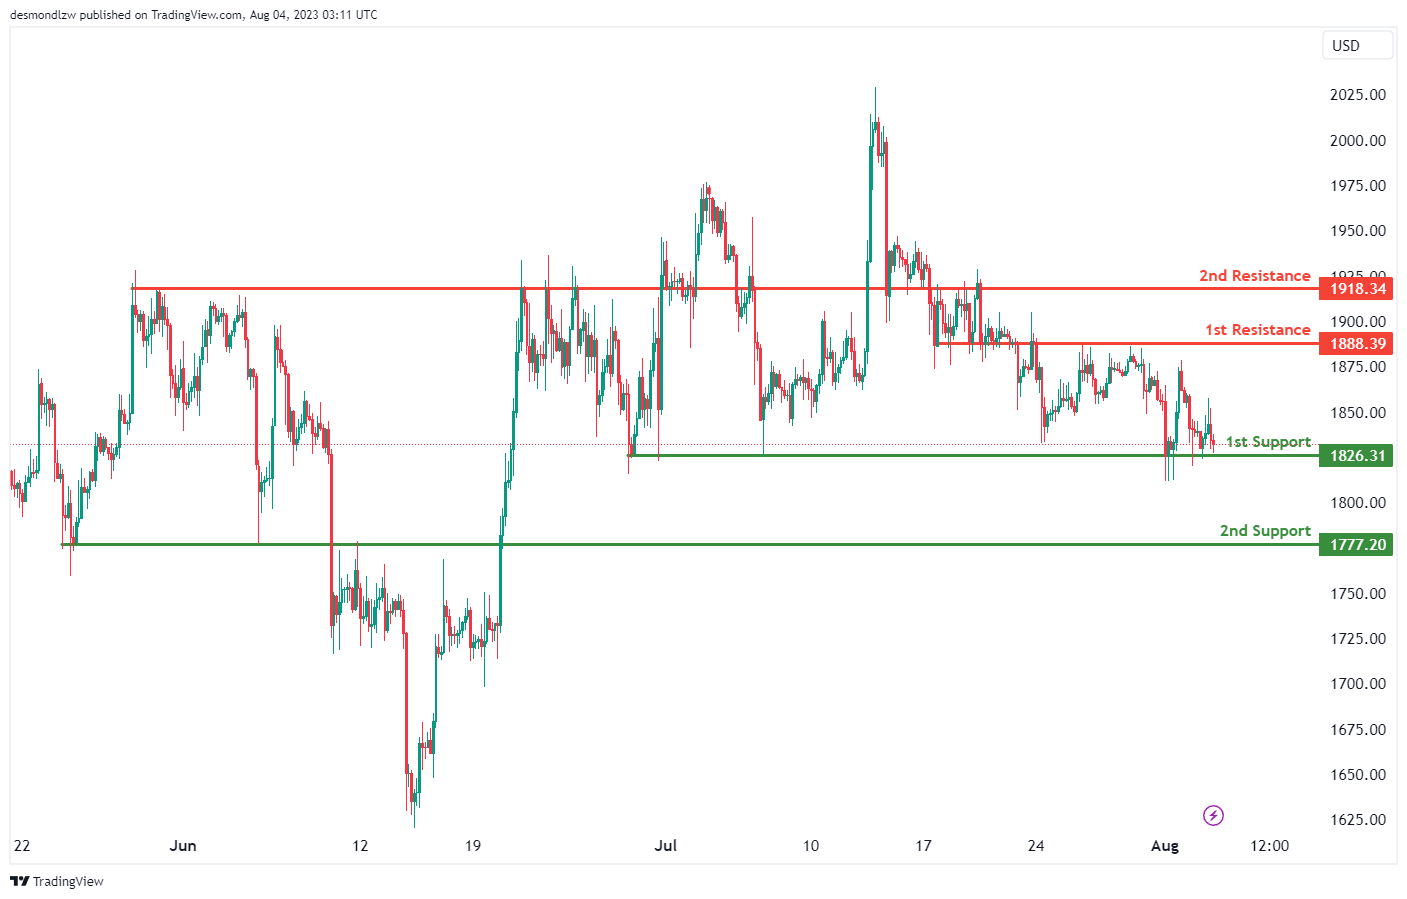
ETH/USD:
The ETH/USD chart currently shows a bearish momentum, however, the price could potentially make a bullish bounce off the 1st support and head towards the 1st resistance.
The 1st support level is at 1826.31, recognized as a multi-swing low support level. This is a level where the price has bounced off of in the past, making it a significant point to watch for a potential bounce back.
Should the price break below this level, the 2nd support is found at 1777.20, marked as a pullback support. This area could provide an additional level of protection against a further price drop.
On the upside, the 1st resistance level is at 1888.39. This level is an overlap resistance, a level that has previously acted as both support and resistance. This could potentially pose a challenge for bullish movement.
If the price manages to surpass this resistance, the next level to watch out for is at 1918.34, considered a pullback resistance
WTI/USD:
The WTI Crude Oil (West Texas Intermediate) is currently demonstrating a bullish trend. It is anticipated that this trend could potentially continue towards the 1st resistance level.
The 1st support level is situated at $78.40. This level represents a multi-swing low support, which has been confirmed by several tests in the past.
Should the price fall below the 1st support level, the 2nd support is at $76.90. This level serves as a pullback support and could potentially be a point for the price to rebound from.
An intermediate resistance level lies at $82.11. This has been identified as a swing high resistance. If the bullish momentum continues, this could be a potential target.
Beyond this point, the 1st resistance level is at $83.26. This level is a multi-swing high resistance and has been tested multiple times in the past. If the price reaches this level, it could face resistance. However, a breakthrough at this level could indicate strong bullish momentum.

XAU/USD (GOLD):
Gold (XAU/USD) currently exhibits a bullish trend on the chart, and it could potentially continue towards the 1st resistance level.
The 1st support level is established at 1929.36. This has been identified as an overlap support level, which also coincides with the 61.80% Fibonacci retracement level and the -27% Fibonacci expansion level. This confluence of Fibonacci levels could potentially make it a strong level of support.
If the price declines further, the 2nd support is at 1913.83. This is another overlap support and corresponds to the 78.60% Fibonacci retracement level, adding to its strength.
In the bullish scenario, the 1st resistance is at 1942.77. This level has been determined as an overlap resistance, aligning with both the 100% Fibonacci projection and the 50% Fibonacci retracement level. This confluence could make it a substantial hurdle for the price to overcome.
Should the bullish momentum continue beyond this point, the next resistance level to watch would be at 1953.42. This level serves as another overlap resistance, providing an additional target for the bulls.

The accuracy, completeness and timeliness of the information contained on this site cannot be guaranteed. IC Markets does not warranty, guarantee or make any representations, or assume any liability regarding financial results based on the use of the information in the site.
News, views, opinions, recommendations and other information obtained from sources outside of www.icmarkets.com, used in this site are believed to be reliable, but we cannot guarantee their accuracy or completeness. All such information is subject to change at any time without notice. IC Markets assumes no responsibility for the content of any linked site.
The fact that such links may exist does not indicate approval or endorsement of any material contained on any linked site. IC Markets is not liable for any harm caused by the transmission, through accessing the services or information on this site, of a computer virus, or other computer code or programming device that might be used to access, delete, damage, disable, disrupt or otherwise impede in any manner, the operation of the site or of any user’s software, hardware, data or property.


