
Waiting for lower timeframe confirmation is our main tool to confirm strength within higher timeframe zones, and has really been the key to our trading success. It takes a little time to understand the subtle nuances, however, as each trade is never the same, but once you master the rhythm so to speak, you will be saved from countless unnecessary losing trades. The following is a list of what we look for:
- A break/retest of supply or demand dependent on which way you’re trading.
- A trendline break/retest.
- Buying/selling tails/wicks – essentially we look for a cluster of very obvious spikes off of lower timeframe support and resistance levels within the higher timeframe zone.
We typically search for lower-timeframe confirmation between the M15 and H1 timeframes, since most of our higher-timeframe areas begin with the H4. Stops are usually placed 1-3 pips beyond confirming structures.
EUR/USD:
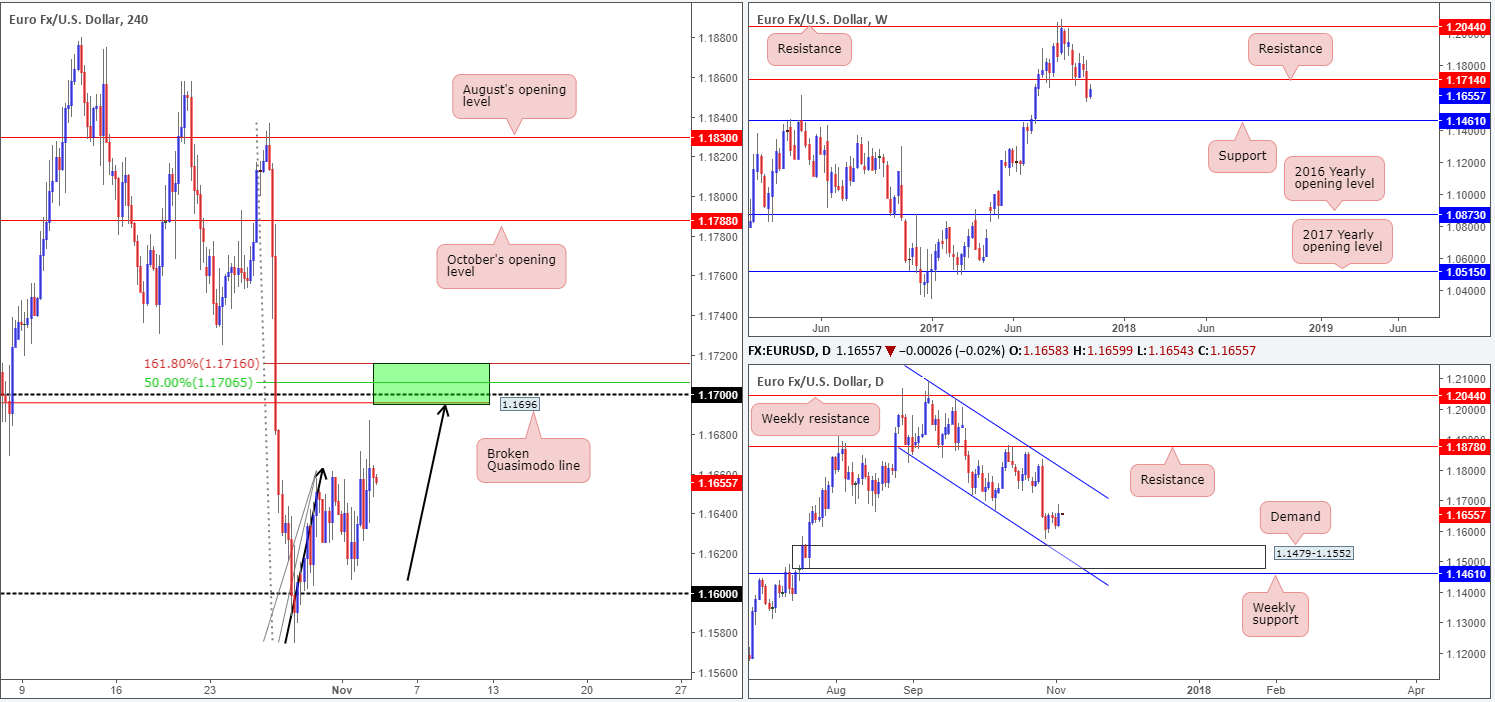
Looking at the weekly timeframe this morning, the current candle looks poised to retest resistance pegged at 1.1714. The pair is likely to find some resistance here with it having been an obvious area of support from August. Cranking our way down to the daily timeframe, we can see that price has spent the week basing just ahead of a strong-looking demand area at 1.1479-1.1552, which happens to unite beautifully with a channel support etched from the low 1.1717.
Over on the H4 timeframe, nevertheless, candle action is so far meeting the characteristics of an AB=CD bearish formation (black arrows) completing between 1.1760/1.1696. What’s also interesting here is that this completion zone merges with the 1.17 handle, a broken Quasimodo H4 line at 1.1696, a 50.0% resistance value at 1.1706 and the noted weekly resistance level.
Suggestions: Technically speaking, the green H4 area marked at 1.1760/1.1696 is a sell zone worthy of consideration. From a fundamental standpoint, however, US job’s data could alter this configuration, which is expected to rise by 312K.
Data points to consider: US Job’s figures and US trade balance at 12.30pm; US ISM non-manufacturing PMI and US factory orders m/m at 2pm; FOMC member Kashkari speaks at 4.15pm GMT.
Levels to watch/live orders:
- Buys: Flat (stop loss: N/A).
- Sells: 1.1716/1.1696 (stop loss: 1.1718).
GBP/USD:
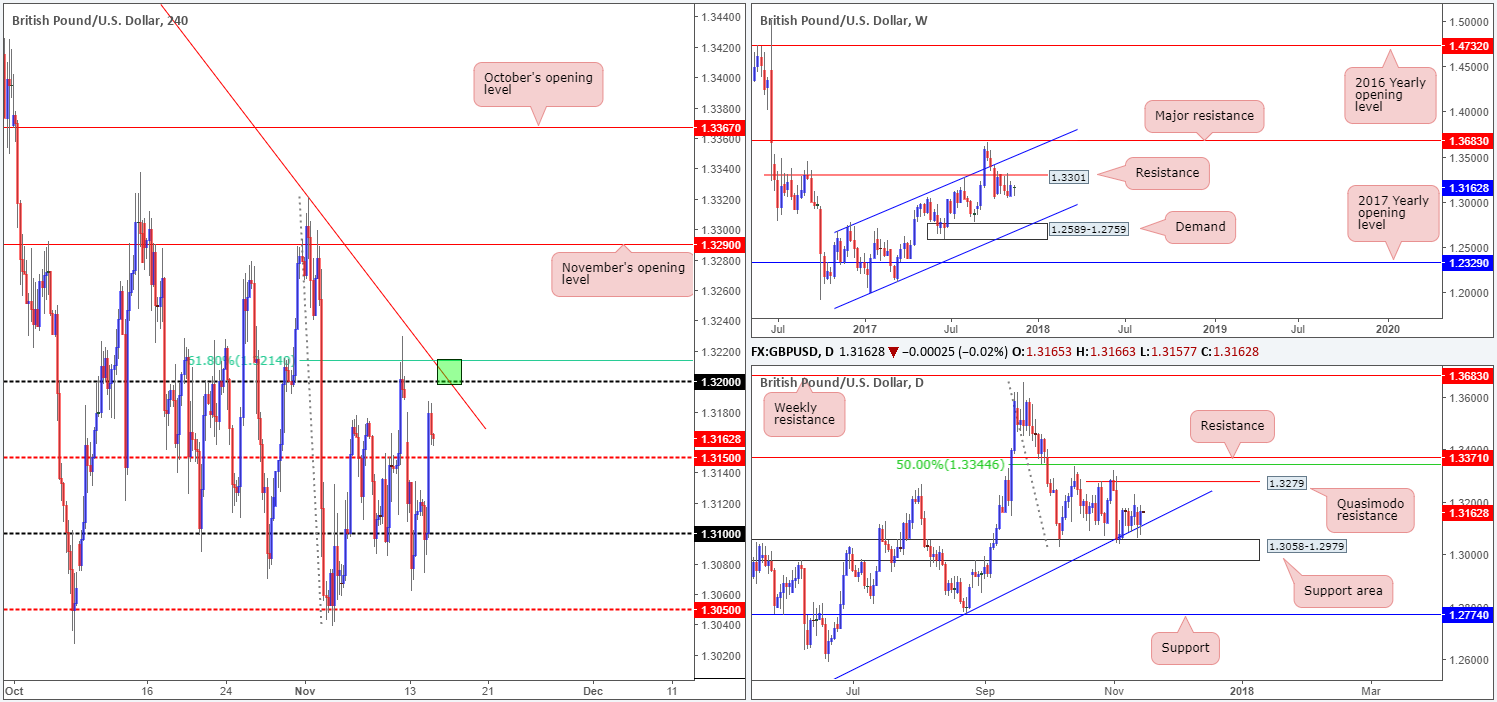
On Thursday, the BoE hiked interest rates from 0.25% to 0.50%. The immediate aftermath saw the British pound clock a high of 1.3270 before tumbling lower. Down 1.45% on the day, the GBP was hit hard on the dovish hike outcome, with no mention of further hikes in the near future.
As can be seen from the H4 chart though, the pair has attempted to mildly pare losses from the mid-level support 1.3050 in recent hours. In support of this line, daily structure shows price kissing the top edge of a support area at 1.3058-1.2979, which happens to fuse nicely with a trendline support etched from the low 1.2108. However, the bulls are likely going to feel the pinch here since weekly sellers are also in sight given the reaction seen from weekly resistance at 1.3301.
Suggestions: Technically, there is a clear conflict of opinion, making it a somewhat difficult market to trade right now.
Data points to consider: UK services PMI at 9.30am; US Job’s figures and US trade balance at 12.30pm; US ISM non-manufacturing PMI and US factory orders m/m at 2pm; FOMC member Kashkari speaks at 4.15pm GMT.
Levels to watch/live orders:
- Buys: Flat (stop loss: N/A).
- Sells: Flat (stop loss: N/A).
AUD/USD:
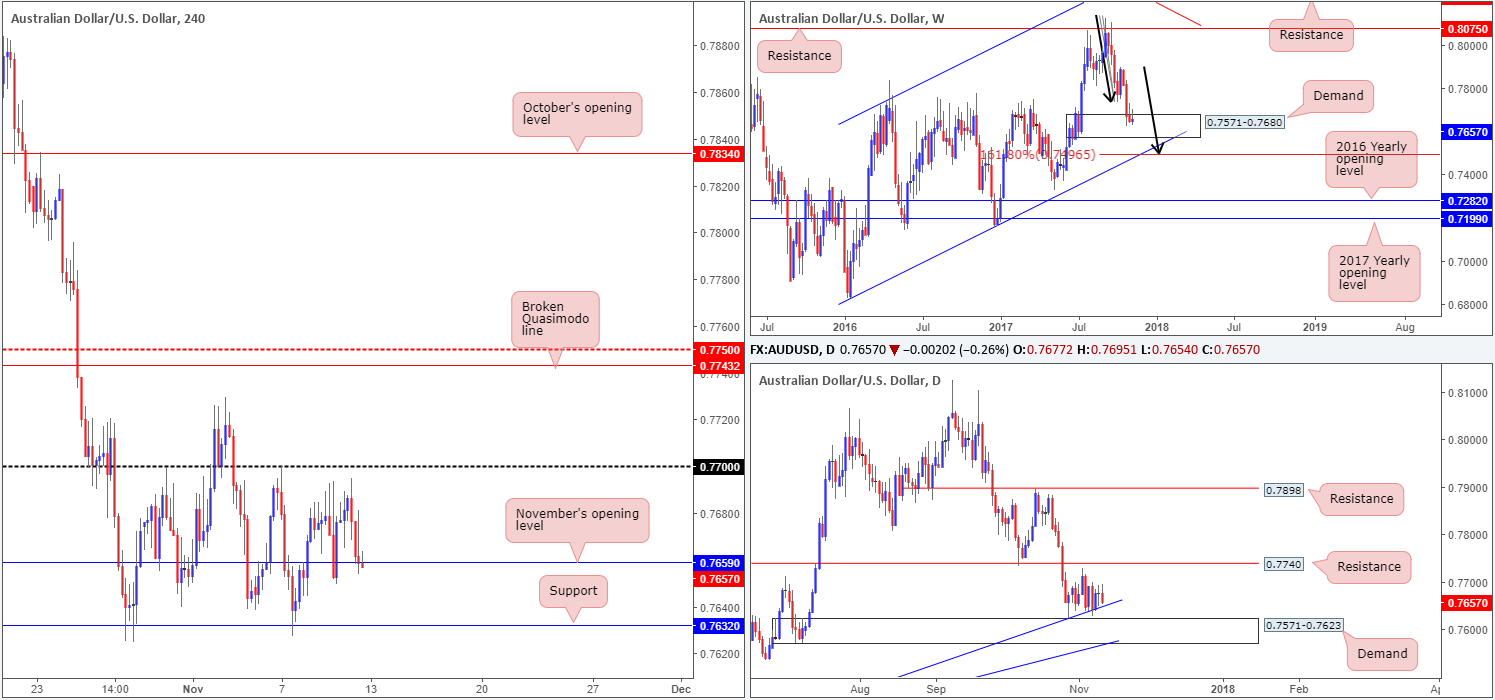
In recent sessions, the AUD/USD conquered the 0.77 handle and retested the line as support. This – coupled with weekly price seen shaking hands with demand at 0.7571-0.7680 and a merging trendline support etched from the high 0.7835 – could see the H4 candles advance to the 0.7750 region today. Getting beyond this number, however, may be a challenge. Not only is there a H4 broken Quasimodo line at 0.7743 and a 161.8% H4 Fib ext. point at 0.7747 fixed just below, there’s also a daily resistance level plotted at 0.7740.
Suggestions: Although weekly action is seen trading from demand right now, a short from the 0.7750 region is not out of the question. Should a H4 bearish candle take shape from here, preferably in the shape of a full or near-full-bodied candle, a sell could be an option.
Data points to consider: AUD retail sales m/m at 12.30am; China caixin services PMI at 1.45am; US Job’s figures and US trade balance at 12.30pm; US ISM non-manufacturing PMI and US factory orders m/m at 2pm; FOMC member Kashkari speaks at 4.15pm GMT.
Levels to watch/live orders:
- Buys: Flat (stop loss: N/A).
- Sells: 0.76/0.7632 ([waiting for a reasonably sized H4 bearish candle to form – preferably a full or near-full-bodied candle – is advised] stop loss: ideally beyond the candle’s wick).
USD/JPY:
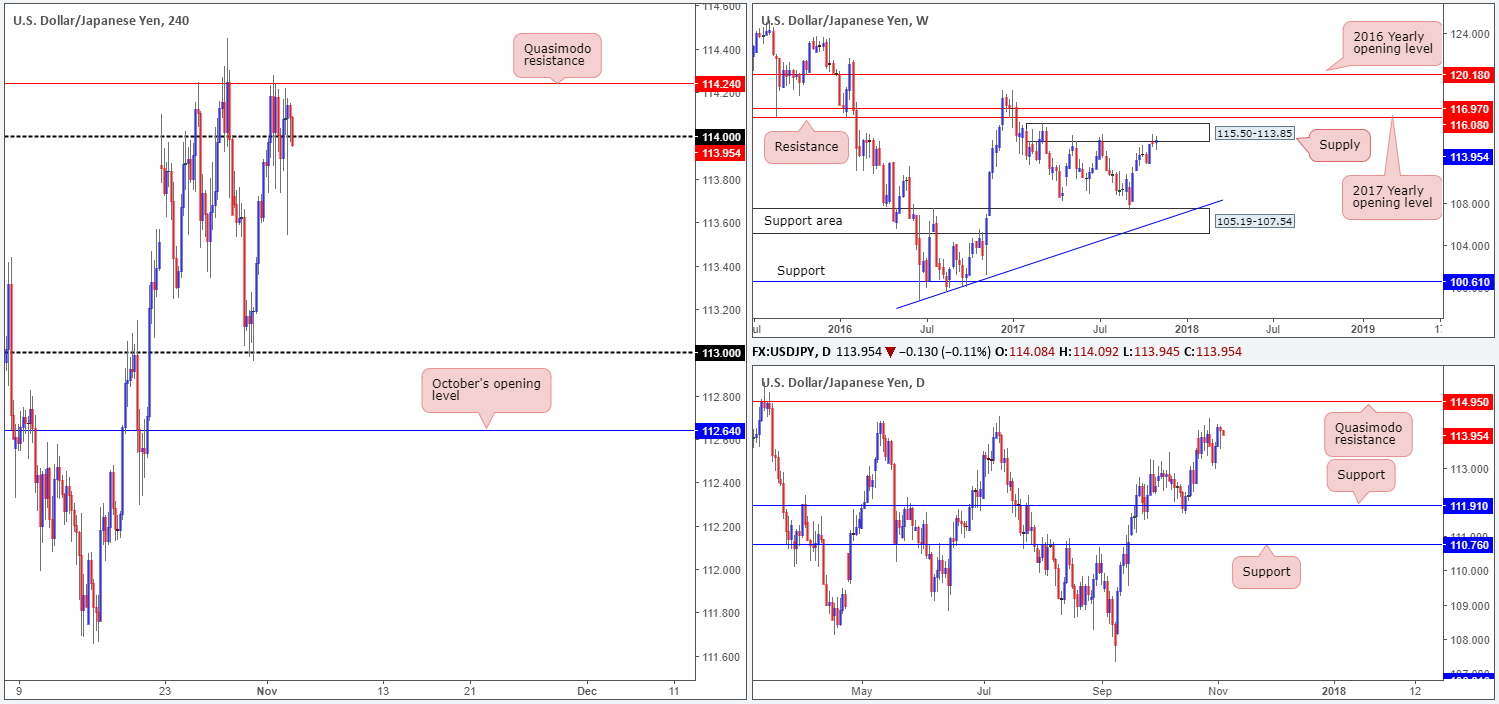
Sizing up the weekly timeframe this morning, price appears to be struggling to make headway from supply at 115.50-113.85. This is not your average run-of-the-mill supply since it has held price lower on two separate occasions so far this year. Therefore, there’s a chance that we may see history repeat itself. Looking down to the daily timeframe, structure shows that the next upside target in view is a Quasimodo resistance level at 114.95.
Over on the H4 timeframe, the Quasimodo resistance seen at 114.24 has so far done a good job in holding back the buyers. However, this was a difficult level to sell given how close the 114 handle is positioned.
Suggestions: Right now, we do not see much to hang our hat on. The only area that really jumps out at us this morning is the daily Quasimodo resistance mentioned above at 114.95. Selling from this angle would allow traders to position their stops beyond weekly supply at 115.50-113.85.
Data points to consider: US Job’s figures and US trade balance at 12.30pm; US ISM non-manufacturing PMI and US factory orders m/m at 2pm; FOMC member Kashkari speaks at 4.15pm GMT; Japanese banks closed in observance of Culture Day.
Levels to watch/live orders:
- Buys: Flat (stop loss: N/A).
- Sells: 114.95 region (stop loss: above weekly supply at 115.52).
USD/CAD:
After failing to sustain gains beyond the 1.29 handle, the USD/CAD has since fell sharply. Going into yesterday’s afternoon US segment, H4 price struck the 1.28 handle and mildly pared losses. A violation of this number could send the unit down to a broken Quasimodo line at 1.2753. However, before price can reach this neighborhood, there’s a nearby daily support to contend with at 1.2776. On the weekly timeframe, nevertheless, price is seen lurking above the top edge of a recently engulfed supply at 1.2778-1.2653 (now acting support).
Suggestions: Between 1.2753 (the H4 broken Quasimodo line) and 1.2776 (daily support) is likely to be an area we see the candles reverse from. Not only because of these noted structures but also because of the converging top edge of the weekly support area at 1.2778.
A bounce from the green H4 zone would, as far as we can see, only be tradable after H4 price closes back above 1.28.
Data points to consider: US Job’s figures and US trade balance at 12.30pm; US ISM non-manufacturing PMI and US factory orders m/m at 2pm; FOMC member Kashkari speaks at 4.15pm; CAD employment change and trade balance at 12.30pm GMT.
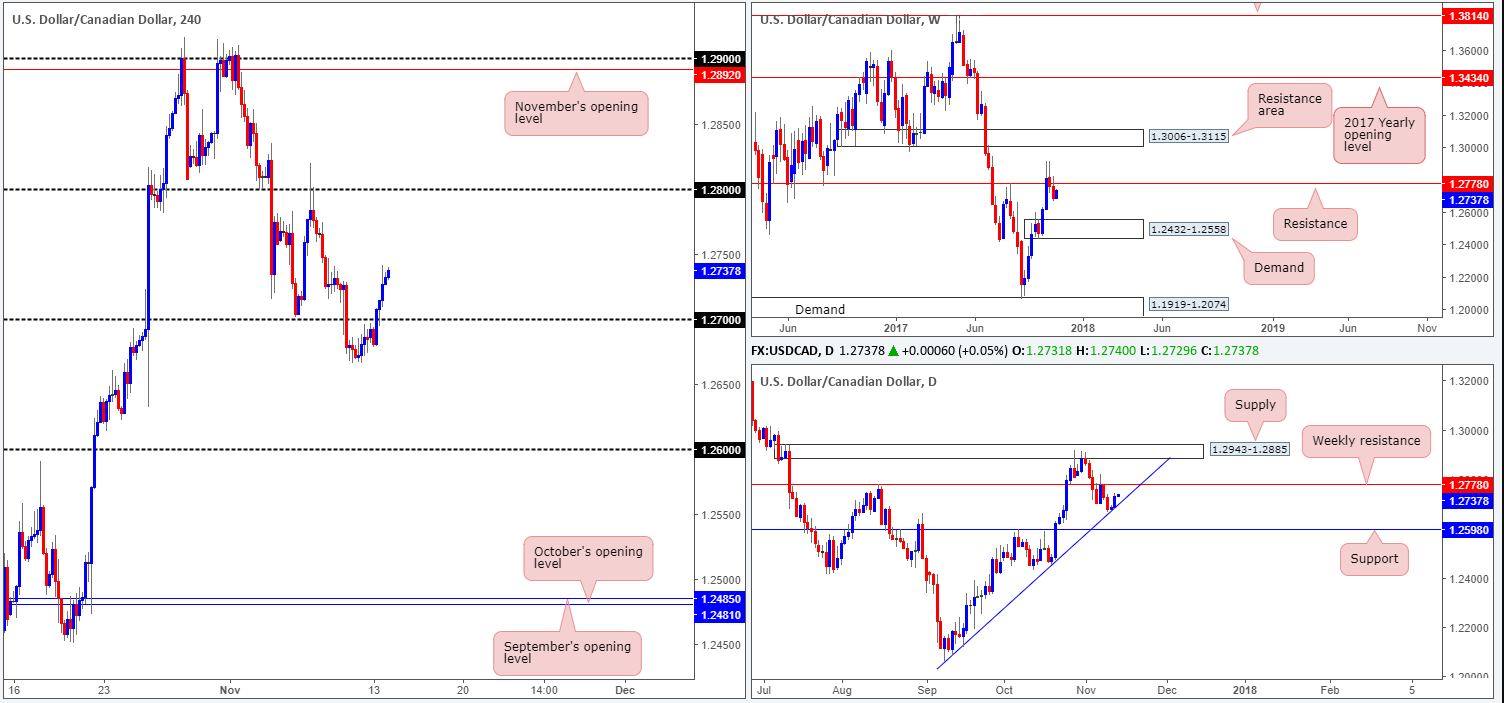
Levels to watch/live orders:
- Buys: 1.2753/1.2776 region – waiting for price to close back above 1.28 may be the safer bet.
- Sells: Flat (stop loss: N/A).
USD/CHF:
In recent dealings, the 2016 yearly opening level seen on the weekly timeframe at 1.0029 was retested for a second time, consequently forming a double-top formation on the H4 timeframe. Right now, the H4 candles are seen trading sub 1.0000 (parity), with the next downside target not in view until we reach support at 0.9940. The daily timeframe, however, is a little mixed, as price is seen trading mid-range between resistance at 1.0080 and support coming in at 0.9896.
So, where do we go from here? Well, with the H4 tail seen marked with a green arrow at 0.9949 likely consuming a large amount of buy orders below, the path south is likely lacking a floor. Therefore, technically speaking, given the unit is trading from a key level seen on the weekly chart, H4 price is likely going to be heading to 0.9940 today.
Suggestions: Watch for price to retest parity and form a reasonably sized H4 bearish candle. Should this come to fruition, an intraday short down to 0.9940 is certainly a possibility according to our technicals. However, do remain aware of news today, as we have the high-impacting US non-farm payrolls report scheduled later on.
Data points to consider: US Job’s figures and US trade balance at 12.30pm; US ISM non-manufacturing PMI and US factory orders m/m at 2pm; FOMC member Kashkari speaks at 4.15pm GMT.
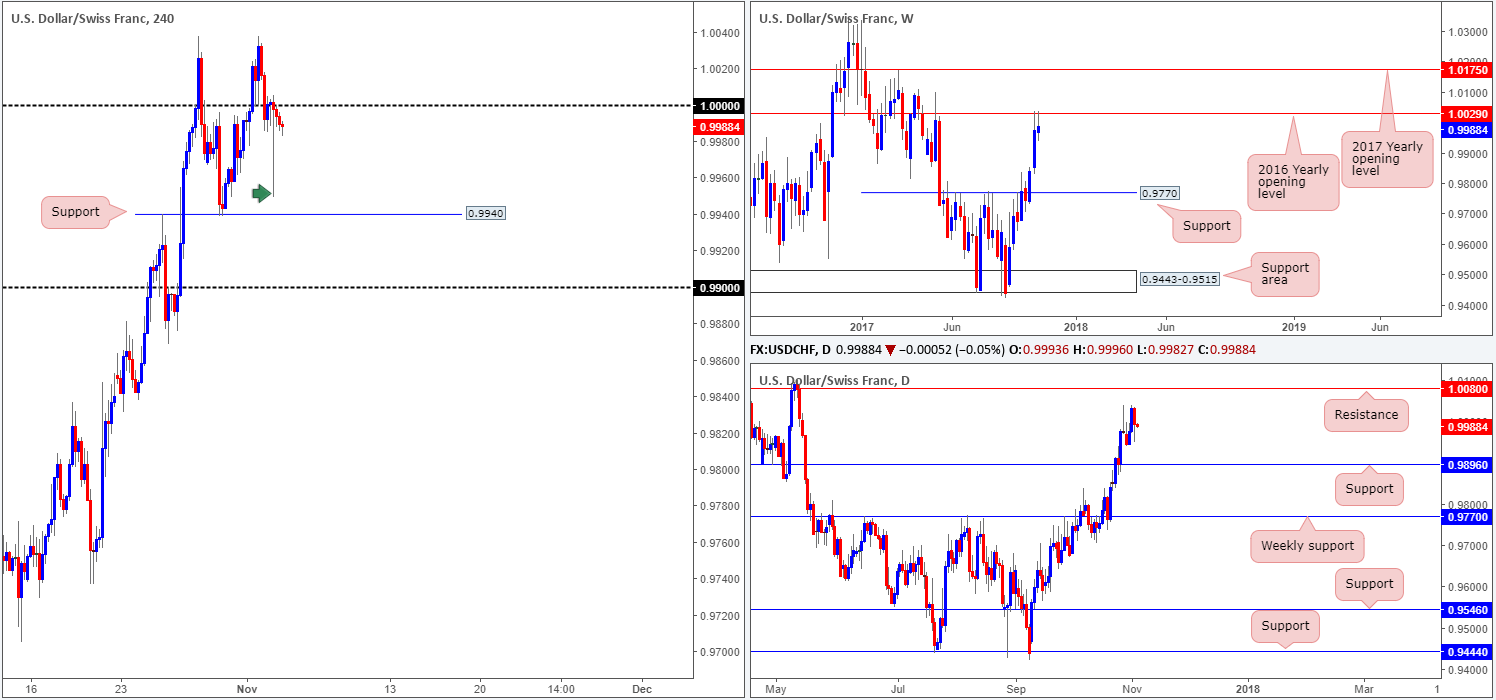
Levels to watch/live orders:
- Buys: Flat (stop loss: N/A).
- Sells: 1.0000 region ([waiting for a reasonably sized H4 bearish candle to form – preferably a full or near-full-bodied candle – is advised] stop loss: ideally beyond the candle’s wick).
DOW 30:
Trade update: took partial profits at 23505 with the remaining taken out at breakeven (23356).
US equities recently punched to fresh highs of 23526, after tapping a low of 23343. As you can see though, the unit recently crossed swords with a H4 channel resistance extended from the high 23452. This could force the index lower today, and may even bring prices down as far as the neighboring channel support taken from the low 23250.
Suggestions: Despite H4 structures suggesting a short, selling this market is a somewhat risky trade in view of the recent upside move. For that reason, we will humbly pass on selling the H4 channel resistance.
Data points to consider: US Job’s figures and US trade balance at 12.30pm; US ISM non-manufacturing PMI and US factory orders m/m at 2pm; FOMC member Kashkari speaks at 4.15pm GMT.
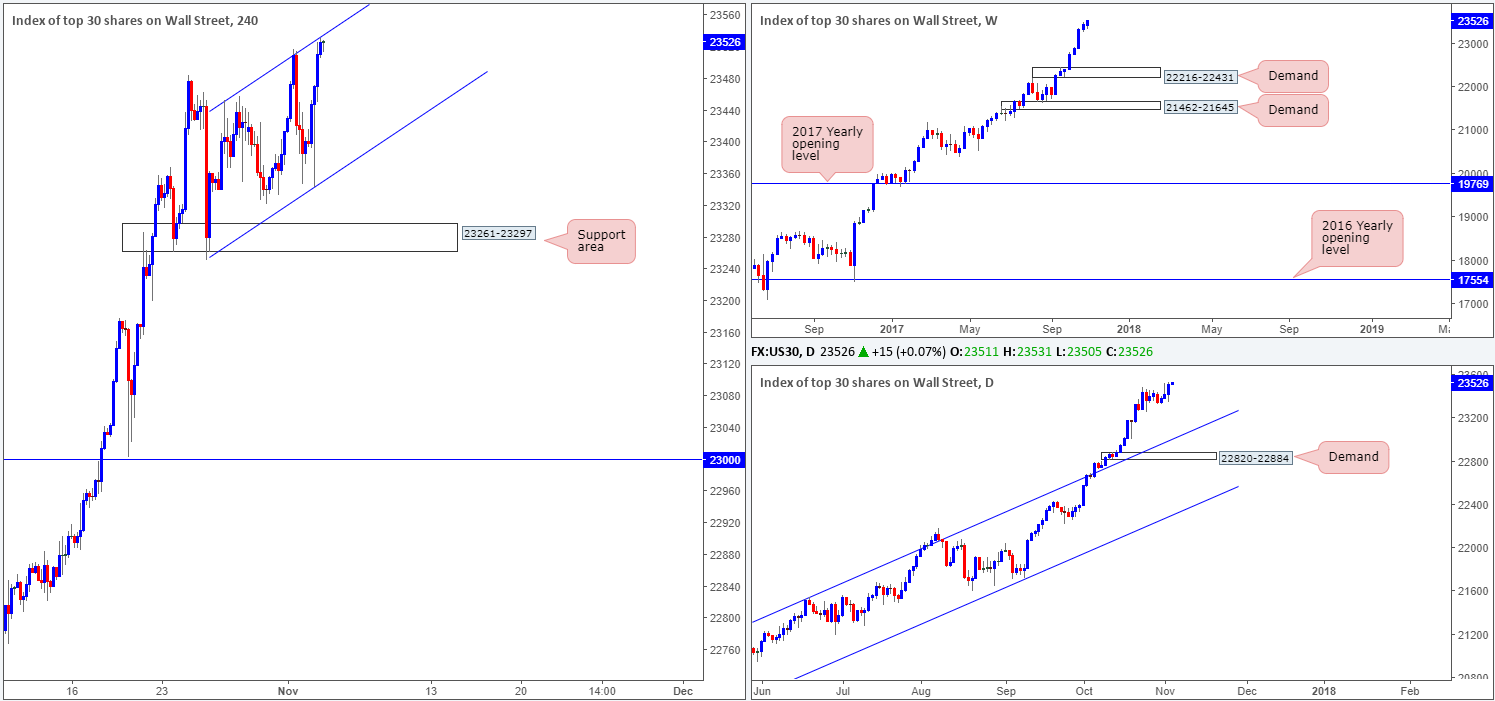
Levels to watch/live orders:
- Buys: Flat (stop loss: N/A).
- Sells: Flat (stop loss: N/A).


