
EUR/USD:
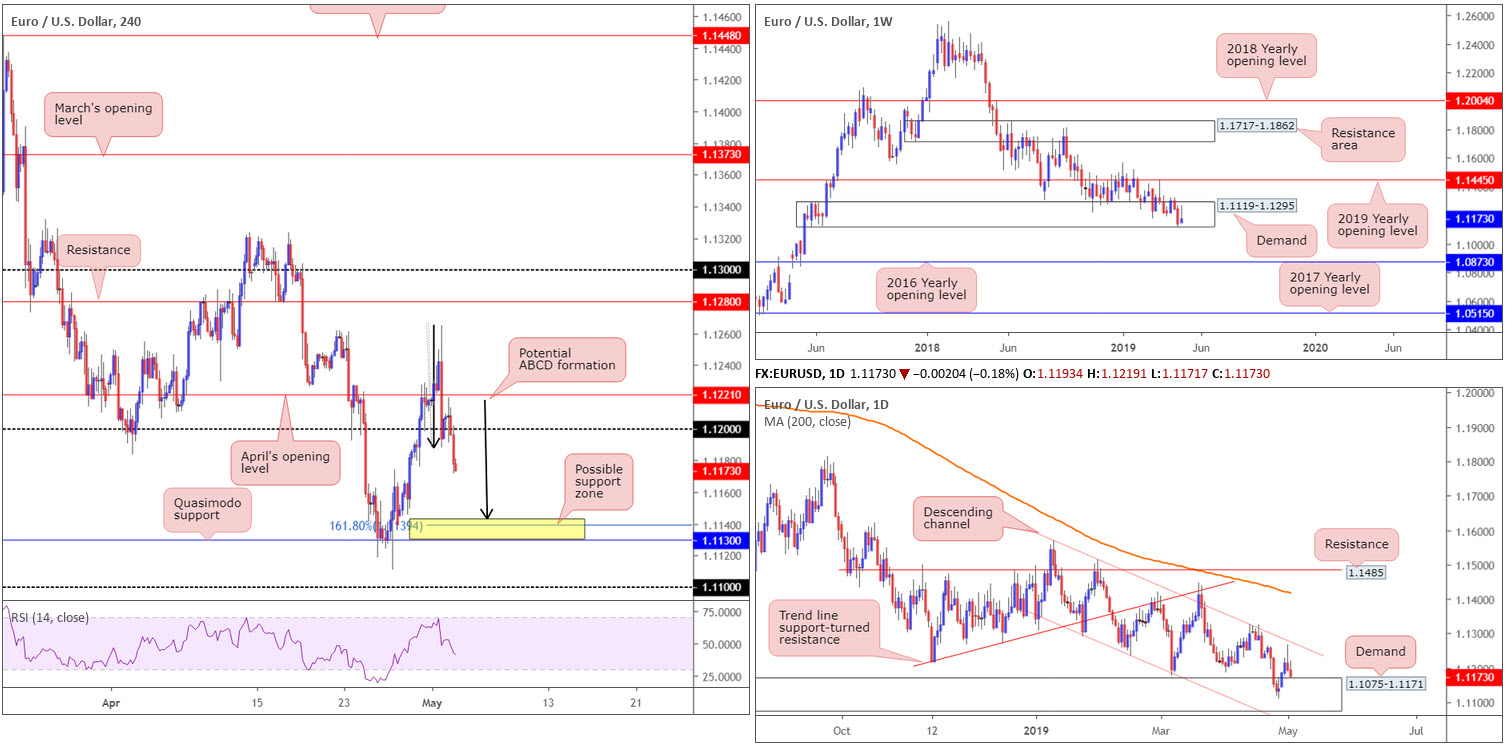
The euro, despite an earnest effort to preserve the 1.12 support, yielded further ground to its US counterpart Thursday. The US dollar index also regained weekly resistance at 97.72, potentially offering support going forward.
With 1.12 now likely to offer resistance, the H4 timeframe echoes limited support until reaching a Quasimodo formation priced in at 1.1130. Note this support held price action higher last week and also comes complete with a potential 161.8% AB=CD (black arrows) pattern at 1.1394.
1.1130 also resides within the lower boundary of a long-standing weekly demand at 1.1119-1.1295. In addition to this, daily price holds 1.1130 within the walls of a demand area coming in at 1.1075-1.1171 (glued to the underside of weekly demand). As a result, although the EUR/USD’s trend faces a southerly bearing right now, scope for at least a bounce off the aforementioned H4 Quasimodo support is seen.
Areas of consideration:
The yellow zone applied to the H4 timeframe at 1.1130/1.1143 may be of interest to some traders today. Knowing we have additional support emerging from the higher timeframes, the research team labels this area a high-probability buy zone.
For conservative traders unsure of taking a trade against the overall trend, however, waiting for additional confirmation to form before pulling the trigger is an option (entry and risk parameters can be defined according to the selected structure).
Today’s data points: EUR CPI Flash Estimate y/y; EUR Core CPI Flash Estimate y/y; US Average Hourly Earnings m/m; US Non-Farm Employment Change; US Unemployment Rate; US ISM Non-Manufacturing PMI; FOMC Members Evans, Clarida, Williams and Bowman Speak.
GBP/USD:
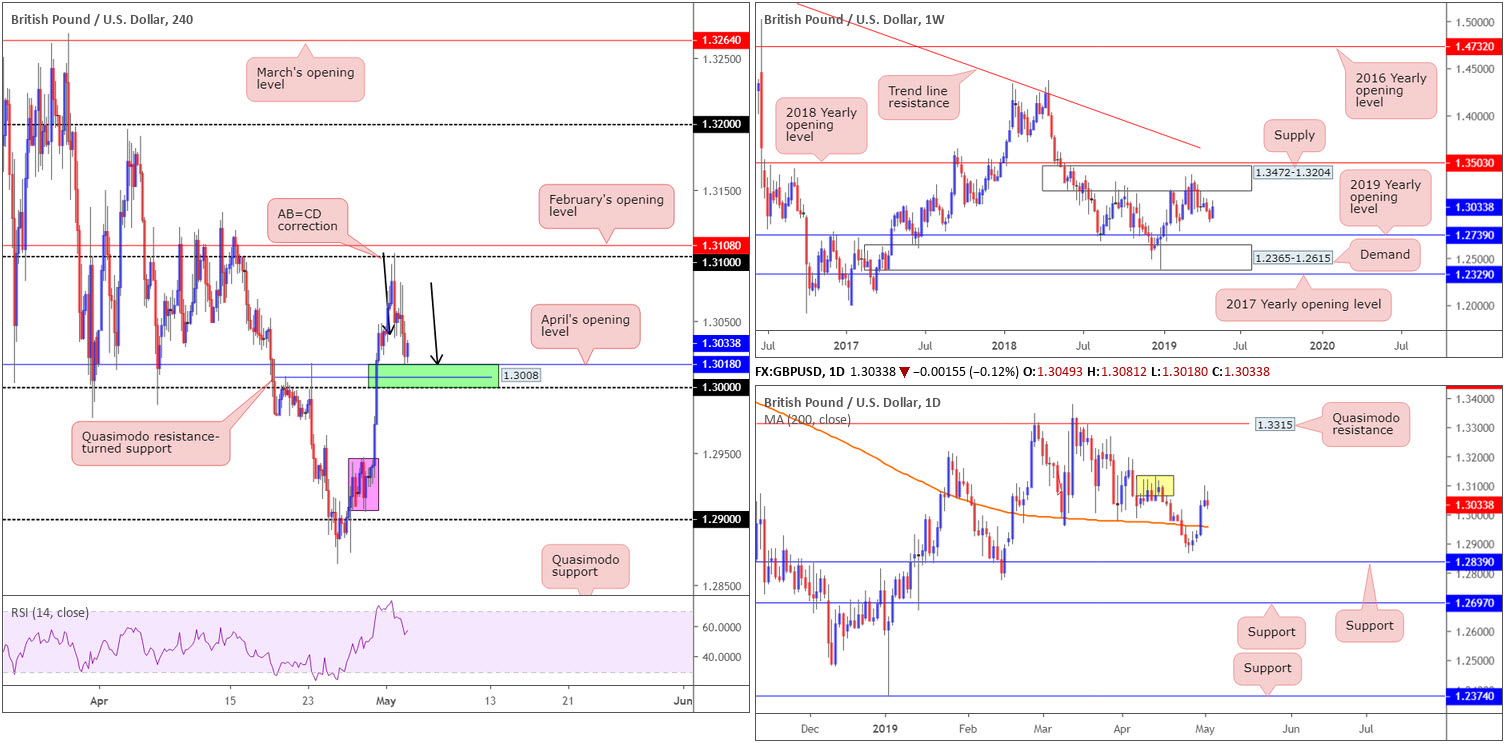
The Bank of England (BoE) opted to stand pat on rates at 0.75% Thursday, in a 9-0 vote, as was seen by the consensus. Last month’s extension to the Brexit deadline continues to tie the hands of policymakers with the terms of the UK’s departure from the EU still unknown.
Sterling, as evident from the charts, weakened in recent sessions, down 0.12% as of writing. Key figure 1.30 plotted on the H4 timeframe was a highlighted number to keep eyeballs on in Thursday’s morning brief, glued closely together with a Quasimodo resistance-turned support at 1.3008 and April’s opening level at 1.3018 – green. In addition to this, the approach formed by way of an AB=CD correction (black arrows). Well done to any of our readers who took advantage of the 1.30/1.3018 H4 buy zone. Price is responding (to the point) from the top edge of the area, as we write.
The only drawback to buying 1.30/1.3018 is daily price reacting from supply emerging around 1.3070ish (yellow). This could be enough to eventually squeeze H4 buyers from the said zone. For that reason, prudent trade management is recommended, with risk reduced to breakeven as soon as possible.
Areas of consideration:
For folks long the 1.30/1.3018 green zone, the first clear upside target rests around 1.31, shadowed closely by 1.3108.
Aside from the above, traders may want to keep an eye on the space seen below 1.30 for potential shorts in the future, towards the demand area marked in pink at 1.2945. Do note, however, before reaching the said demand, support may find its way into the market off the 200-day SMA currently plotted around 1.2960.
Today’s data points: UK Services PMI; US Average Hourly Earnings m/m; US Non-Farm Employment Change; US Unemployment Rate; US ISM Non-Manufacturing PMI; FOMC Members Evans, Clarida, Williams and Bowman Speak.
AUD/USD:
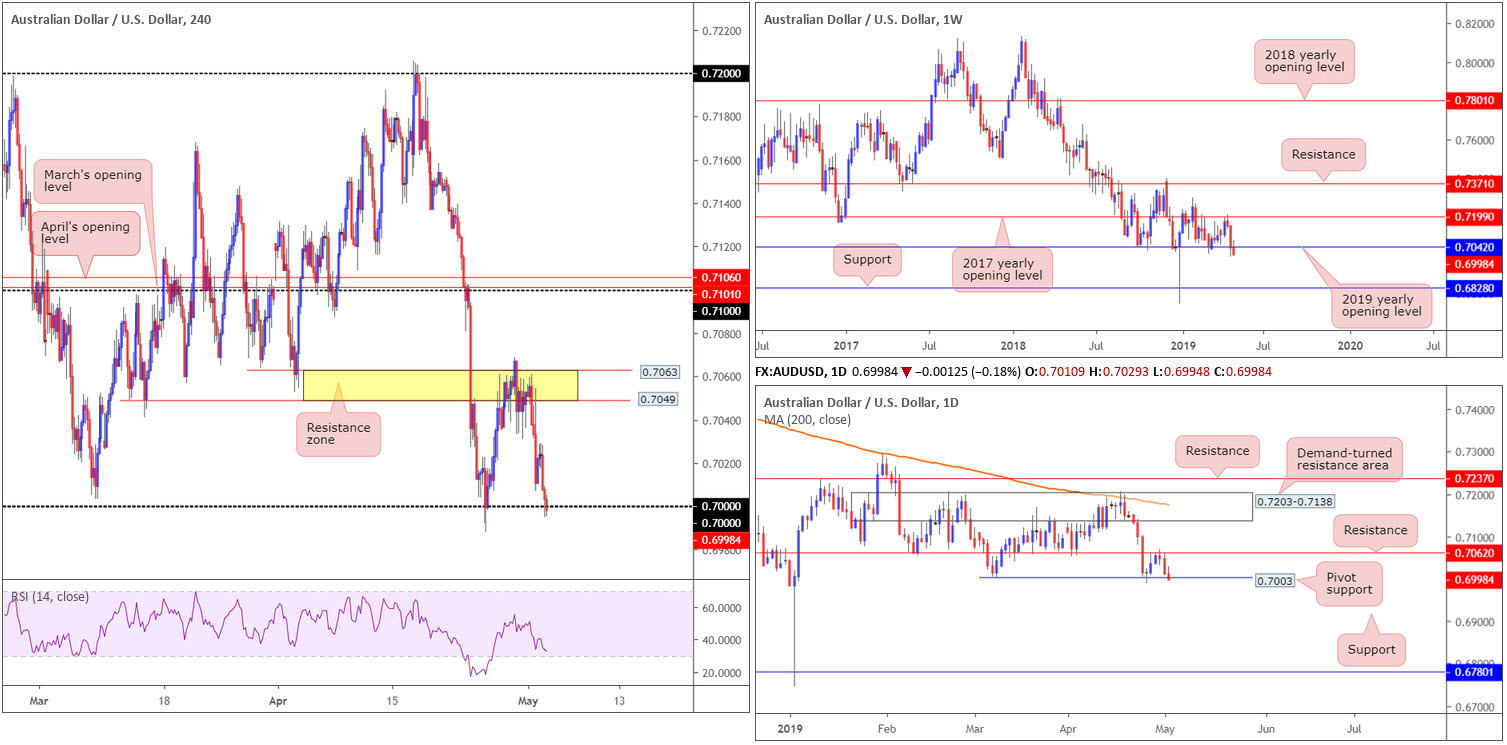
The Australian dollar weakened further against the US dollar Thursday, dipping sub 0.70 in the process. Losses observed in oil markets, as well as copper plummeting more than 4.00% and the greenback exploring higher ground for a second consecutive day, collectively weighed on the AUD/USD market.
From a technical perspective, things are not looking too promising for the buyers. While 0.70 is a key figure of support on the H4 timeframe, coupled with daily pivot support at 0.7003, weekly price recently crossed beneath its 2019 yearly opening level at 0.7042. A weekly close formed beneath here today could set the stage for another wave of selling towards support plotted at 0.6828.
Areas of consideration:
A break beyond 0.70 on a H4 closing basis will likely clear the runway south to 0.69. Note, however, the higher timeframes suggest price action could potentially drop as far south as weekly support priced in at 0.6828.
A strong H4 close formed beneath 0.70 that’s followed up with a retest (preferably by way of a H4 bearish candlestick formation – more of a conservative route than selling the breakout candle) may, given the higher-timeframe setting, draw in additional shorts that traders can take advantage of.
Today’s data points: Australian Building Approvals m/m; US Average Hourly Earnings m/m; US Non-Farm Employment Change; US Unemployment Rate; US ISM Non-Manufacturing PMI; FOMC Members Evans, Clarida, Williams and Bowman Speak.
USD/JPY:
Outlook unchanged due to lacklustre movement.
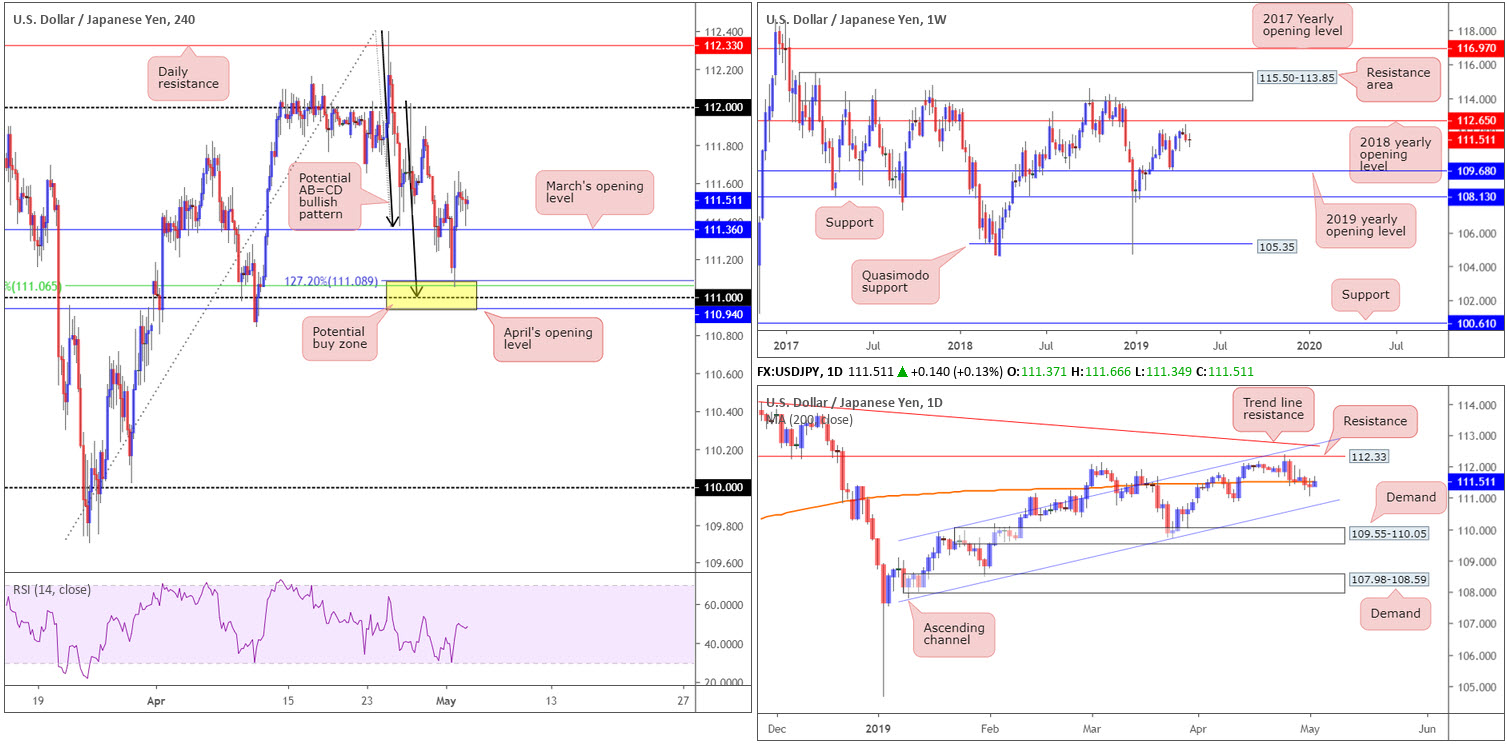
A fall witnessed in US equities and broad-based USD bidding left the USD/JPY pair struggling to pin down a firm direction Thursday. USD/JPY bulls did manage to eke out marginal gains, however, consequently extending Wednesday’s rebound from the H4 (yellow) support area at 110.94/111.08.
Movement on the H4 timeframe witnessed the candles dip their toes into a rather interesting area of support at 110.94/111.08 Wednesday (comprised of April’s opening level at 110.94, the round number 111, a 50.0% support value at 111.06 and a 127.2% AB=CD [black arrows] Fibonacci ext. point at 111.08). Well done to any of our readers who managed to jump aboard this move and remain long. This was a noted zone to watch in Wednesday’s morning brief.
Although buyers on the H4 timeframe reflect a bullish stance above March’s opening level at 111.36 at present, daily action recently shook hands with the underside of its 200-day SMA (orange) and may call for an approach towards nearby channel support etched from the low 107.77.
Areas of consideration:
For folks long this market from 110.94-111.08, as highlighted in Thursday’s report, taking some profits off the table and reducing risk to breakeven at this point may be an idea. Overhead, although the path is reasonably clear north on the H4 timeframe, daily action’s 200-day SMA could certainly throw a spanner in the works. In the event we do push for higher ground, nevertheless, keep an eye on the 111.89 April 29, followed closely by the 112 handle.
Today’s data points: US Average Hourly Earnings m/m; US Non-Farm Employment Change; US Unemployment Rate; US ISM Non-Manufacturing PMI; FOMC Members Evans, Clarida, Williams and Bowman Speak.
USD/CAD:
A combination of strong USD bidding and a waning oil market – WTI declined more than 3.00%, testing the waters below $61.00 – lifted the USD/CAD higher for a second consecutive daily session Thursday.
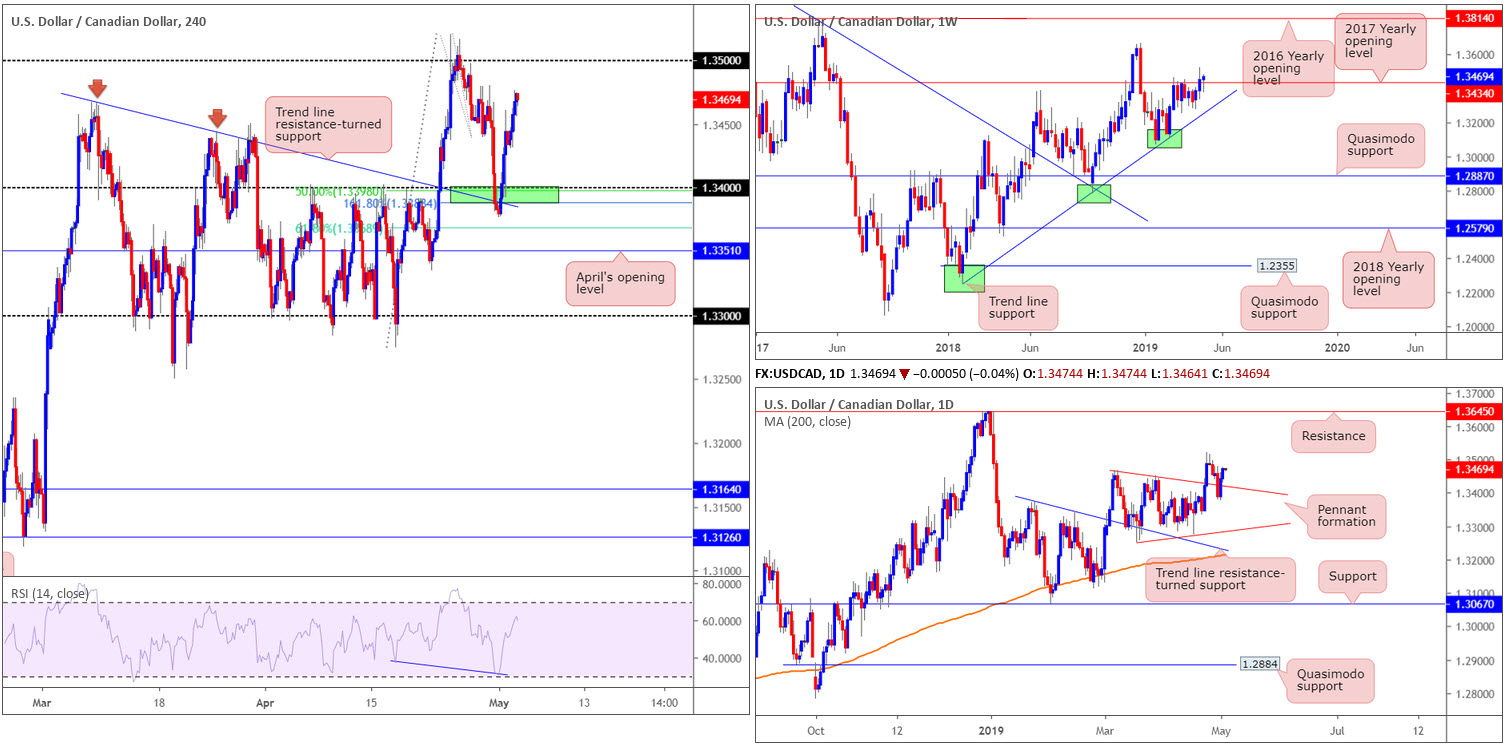
For folks who read Wednesday’s briefing you may recall the piece highlighted a potential buy zone on the H4 timeframe at 1.3388/1.34 (green). The area, comprised of a round number at 1.34, a trend line resistance-turned support etched from the high 1.3443, a 161.8% Fibonacci ext. at 1.3388, a 50.0% support value at 1.3398 and also the RSI indicator (blue line) printing hidden bullish divergence (whereby price leads the way as opposed to the indicator), proved to be an awesome buy zone. Well done to any of our readers who managed to enter long from this area and hold.
In terms of where we stand on the higher timeframes, focus on the weekly timeframe remains around the 2017 yearly opening level at 1.3434, as price is visibly attempting to reclaim the resistance. A decline from here, nonetheless, has nearby trend line support taken from the low 1.2247 in sight, whereas a move higher could bring in the 2018 yearly high at 1.3664.
Daily movement, as you can see, retested the top edge of a pennant formation Wednesday and extended north Thursday. This, by and of itself, is likely attracting buyers into the market, with a possible take-profit target residing around resistance at 1.3645.
Areas of consideration:
As of current price, there’s limited support available on the H4 timeframe to take advantage of further upside as being suggested on the higher timeframes. An alternative is to wait and see if the H4 candles close above 1.35. A break of this level has H4 resistance at 1.3570 to target.
A H4 close above 1.35, followed up with a retest as support preferably by way of a H4 bullish candlestick formation (entry/risk parameters can be determined according to this structure), is considered a high-probability setup.
Today’s data points: US Average Hourly Earnings m/m; US Non-Farm Employment Change; US Unemployment Rate; US ISM Non-Manufacturing PMI; FOMC Members Evans, Clarida, Williams and Bowman Speak.
USD/CHF:
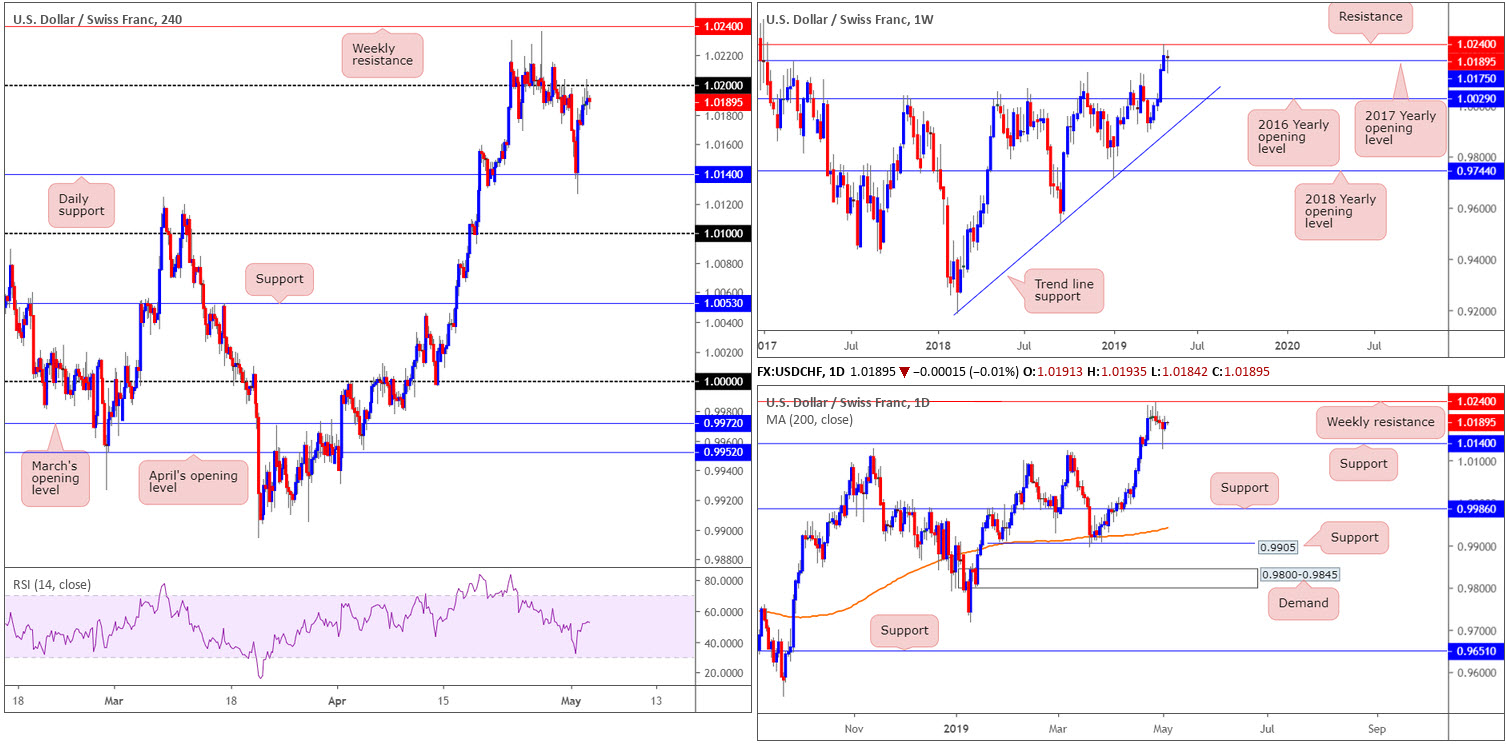
Extending Wednesday’s post-Fed advance, broad-based US buying lifted the USD/CHF higher Thursday, adding 0.14%. While the dollar continues to attract interest, resistance on the H4 timeframe at 1.02 is proving a problematic barrier to overthrow.
A break above the 1.02 handle may call for additional buying towards weekly resistance at 1.0240. Note weekly price, thanks to recent buying, is attempting to establish a position above its 2017 yearly opening level at 1.0175.
Areas of consideration:
Some short-term traders likely have their feelers on a breakout play above 1.02, targeting a 40-point move towards weekly resistance at 1.0240. While this could work out, traders are urged to note price action failed to make headway last time the unit was above 1.02. This is likely due to the threat of weekly selling. Therefore, trade this with caution.
For folks interested in fading 1.02, this is also a chancy move. Shorting from here has the position competing with potential weekly and daily buying.
Today’s data points: US Average Hourly Earnings m/m; US Non-Farm Employment Change; US Unemployment Rate; US ISM Non-Manufacturing PMI; FOMC Members Evans, Clarida, Williams and Bowman Speak.
Dow Jones Industrial Average:
US equity indexes deteriorated Thursday as energy shares fell. The Dow Jones Industrial Average lost 0.25% (CFD), the S&P 500 ended the session down by 0.21% and the tech-heavy Nasdaq concluded down 0.36%.
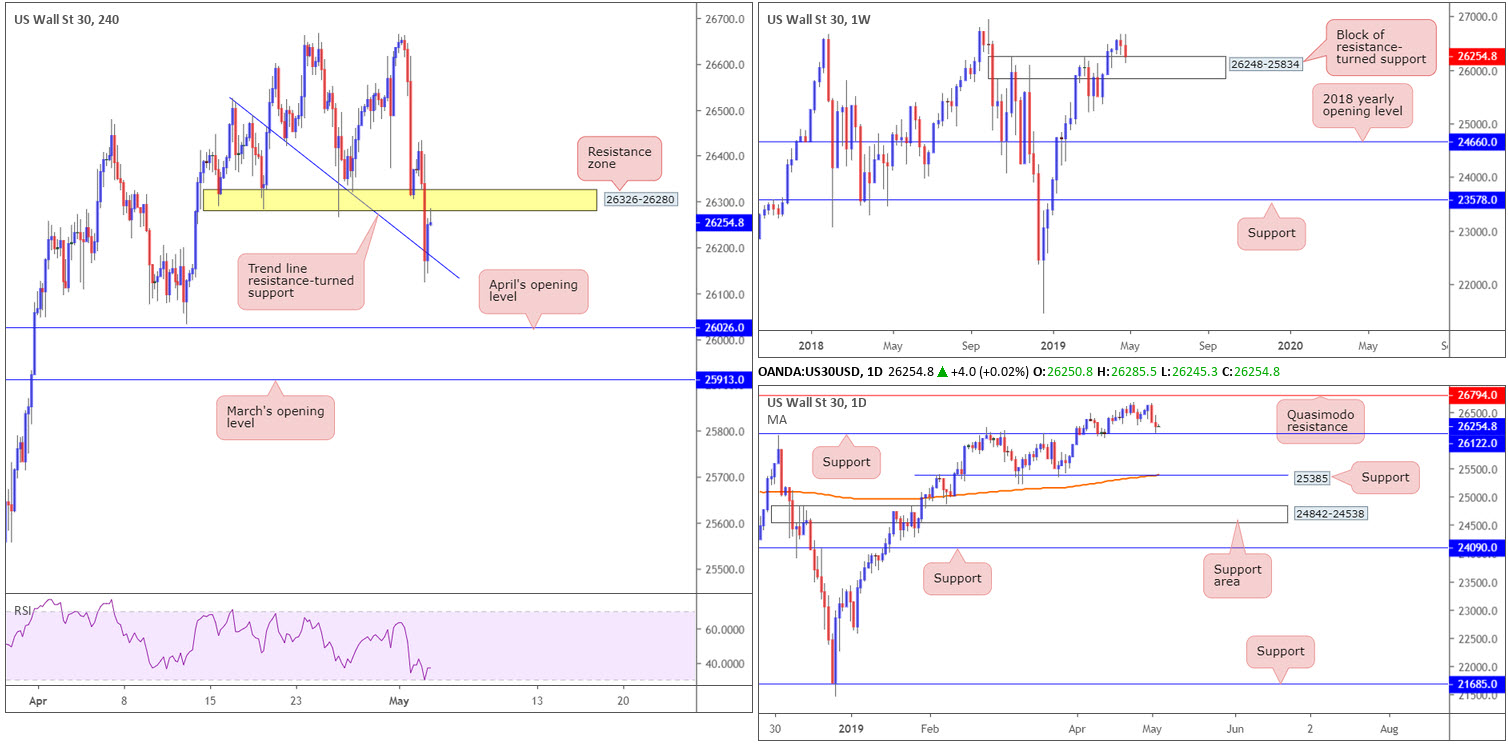
From a technical standpoint, weekly activity is actively testing the top edge of a resistance-turned support area at 26248-25834. In the event this area holds ground, price action has the all-time high of 26939 to target. Located within the top region of the current support zone on the weekly timeframe, daily structure displays support at 26122, which was brought into the mix during yesterday’s descent.
The story over on the H4 timeframe has the candles shaking hands with a trend line resistance-turned support taken from the high 26525. Despite this, the 26326-26280 support-turned resistance zone (yellow) entered the fray in recent hours – a potentially problematic barrier for buyers to overcome having seen its strong history as support.
Areas of consideration:
With buyers likely looking to engage on both weekly and daily timeframes (see above), buyers have the upper hand on the H4 timeframe. And so the technical expectation is for the candles to overthrow the current H4 resistance zone and push for higher ground.
Should we retest the current H4 trend line support, traders may want to consider looking for signs of buying to enter long. In the event the unit continues higher from current price, nevertheless, and breaks the aforesaid H4 resistance zone, entering long on either the breakout candle or the retest (entry and risk parameters can either be defined according to the H4 structure’s limits or the rejecting candle’s parameters) is an option.
Today’s data points: US Average Hourly Earnings m/m; US Non-Farm Employment Change; US Unemployment Rate; US ISM Non-Manufacturing PMI; FOMC Members Evans, Clarida, Williams and Bowman Speak.
XAU/USD (GOLD):
Further selling materialised Thursday as bullion pressured its way south on the back of a healthy dollar across the board (US dollar index seen approaching 98.00).
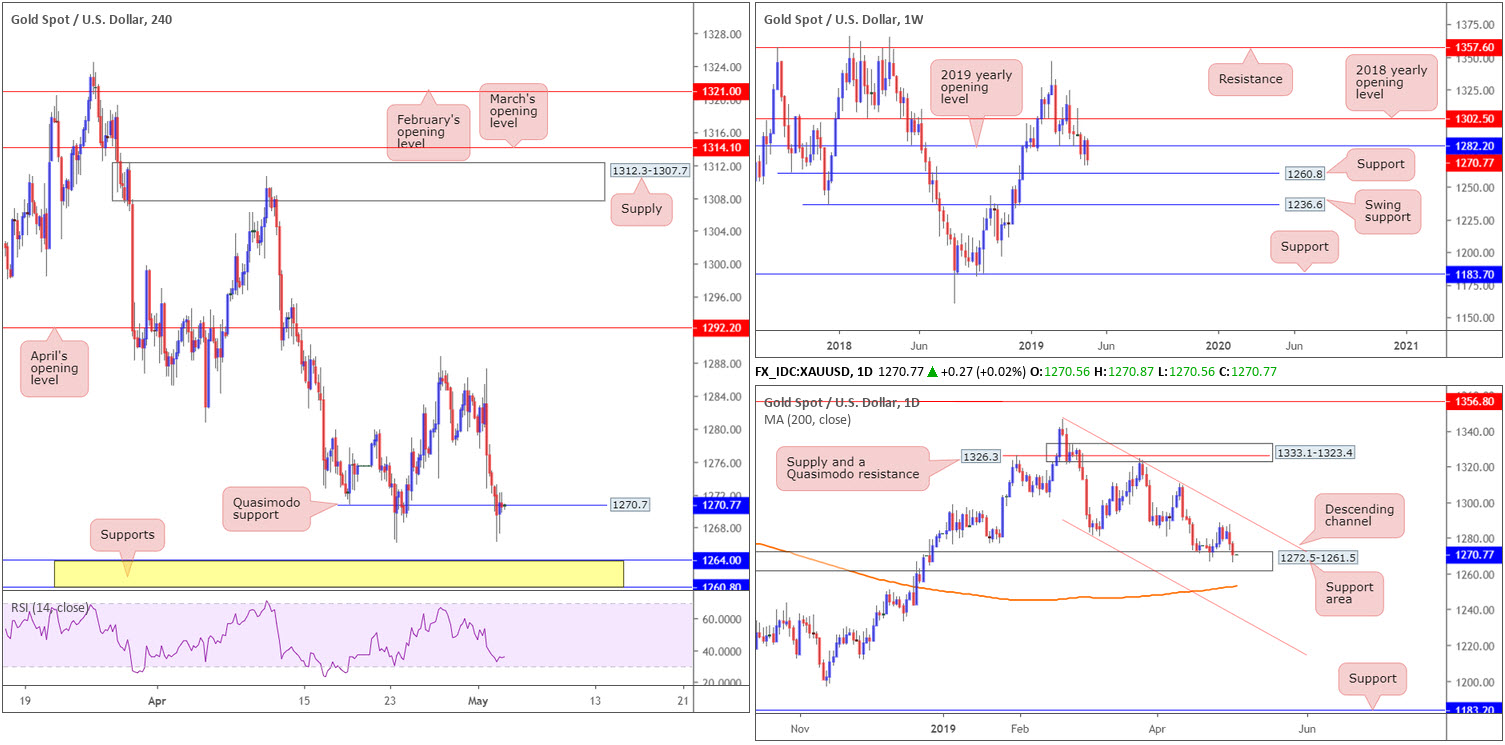
As evident from the weekly timeframe, the yellow metal trades beneath its 2019 yearly opening level at 1282.2 and is heading towards support priced in at 1260.8.
Contrary to weekly structure, the yellow metal remains bolstered by a support area coming in at 1272.5-1261.5. The next upside target from current price rests at a channel resistance drawn from the high 1346.7, whereas a break of this zone will almost immediately see the unit cross swords with its 200-day SMA.
A closer reading of price action on the H4 timeframe shows the metal challenging a Quasimodo support at 1270.7. Beneath here, traders are urged to note two closely plotted supports at 1260.8/1264.0 (yellow).
Areas of consideration:
On account of the technical structure offered at the moment, the 1260.8/1264.0 area on the H4 timeframe is an area active buyers may inhabit. A test of this area in the shape of a H4 bullish candlestick formation would, according to the H4 zone’s connection with the higher timeframes, likely be sufficient enough to draw in buyers and push higher.
The rationale behind requiring additional candlestick confirmation is simply because the weekly support at 1260.8 marks the LOWER edge of the H4 buy zone and, therefore, could see price fakeout lower before turning higher. Further to this, the market’s trend points south at the moment and a candlestick formation helps provide traders strict boundaries by which to place entry and risk levels.
The accuracy, completeness and timeliness of the information contained on this site cannot be guaranteed. IC Markets does not warranty, guarantee or make any representations, or assume any liability with regard to financial results based on the use of the information in the site.
News, views, opinions, recommendations and other information obtained from sources outside of www.icmarkets.com.au, used in this site are believed to be reliable, but we cannot guarantee their accuracy or completeness. All such information is subject to change at any time without notice. IC Markets assumes no responsibility for the content of any linked site. The fact that such links may exist does not indicate approval or endorsement of any material contained on any linked site.
IC Markets is not liable for any harm caused by the transmission, through accessing the services or information on this site, of a computer virus, or other computer code or programming device that might be used to access, delete, damage, disable, disrupt or otherwise impede in any manner, the operation of the site or of any user’s software, hardware, data or property.


