
Lower timeframe confirmation: simply means waiting for price action on the lower timeframes to confirm direction within a higher timeframe area. For example, some traders will not enter a trade until an opposing supply or demand area has been consumed, while on the other hand, another group of traders may only need a trendline break to confirm direction. As you can probably imagine, the list is endless. We, however, personally prefer to use the two methods of confirmation mentioned above in our trading.
EUR/USD:
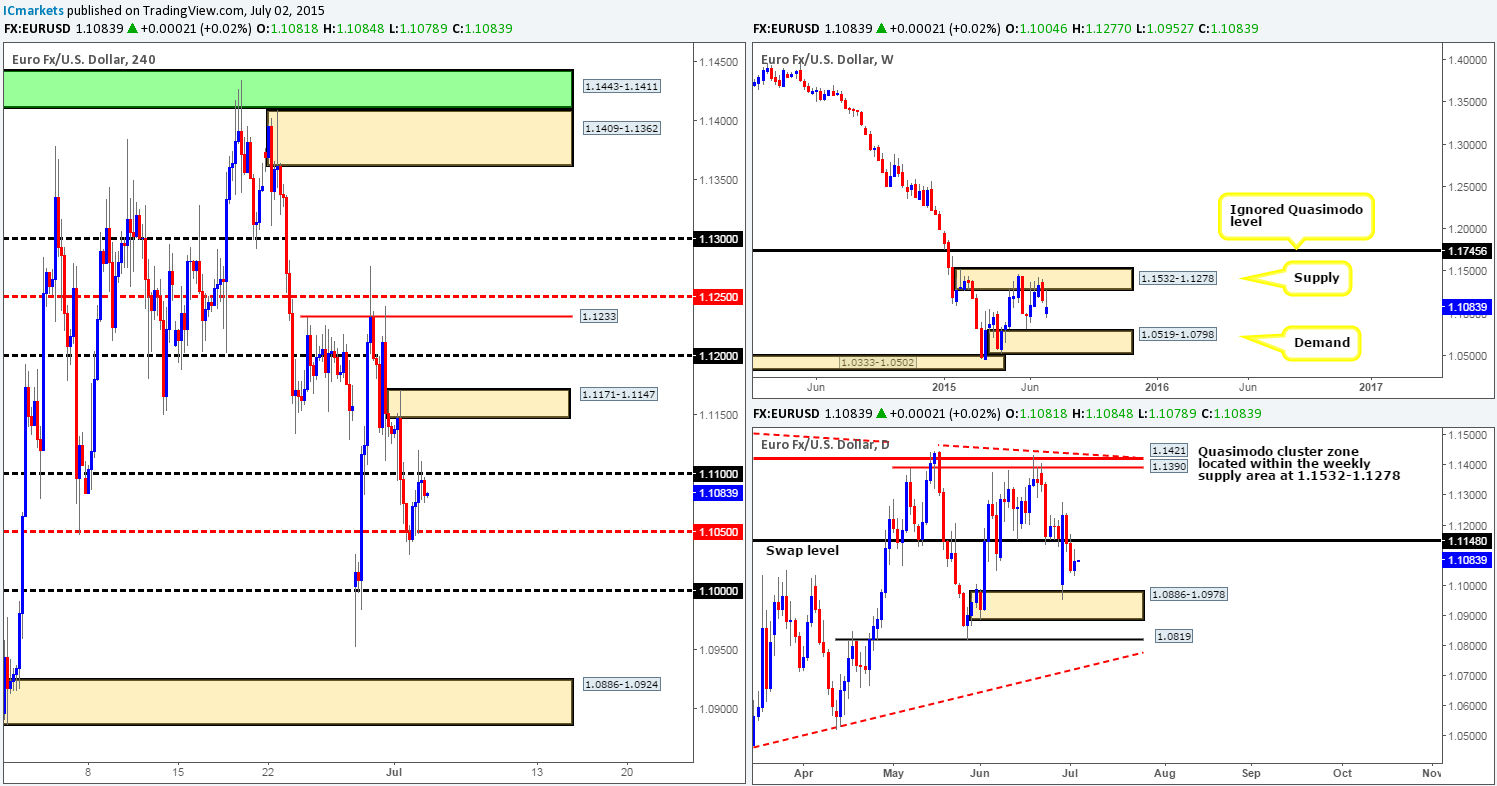
Overall, the EUR/USD saw very little movement yesterday. The mid-level number 1.1050 held going into the NFP report which came in lower than expected at 223k jobs. This saw a conservative wave of bids hit the line, pushing prices back up to the round number 1.1100 which held going into the NY close.
In the bigger picture, we’re still seeing agreement across the board. Both the weekly and daily charts show little support until price reaches the 1.1000 mark, which ties in nicely with the daily demand area seen at 1.0886-1.0978. Therefore, at least from a technical standpoint, the floor of this market appears weak thus potentially encouraging further selling today.
Personally though, we have no interest in trading this market today as U.S traders are on vacation, which could cause erratic movements in this market due to less liquidity. Let’s also not forget that the Greek referendum is taking place this Sunday and traders will likely be waiting for the outcome of this ongoing saga. All of this coupled with the fact that there is no high-impacting EUR or USD related data on the line up today made our decision to stay out relatively easy.
However, for those wishing to trade this pair today, here are the levels we currently have noted to watch for confirmed trades:
Buys:
- Mid-level number 1.1050.
- Round number 1.1000.
Sells:
- Round number 1.1100.
- 4hr supply zone at 1.1171-1.1147 which envelopes the mid-level barrier 1.1150.
Levels to watch/live orders:
- Buys: 1.1050 [Tentative – confirmation required (Stop loss: dependent on where one confirms this level) 1.1000 [Tentative – confirmation required] (Stop loss: dependent on where one confirms this level).
- Sells: 1.1100 [Tentative – confirmation required (Stop loss: dependent on where one confirms this level) 1.1171-1.1147 [Tentative – confirmation required (Stop loss: 1.1174).
GBP/USD:
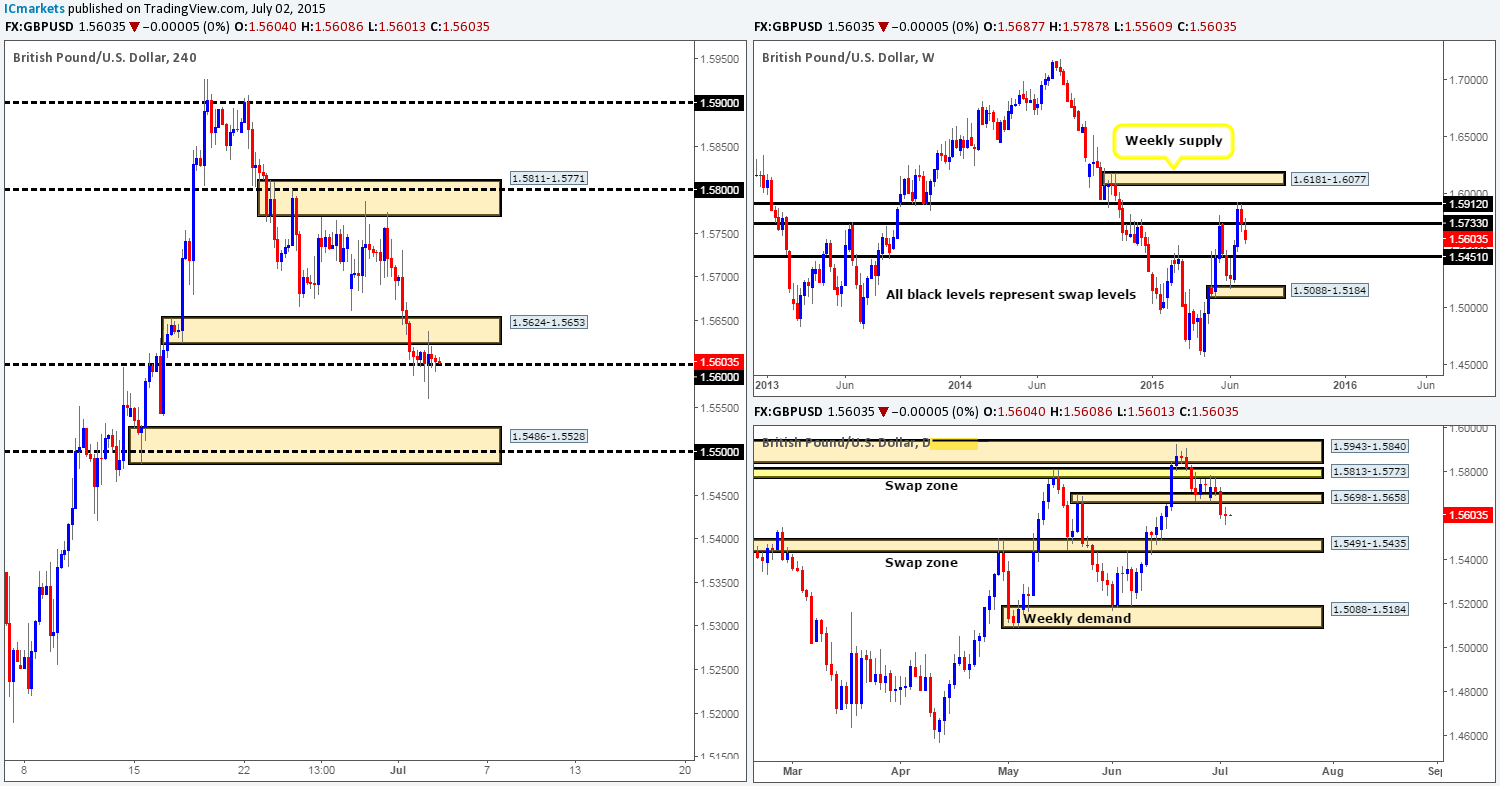
The GBP/USD was relatively quiet throughout the course of yesterday’s sessions. The only real movement seen was during NFP, which as you can see caused a relatively strong spike below the round number 1.5600. Other than this though, bids and offers remained tightly confined between here and the recently broken 4hr demand area (now acting supply) at 1.5624-1.5653.
With the weekly timeframe showing resistive pressure coming in from the underside of a weekly swap level 1.5733, and price closing, and holding below a daily swap area of support at 1.5698-1.5658, technically this pair looks weak.
With the higher timeframe picture reporting potential weakness, all eyes are on the 1.5600 number going into today’s sessions. If this level gives way, this would, in effect, be our cue to begin watching for price to retest 1.5600 as resistance and show some sort of lower timeframe selling signal. We say this simply because we believe the path south would then be clear, technically clear that is, down to 4hr demand area seen at 1.5486-1.5528, which converges not only with round-number support at 1.5500, but also the daily swap zone at 1.5491-1.5435 as well. In addition to this, the June 16 low 1.5540 will likely act as a fakeout level so to speak. There will be quite a lot of traders watching that low for a reaction and stops will be set just below. These sell stops will provide the much needed liquidity that well-funded traders require to push this market north from our 4hr demand area just mentioned.
Fundamentally, we have the Services PMI (GBP) report on the docket today at 8.30am GMT, which should help push this market along.
Levels to watch/ live orders:
- Buys: Flat (Stop loss: N/A).
- Sells: Flat (Stop loss: N/A).
AUD/USD:
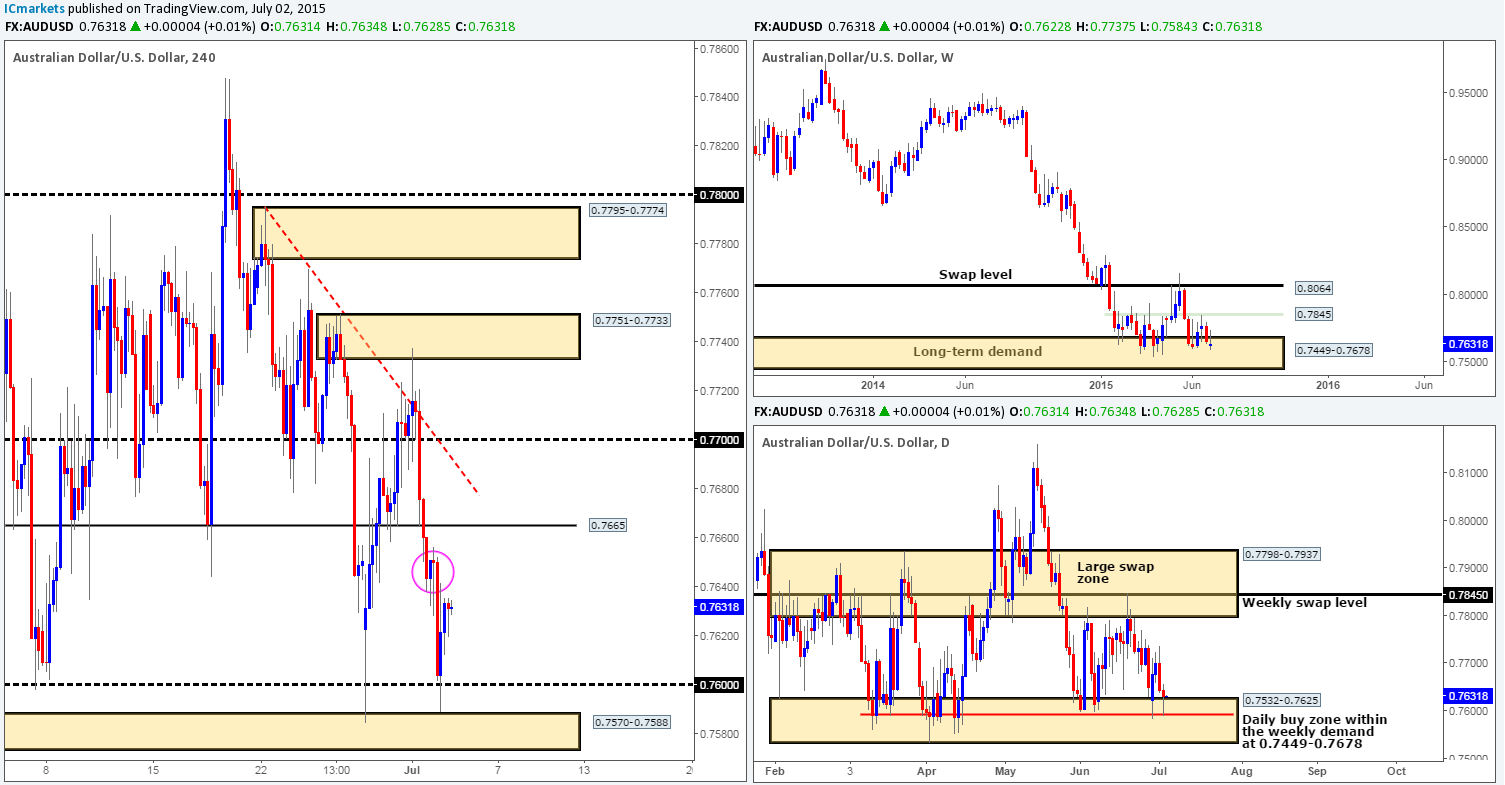
For those who read our previous report on the Aussie, you may recall that we mentioned that until price reaches either the 0.7600 psychological number, or the 4hr demand area lurking just below it at 0.7570-0.7588 (located deep within the daily buy zone at 0.7532-0.7625) we would not consider longs on this pair. As we can all see, the market fell sharply ahead of the NFP report, which brought price down to within touching distance of the above said areas. It was only when the NFP data was released did we see a fakeout below 0.7600, and a near to-the-pip reaction off of the 4hr demand area. Considering how aggressively price rallied from this zone we had little chance of finding any confirmation unfortunately. Well done to any of our readers who managed to lock in some green pips here!
Moving forward, the AUD/USD is in a nice position to continue rallying as far as we can see. Both the weekly and daily action show price firmly trading within demand (0.7449-0.7678/0.7532-0.7625) at the moment. While this may be true, the 4hr timeframe reveals that price is hovering just below an area of 4hr supply circled in pink at 0.7650-0.7637 which could potentially repel this market. Therefore, even with higher timeframe support, we cannot condone buying right now. Ideally, what we’d like to see is a retrace from current prices, and an attack on the 4hr demand area at 0.7570-0.7588 once more. We’d then be confident in beginning our search for lower timeframe confirmed buying opportunities. Failing this, should the market continue north and break above 0.7665, there could be a possible intraday buy trade on any retest seen up to 0.7700.
Levels to watch/ live orders:
- Buys: 0.7570-0.7588 [Tentative – confirmation required] (Stop loss: 0.7570).
- Sells: Flat (Stop loss: N/A).
USD/JPY:
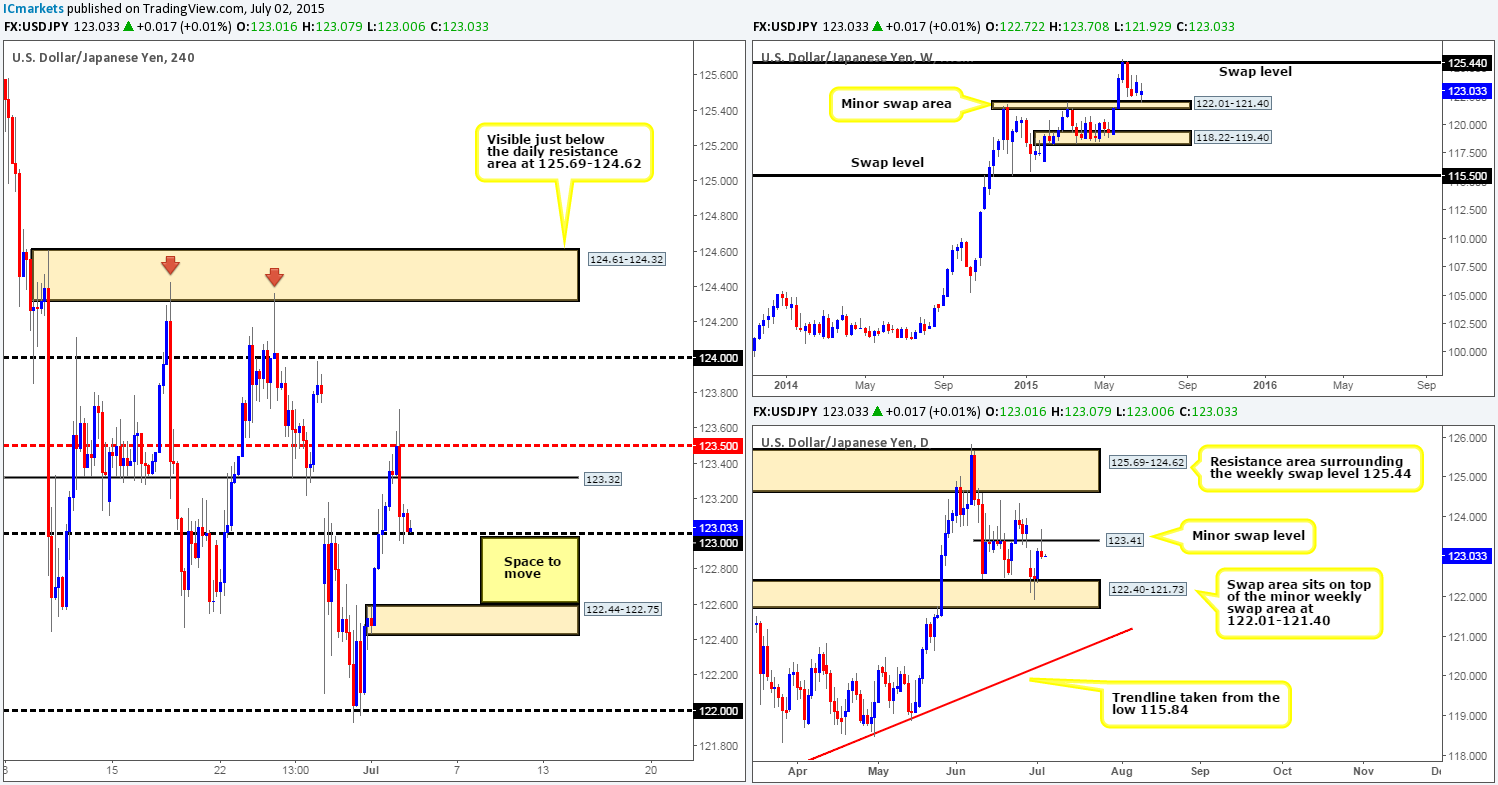
For those who read our previous report http://www.icmarkets.com/blog/thursday-2nd-july-nfp-day-today-prepare-for-volatility/ on the USD/JPY, you may recall that we still had 30% of our remaining long position (121.98) still active ahead of NFP. However, once we saw that the report printed slightly below expected figures, we decided to close our full position at 123.23. Good thing we did as prices continued plummeting down to 123.00.
In the bigger picture, we can see that price is currently reacting from a minor weekly swap (demand) area at 122.01-121.40. Meanwhile, the daily timeframe printed a bearish pin-bar candle off of a minor daily swap (resistance) level coming in at 123.41.
With all of the above taken into consideration, where do we see this market heading to today? Well, we’re receiving somewhat mixed signal from the higher timeframes at the moment (see above in bold), which consequently leaves 123.00 on the 4hr scale clearly in the spotlight. A clean break below this number would likely force this market down to the small 4hr demand area coming in at 122.44-122.75, or even the 122.00 level given enough time (potential selling opportunity on any retest seen).
Conversely, should bids remain strong at 123.00; a move higher could be seen up to 123.32 or the mid-level number 123.50. This a tradable move in our opinion as along as one waits for the right setup on the lower timeframes that allows a tight stop, thus still giving favorable risk/reward.
Levels to watch/ live orders:
- Buys: 123.00 [Tentative – confirmation required] (Stop loss: dependent on where one confirms this level).
- Sells: Flat (Stop loss: N/A).
USD/CAD:
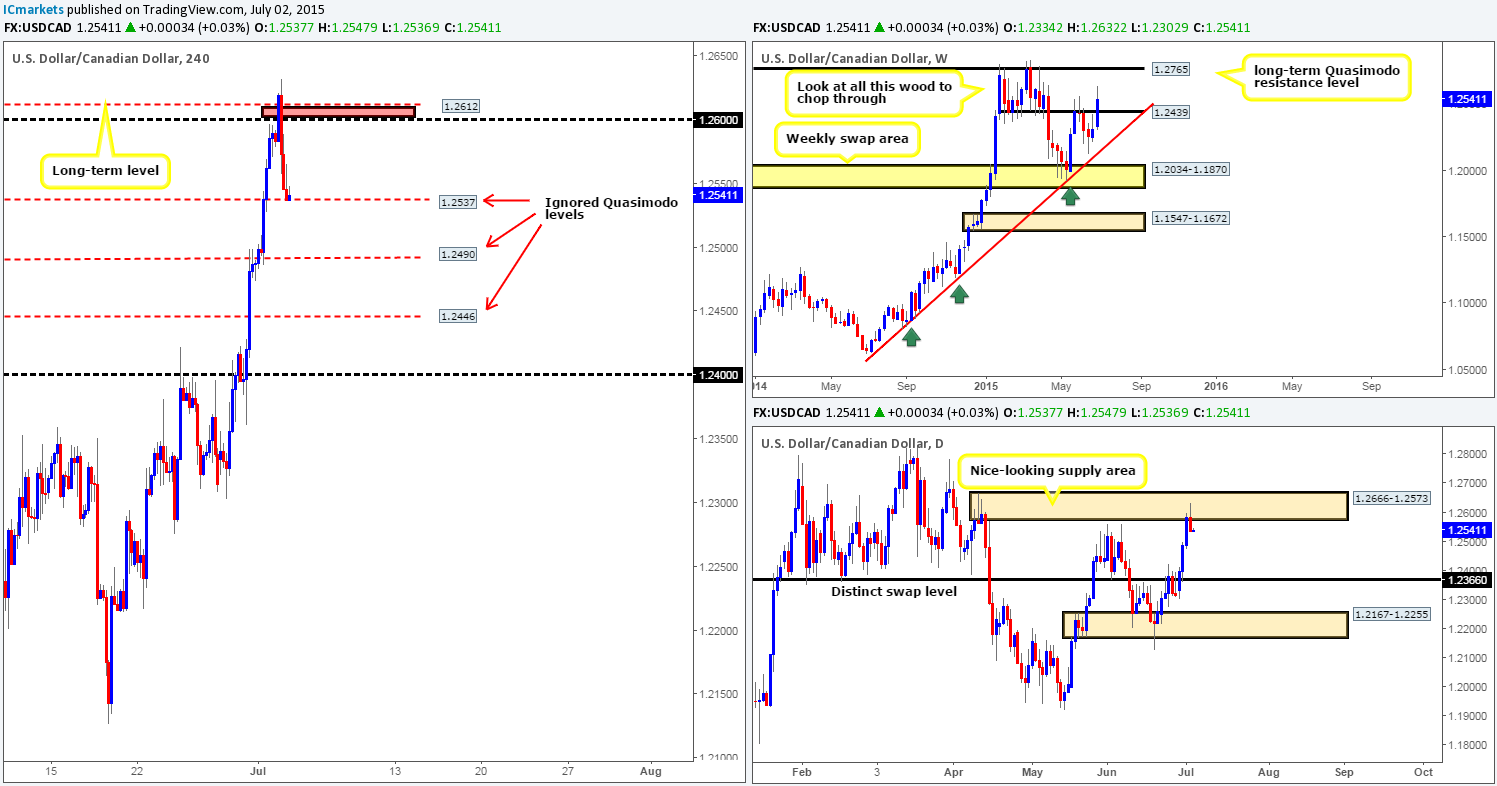
We recently mentioned http://www.icmarkets.com/blog/thursday-2nd-july-nfp-day-today-prepare-for-volatility/ to keep an eye out for selling opportunities around the 1.2600/1.2612 region, which as you can see did eventually sell off, albeit a little higher than anticipated. There was almost picture-perfect confirming price action on the 30 minute timeframe an hour or so before the NFP, which had it not been for this announcement, we would have taken this trade with little hesitation.
The sell off from here dragged prices all the way down to an ignored 4hr Quasimodo level coming in at 1.2537, which for the time being appears to be struggling to hold on. Technically, this selloff should not come as too much of a surprise due to the weekly timeframe trading in a heavily-congested area of resistance between 1.2439/1.2765, and the daily timeframe positioned relatively deep within supply at 1.2666-1.2573.
Given the points made above, we’re going to place buys on the back burner for the time being and focus our attention on shorts. Ultimately, we’re looking for price to break below and retest 1.2537 today. This will give us a good base in which to begin looking for lower timeframe entries into this market, targeting 1.2490 or even 1.2446 – also both ignored 4hr Quasimodo levels.
Levels to watch/ live orders:
- Buys: Flat (Stop loss: N/A).
- Sells: Flat (Stop loss: N/A).
USD/CHF:
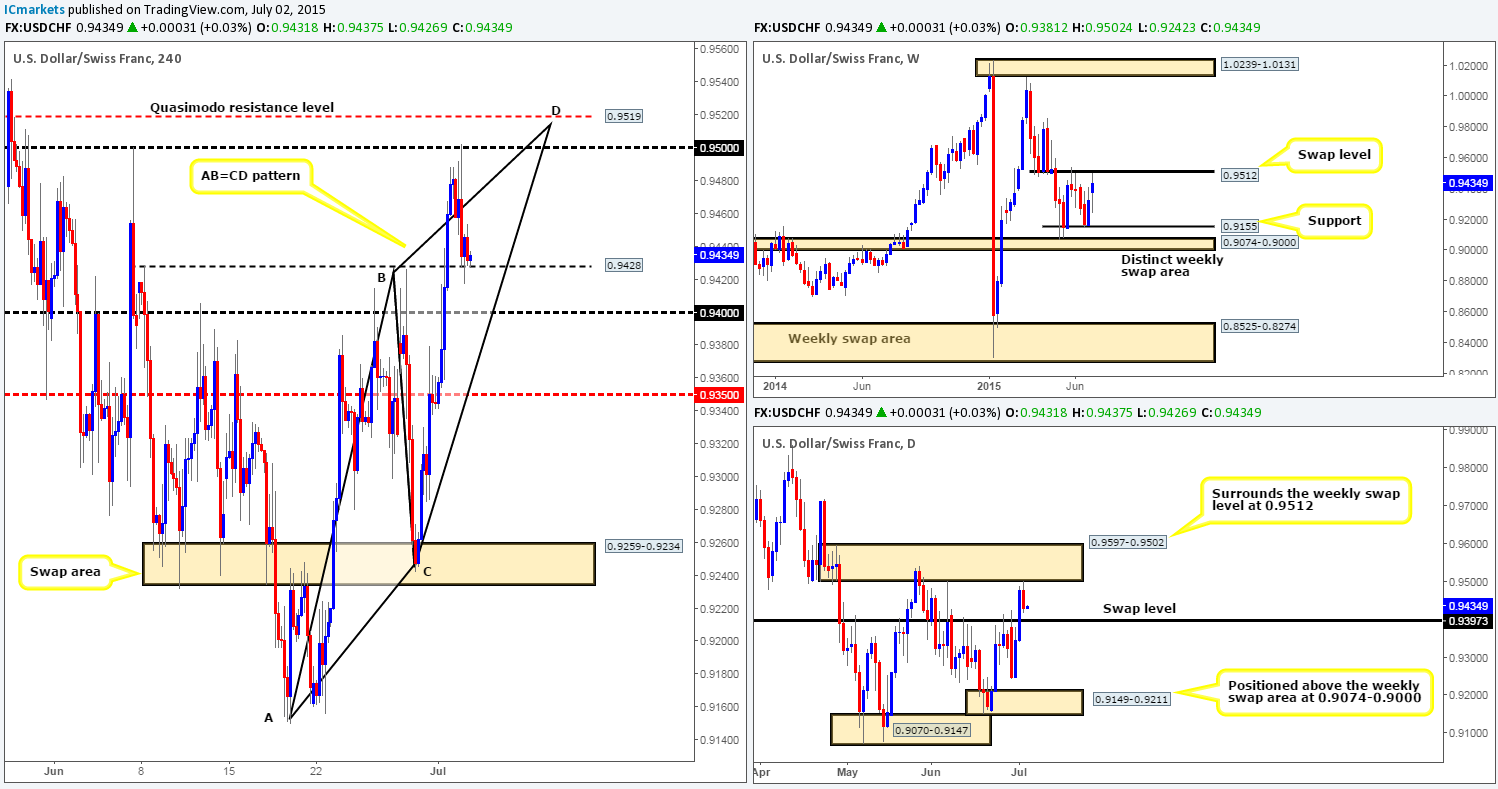
Upon reaching the psychological threshold 0.9500 yesterday, heavy offers piled into the USD/CHF pair on the back of slightly disappointing employment figures. This move resulted in price connecting with a 4hr swap level coming in at 0.9428, which as you can see is currently holding.
In yesterday’s report we explained how we were targeting the 4hr Quasimodo resistance level at 0.9519 as a sell off point. If 0.9428 continues to hold going into the London session today, we may see price rally and still hit 0.9519, so we’re not giving up hope just yet. Here are the reasons for valuing 0.9519 (copied from yesterday’s analysis):
- The 4hr Quasimodo resistance level is lurking just above the round number 0.9500 making it a nice fakeout barrier.
- A Harmonic AB=CD pattern completes right at the point of our 4hr Quasimodo resistance level.
- As per the weekly timeframe, we can see that price is now only a few pips away from greeting the weekly swap level at 0.9512 (encompassed by the daily supply area at 0.9597-0.9502).
If price continues lower today, however, and connects with 0.9400, we’re expecting some sort of reaction here due it also being a swap level visible on the daily scale at 0.9397.
So, to sum up, if price reaches the 0.9519 region today, we may consider selling if the lower timeframe price action is also agreeable. Conversely, should the market attack 0.9400, short-term confirmed longs are a possibility from here, targeting 0.9428 which will be resistance at that point.
Levels to watch/ live orders:
- Buys: 0.9400 [Tentative – confirmation required] (Stop loss: dependent on where one confirms this barrier).
- Sells: 0.9519 [Tentative – confirmation required] (Stop loss: dependent on where one confirms this level).
XAU/USD: (Gold)
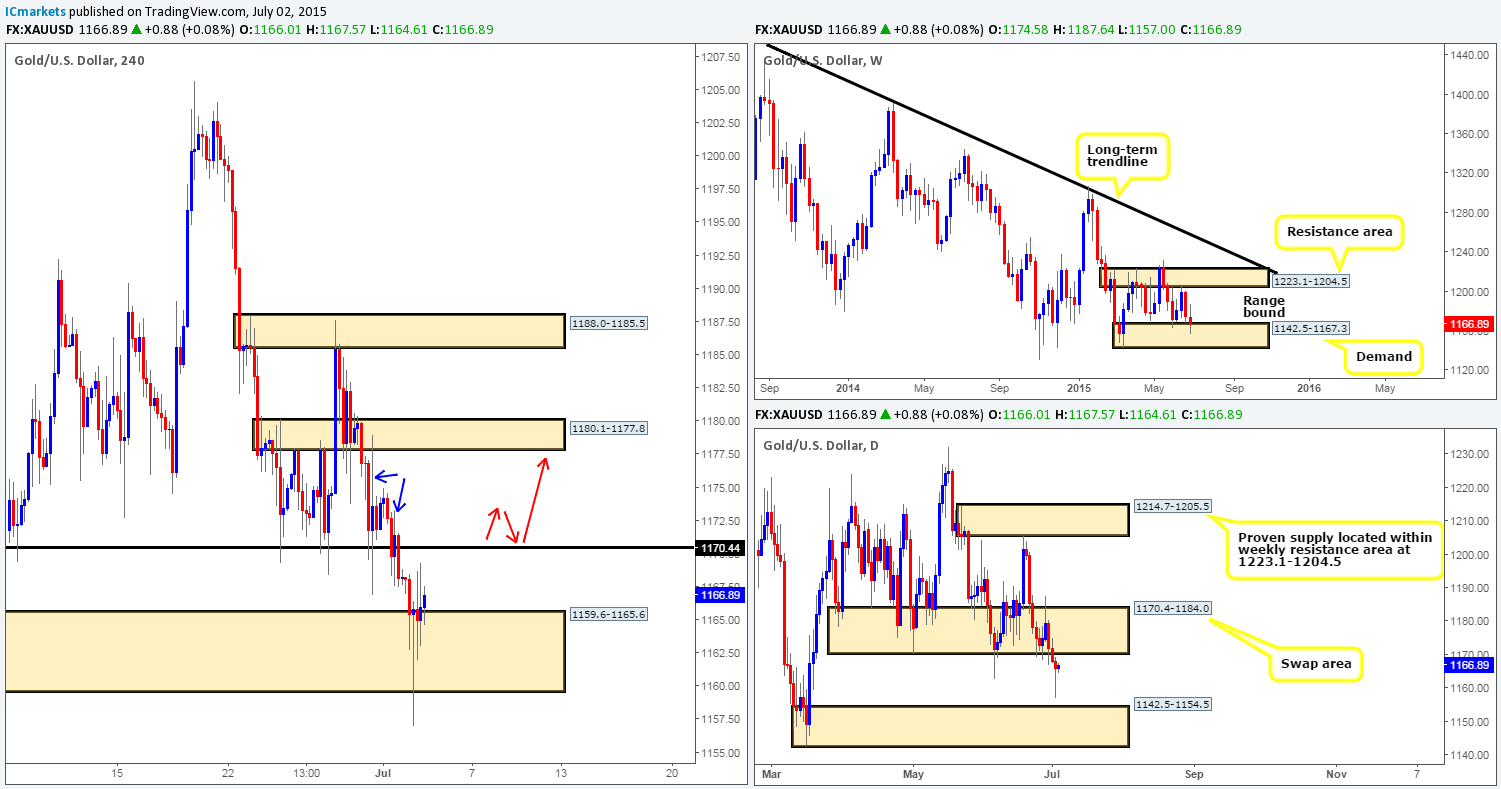
Recent events show price spiked below the 4hr demand area at 1159.6-1165.6, then followed with a sharp break north capitalizing on the weak U.S employment figures. Judging from the two wicks seen at 1168.6/1169.2, we believe this market will continue to push higher today at least until 1170.4 – the lower limit of the daily swap area 1170.4-1184.0. If we get a break above this barrier, however, things will likely get interesting. The wicks marked with blue arrows at 1173.3/1178.9 represent what we like to call supply consumption wicks, which in effect, inform us that if price does indeed get above 1170.4, we’re likely heading higher to at least the 4hr swap area at 1180.1-1177.8.
Supporting higher prices is the weekly timeframe, which as you can see is currently sitting at the top-side of weekly demand at 1142.5-1167.3. However, against this trade is the fact that price has recently broke below the daily support barrier, which is the daily swap area just mentioned above at 1170.4-1184.0, thus clearing the path south for a run down to the daily demand area at 1142.5-1154.5 (located deep within the aforementioned weekly demand area).
With all the points made above taken on board, here is what we have in mind so far:
- Watch for a break above 1170.4, and look to trade any confirmed retest seen, targeting the 4hr swap area at 1180.1-1177.8 as per the red arrows.
- If price continues to decline as it has been doing for much of this week, we’re looking at playing the 4hr Quasimodo support level below the recently spiked 4hr demand at 1149.6 for a potential long trade (positioned deep within both weekly and daily demand areas mentioned above). Since this level is so well positioned, we’d usually be relatively confident in setting a pending buy order here, but with it being the last day of trade and the US heading out for Independence Day, we would only enter long here if lower timeframe confirming price action was also present.
Levels to watch/ live orders:
- Buys: 1149.6 [Tentative – confirmation required] (Stop loss: dependent on where one confirms this level).
- Sells: Flat (Stop loss: N/A).


