
DXY:
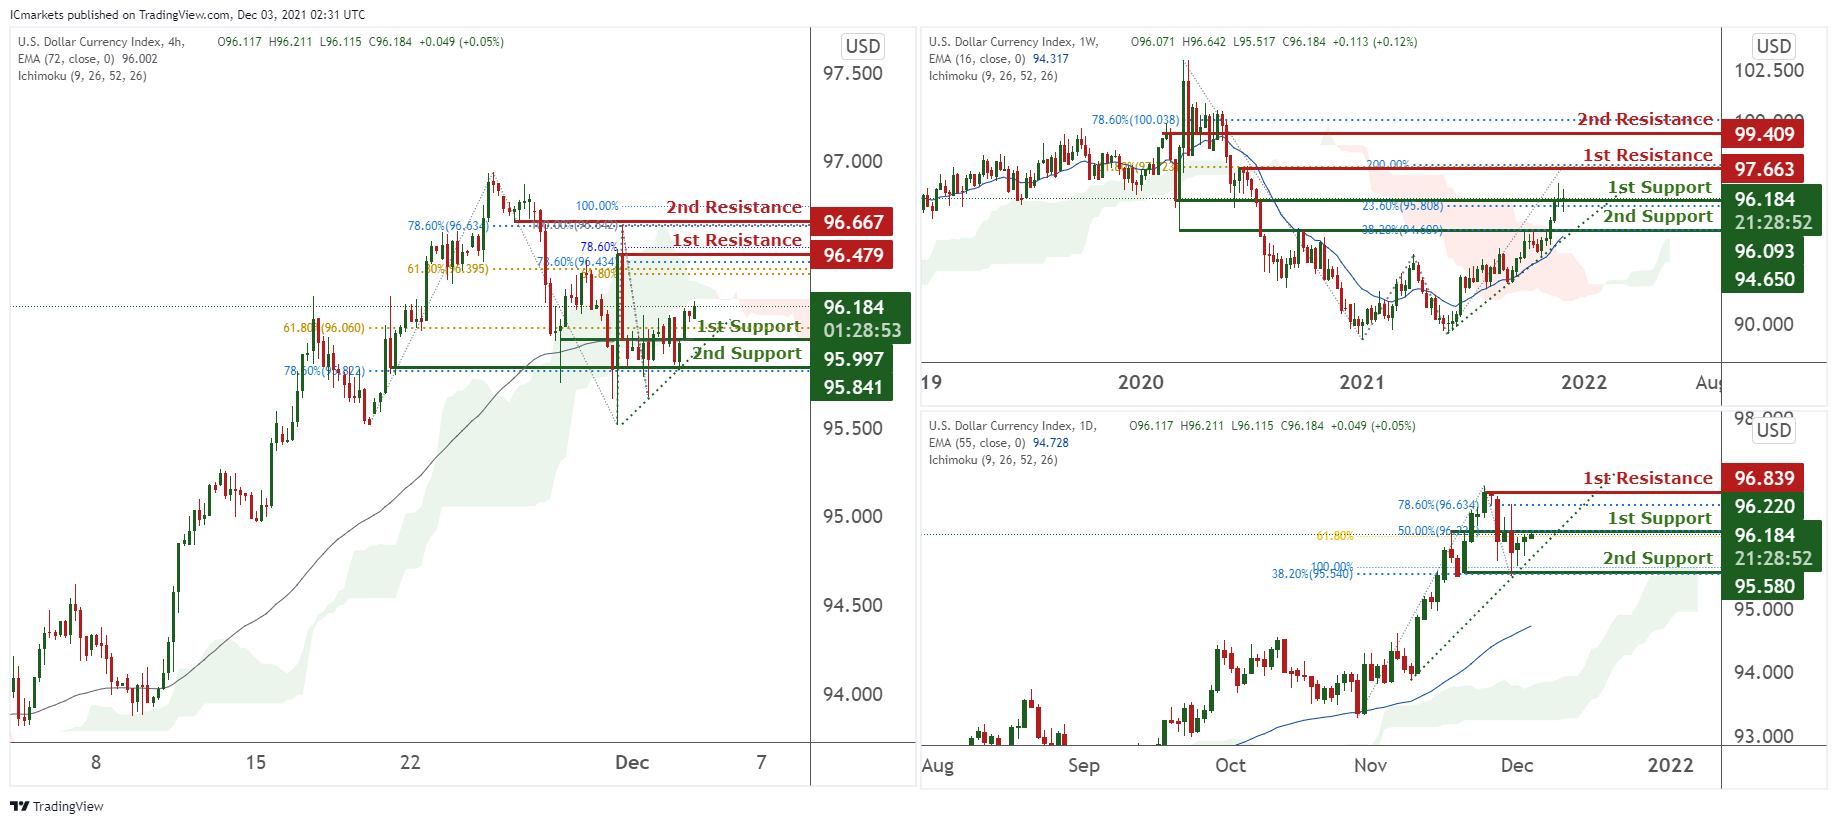
On the weekly, prices are on bullish momentum and abiding to our ascending trendline. We see potential for prices to climb from our 1st Support at 96.093 in line with 23.6% Fibonacci retracement towards our 1st resistance at 97.663 in line with 200% Fibonacci projection. Technical indicators are showing bullish momentum.
On the daily, prices are on a bullish momentum and abiding to a bullish trendline. We see potential for prices to retest our 1st support at 96.166 in line with 50% and 61.8% Fibonacci retracement towards our 1st resistance at 96.839 in line with 78.6% Fibonacci retracement. Technical indicators are showing bullish momentum.
On the H4 timeframe, prices are on a bullish momentum and abiding to a daily ascending trendline. We see the potential for prices to continue to climb towards our 1st resistance at 96.123 in line with 23.6% retracement towards our 1st resistance at 96.479 in line with 78.6% Fibonacci extension and 78.6% Fibonacci retracement. Technical indicators are showing bullish momentum. Alternatively, prices might retest our 2nd support at 96.123 which is a graphical overlap and in line with 50% and 78.6% Fibonacci retracement.
Areas of consideration:
- H4 time frame, 1st resistance at 96.479
- H4 time frame, 1st support at 96.123
XAU/USD (GOLD):
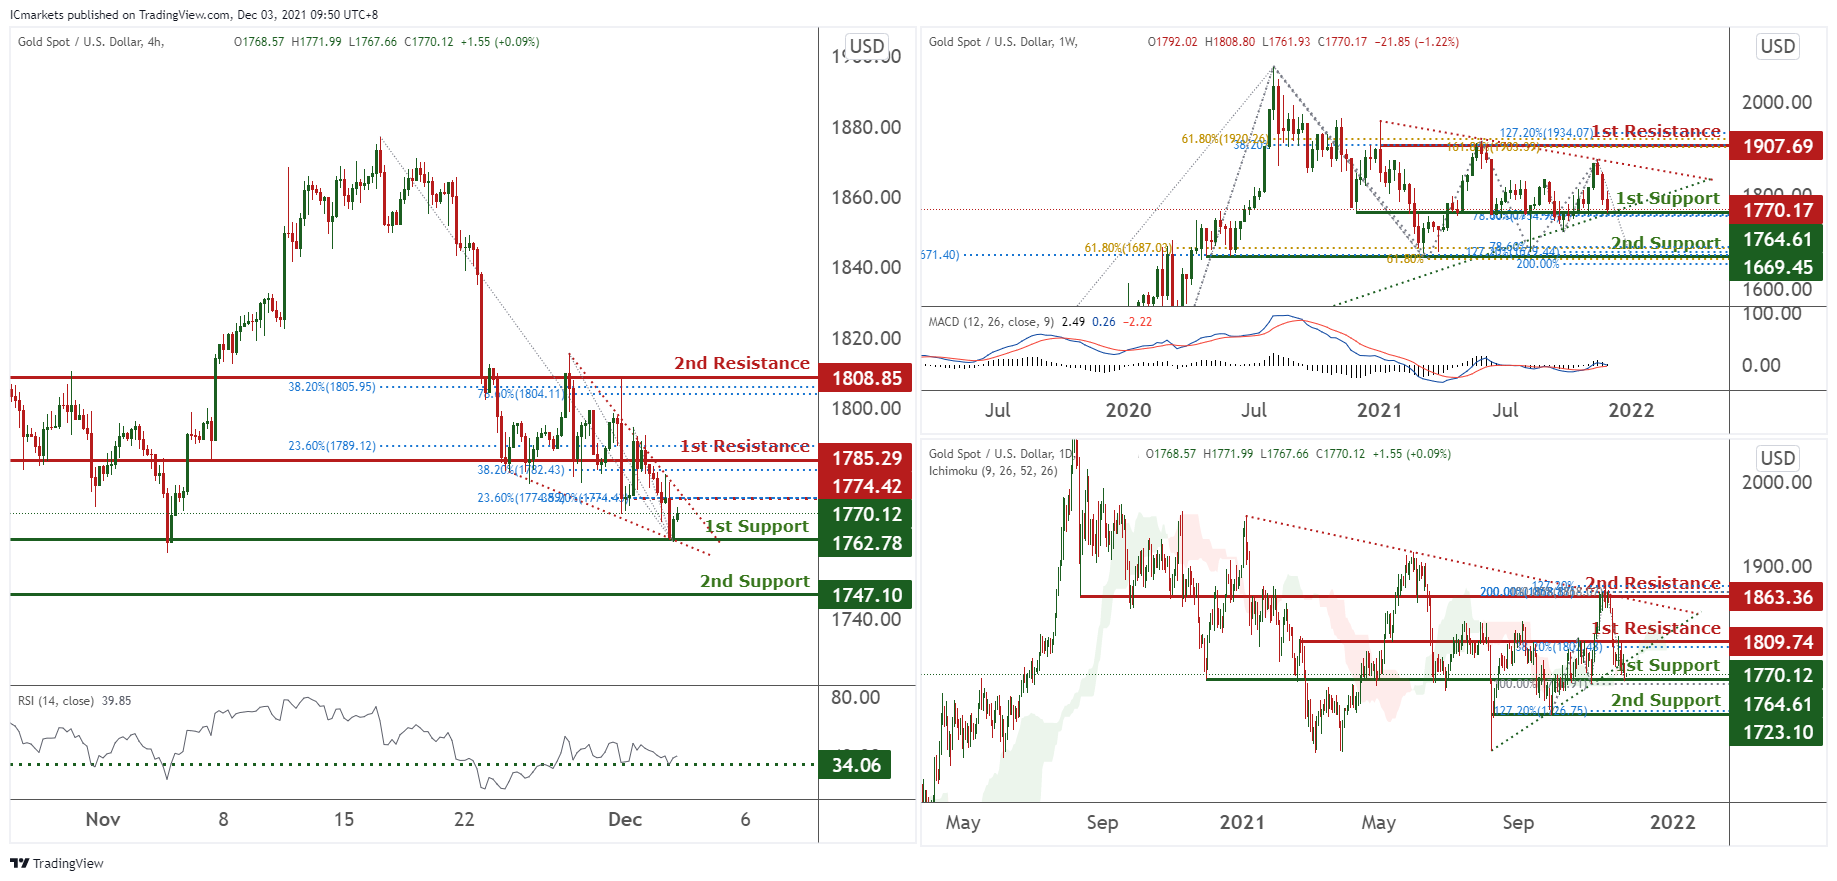
On the weekly, prices are consolidating in a triangle and have the potential to climb towards our 1st resistance at 1907.69 from our 1st support at 1764.61 in line with 78.6% Fibonacci extension and 50% Fibonacci retracement. Technical indicators are showing bullish momentum. Alternatively, prices may dip towards our 2nd support which is an area of Fibonacci confluences.
On the daily, prices are consolidating in a triangle and have recently broken out of our ascending trendline. We see potential for prices to climb from our 1st support at 1764.61 in line with 100% Fibonacci retracement towards our 1st resistance at 1809.94 in line with 38.2% Fibonacci retracement and also graphical overlap. Technical indicators are showing bullish momentum.
On the H4 chart, prices are consolidating in a bearish engulfing triangle. We would watch our intermediate resistance at 1774.42 in line with 23.6% and 38.2% Fibonacci retracement for a breakout of our triangle for a long entry towards our 1st resistance at 1785.29 in line with 23.6% and 38.2% Fibonacci retracement. Technical indicators are showing bullish momentum. Alternatively, a reversal at our intermediate resistance will find prices dipping towards our 1st support at 1762.78 which is a graphical swing low.
Areas of consideration:
- 4h intermediate resistance at 1774.42
- 4h 1st resistance at 1785.29
- 4h 1st support at 1762.78
GBP/USD
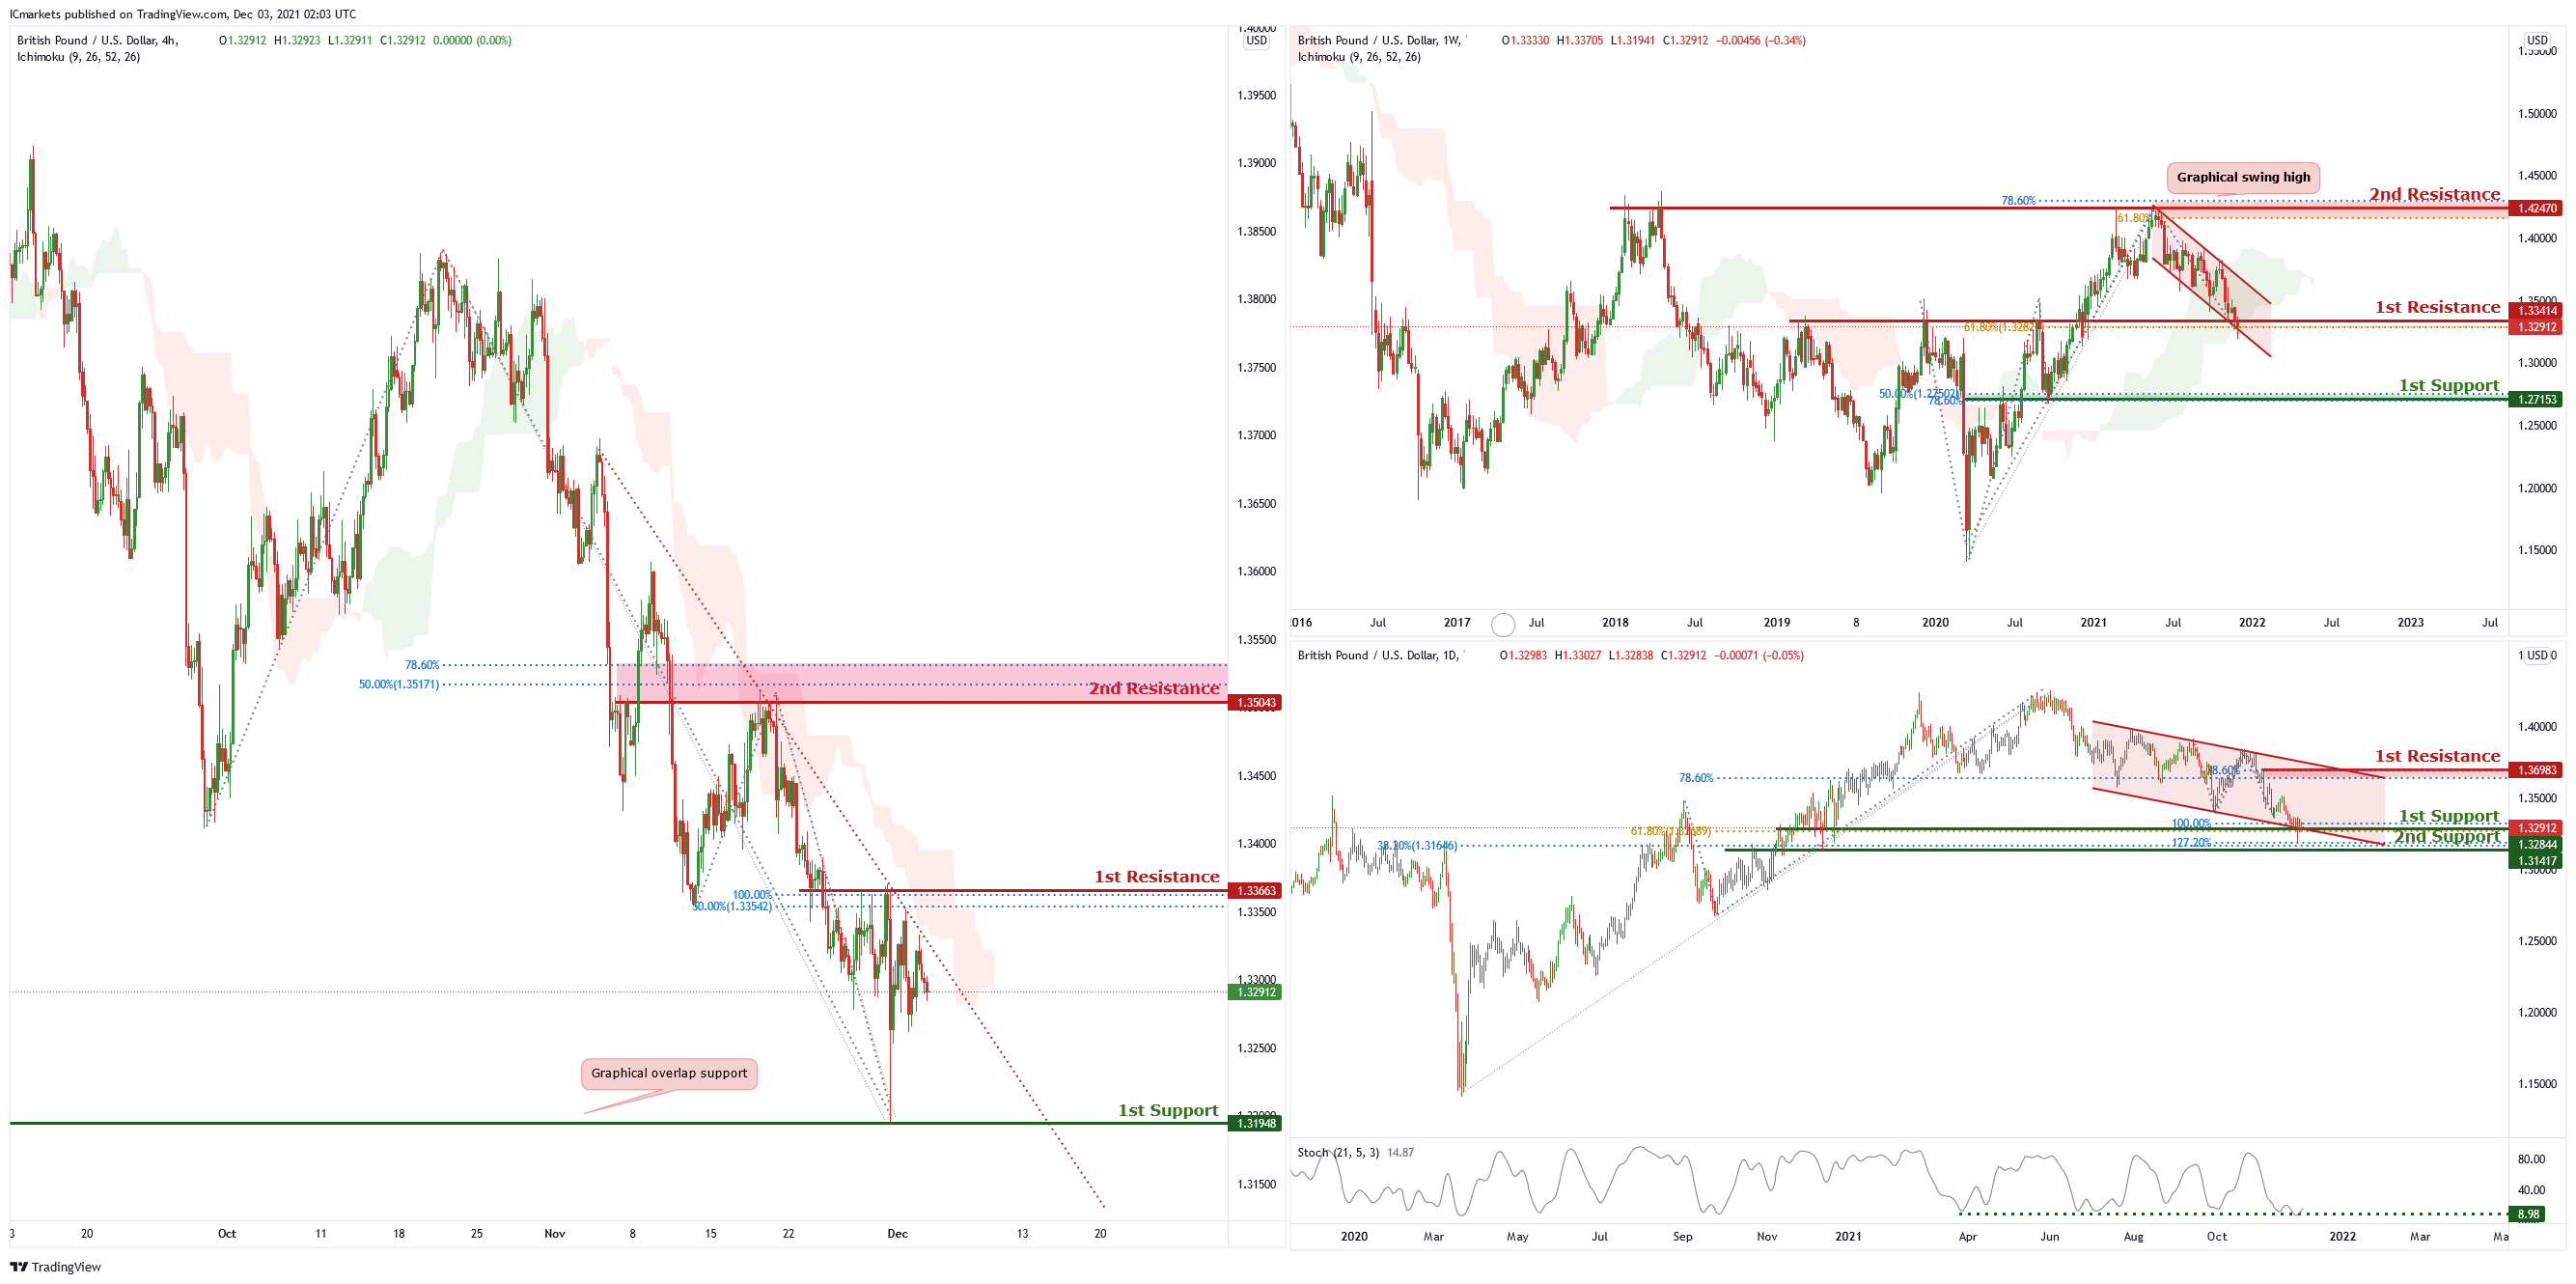
On the weekly chart price is trading in a descending channel and is near the first resistance level of 1.3872 which is also 61.8 Fibonacci retracement. Price can potentially dip to the first support level of 1.27153 which is 50% Fibonacci retracement and 78.6% Fibonacci projection. Our bearish bias is supported by the ichimoku cloud indicator as price is trading below it.
On the daily chart, price is trading in a descending channel and is near the first support of 1.32844 of 1.27153 which is 50% Fibonacci retracement and 78.6% Fibonacci projection. Price can potentially bounce from the first support to the first resistance level of 1.36983 which is also 38.6% Fibonacci retracement and 78.6% Fibonacci projection. Our bullish bias is supported by the stochastic indicator as it is at support level.
On the H4 chart, price is trading on a descending trendline and near the first resistance of 1.33663 which is also 100% Fibonacci projection and 50% Fibonacci. Price can potentially dip to the first support level of 1.31948 which is the graphical overlap support level. Our bearish bias is supported by the ichimoku cloud indicator as price is trading below it.
Areas of consideration :
H4 first support – 1.31948
H4 first resistance – 1.33663
USD/CHF:
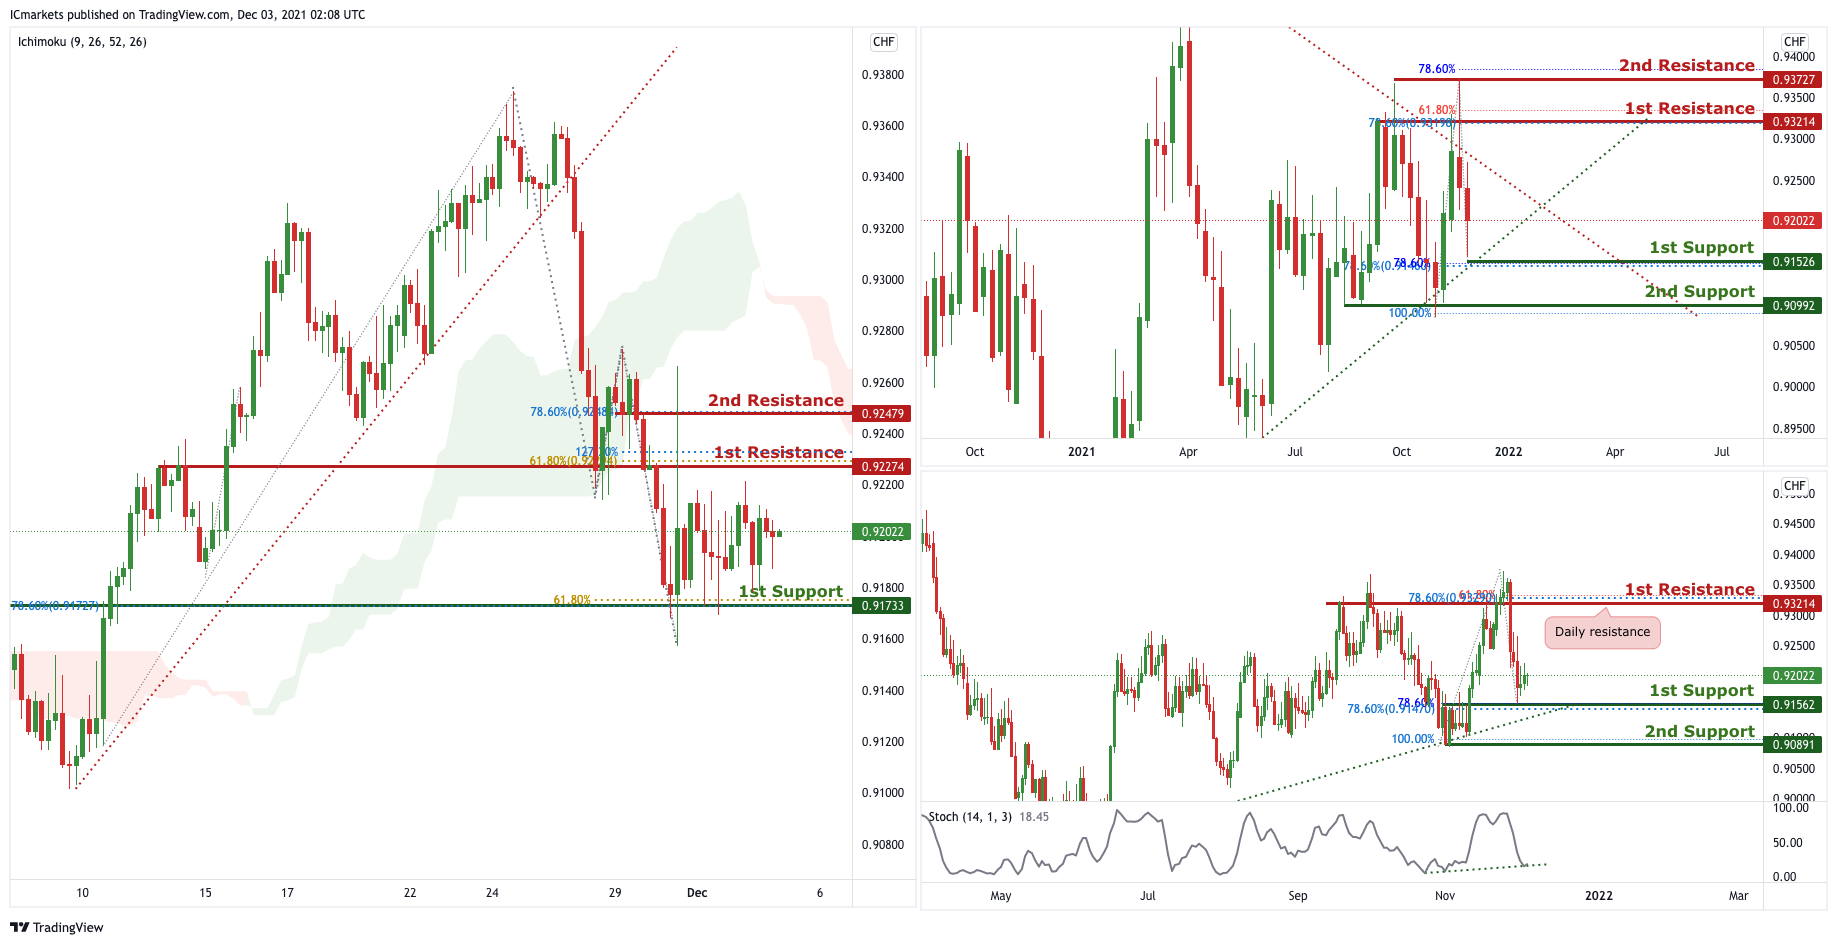
On the Weekly timeframe, price is reacting in a triangle pattern. Traders should wait for the price to swing higher or lower before entering. On the Daily timeframe, we can expect an overall bullish momentum. Price could bounce from 1st Support in line with 78.6% Fibonacci retracement and 78.6% FIbonacci projection towards 1st Resistance in line with 78.6% Fibonacci retracement and 61.8% Fibonacci projection. Our bullish bias is further supported by the stochastics indicator where the %D line is abiding to the ascending trendline.
On the H4 timeframe, price broke out of the ascending trendline support, signifying an overall bearish momentum. We can expect price to drop from 1st Resistance in line with 127.2 % Fibonacci projection and 61.8% Fibonacci retracement towards 1st Support in line with 61.8% Fibonacci projection and 78.6% Fibonacci retracement. Our bearish bias is further supported by the price holding below the Ichimoku Cloud. Price is currently in between 1st Resistance and 1st Support, traders should wait for the price to swing higher or lower before entering.
Areas of consideration:
- Watch 1st Support at 0.91733
- Watch 1st Resistance at 0.92274
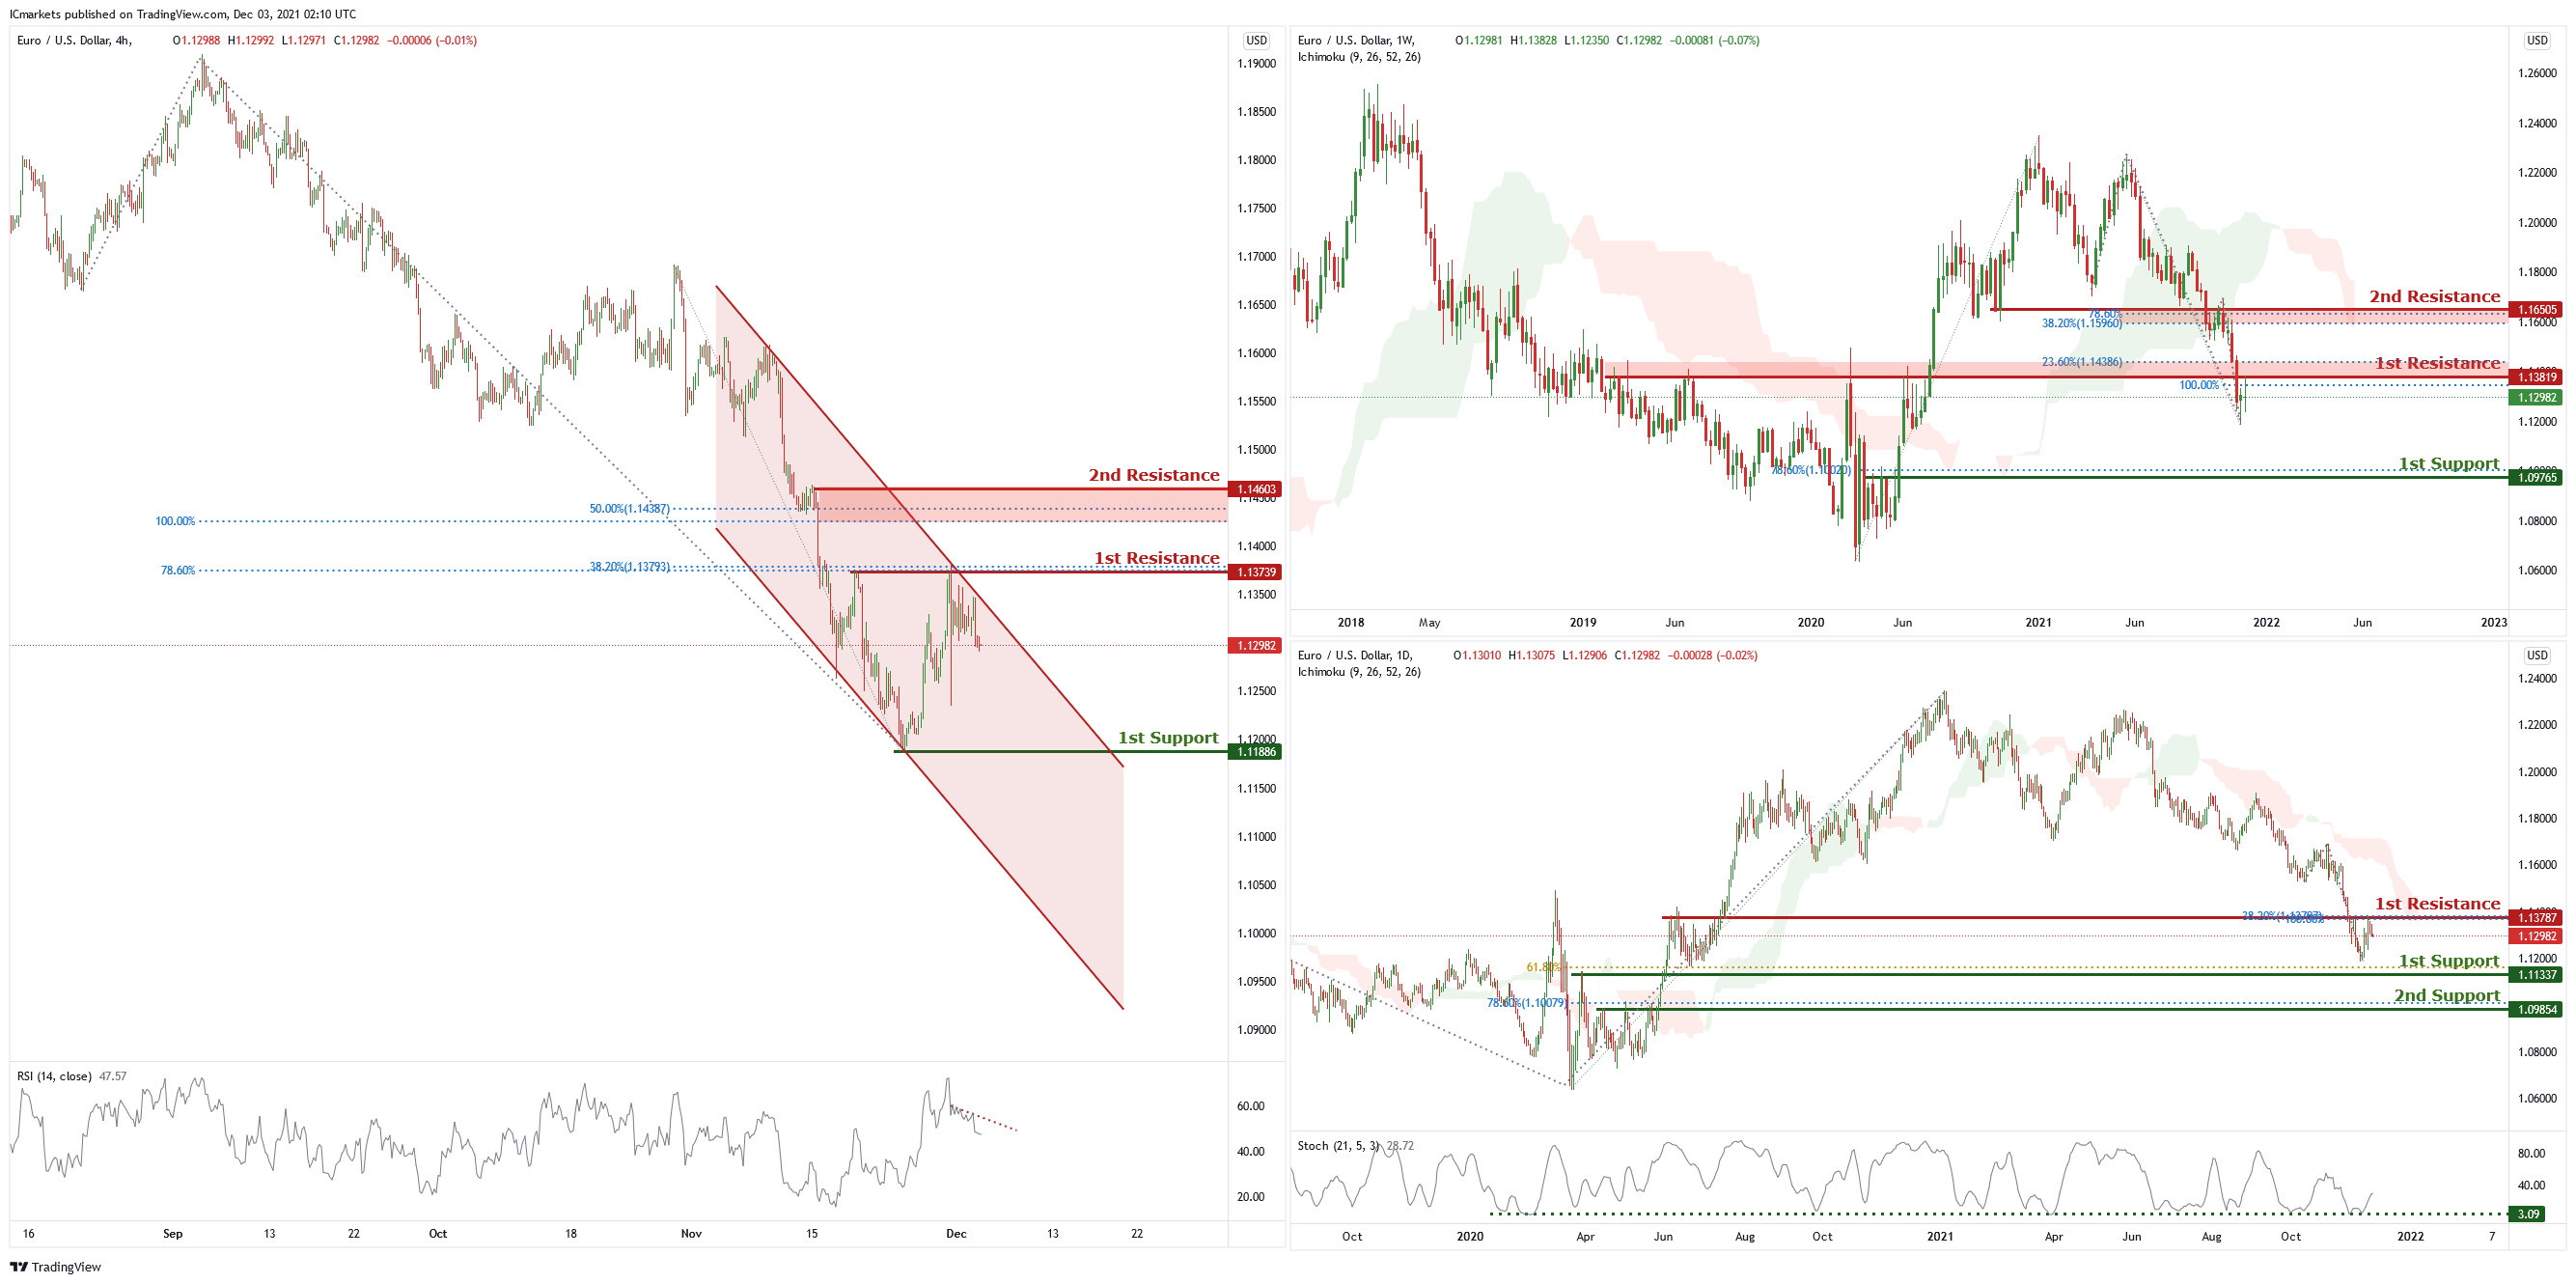
EUR/USD :
On the weekly chart price is near the first resistance level of 1.13819 which is also 100% Fibonacci projection and 23.6% Fibonacci retracement. Price can potentially dip to the first support level of 1.09765 which is also 78.6% Fibonacci retracement. Our bearish bias is supported by the ichimoku cloud indicator as price is trading below it.
On the daily chart, price is near the first resistance of 1.13787 which is 38.2% Fibonacci retracement and 100% Fibonacci projection. Price can potentially dip to the first support level of 1.11337 which is also 61.8% Fibonacci retracement. Our bearish bias is supported by the Ichimoku cloud indicator as price is trading below it.
On the H4 chart, price is trading in a descending channel and near the first resistance level of 1.13739 which is also 38.2% Fibonacci retracement and 78.6% Fibonacci projection. Price can potentially dip to the first support level of 1.11886 which is also the graphical swing low level. Our bearish bias is supported by the RSI indicator as it is trading on a descending trendline.
Areas of consideration :
H4 1st support – 1.11886
H4 1st resistance – 1.13739
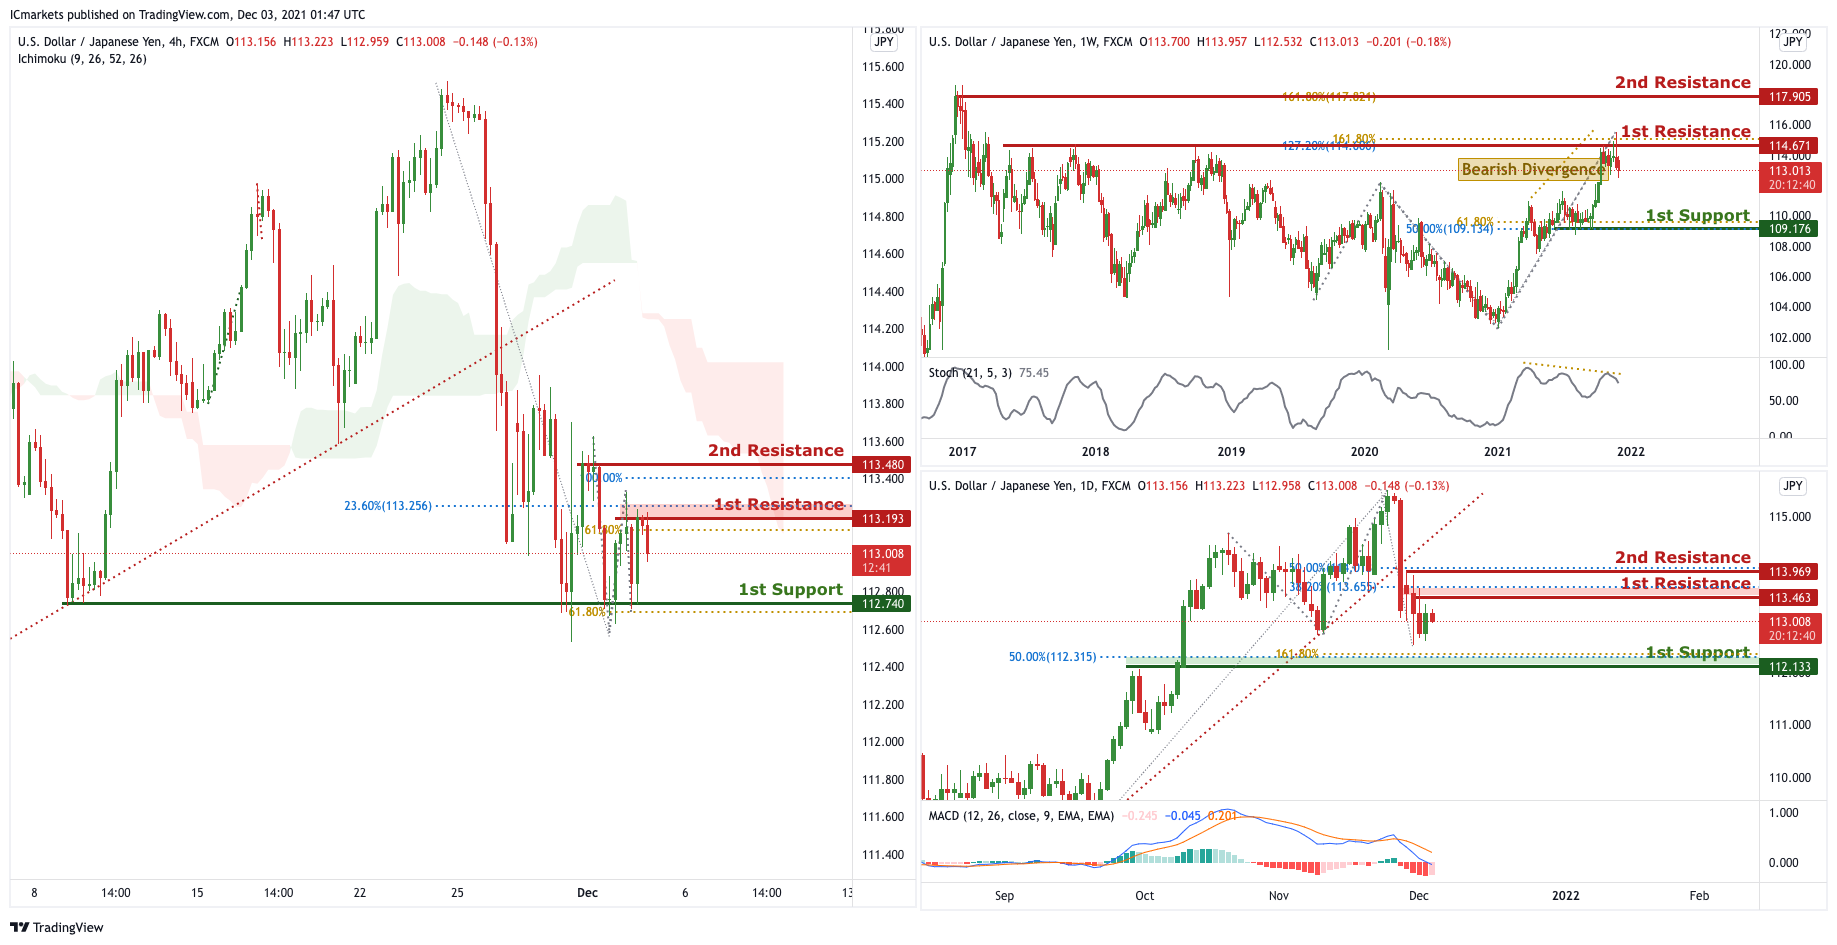
USD/JPY:
On the Weekly timeframe, we can see that price touched the 1st resistance in line with horizontal swing highs and 127.2% FIbonacci Retracement and 161.8% Fibonacci Projection. We can expect the price to drop from the 1st Resistance towards the 1st Support in line with 61.8% Fibonacci projection and 50% Fibonacci retracement. Our short-term bearish momentum is further supported by the stochastic %K line holding below the descending trendline resistance and bearish divergence spotted. On the Daily timeframe, we can expect price to drop from 1st Resistance in line with 38.2% Fibonacci retracement towards 1st Support in line with 50% Fibonacci retracement and 161.8% Fibonacci projection. Our bearish bias is further supported by the MACD indicator where the signal line crosses above the MACD line.
On the H4 timeframe, price broke out of the ascending trendline support, signifying a bearish momentum. We can now expect the price to drop from 1st Resistance in line with 61.8% Fibonacci projection and 23.6% Fibonacci retracement towards 1st Support in line with 61.8% FIbonacci projection and horizontal support. Our bearish bias is further supported by the ichimoku cloud indicator where price is holding below it .
Areas of consideration:
- H4 1st resistance level 113.193
- H4 1st support level 113.052
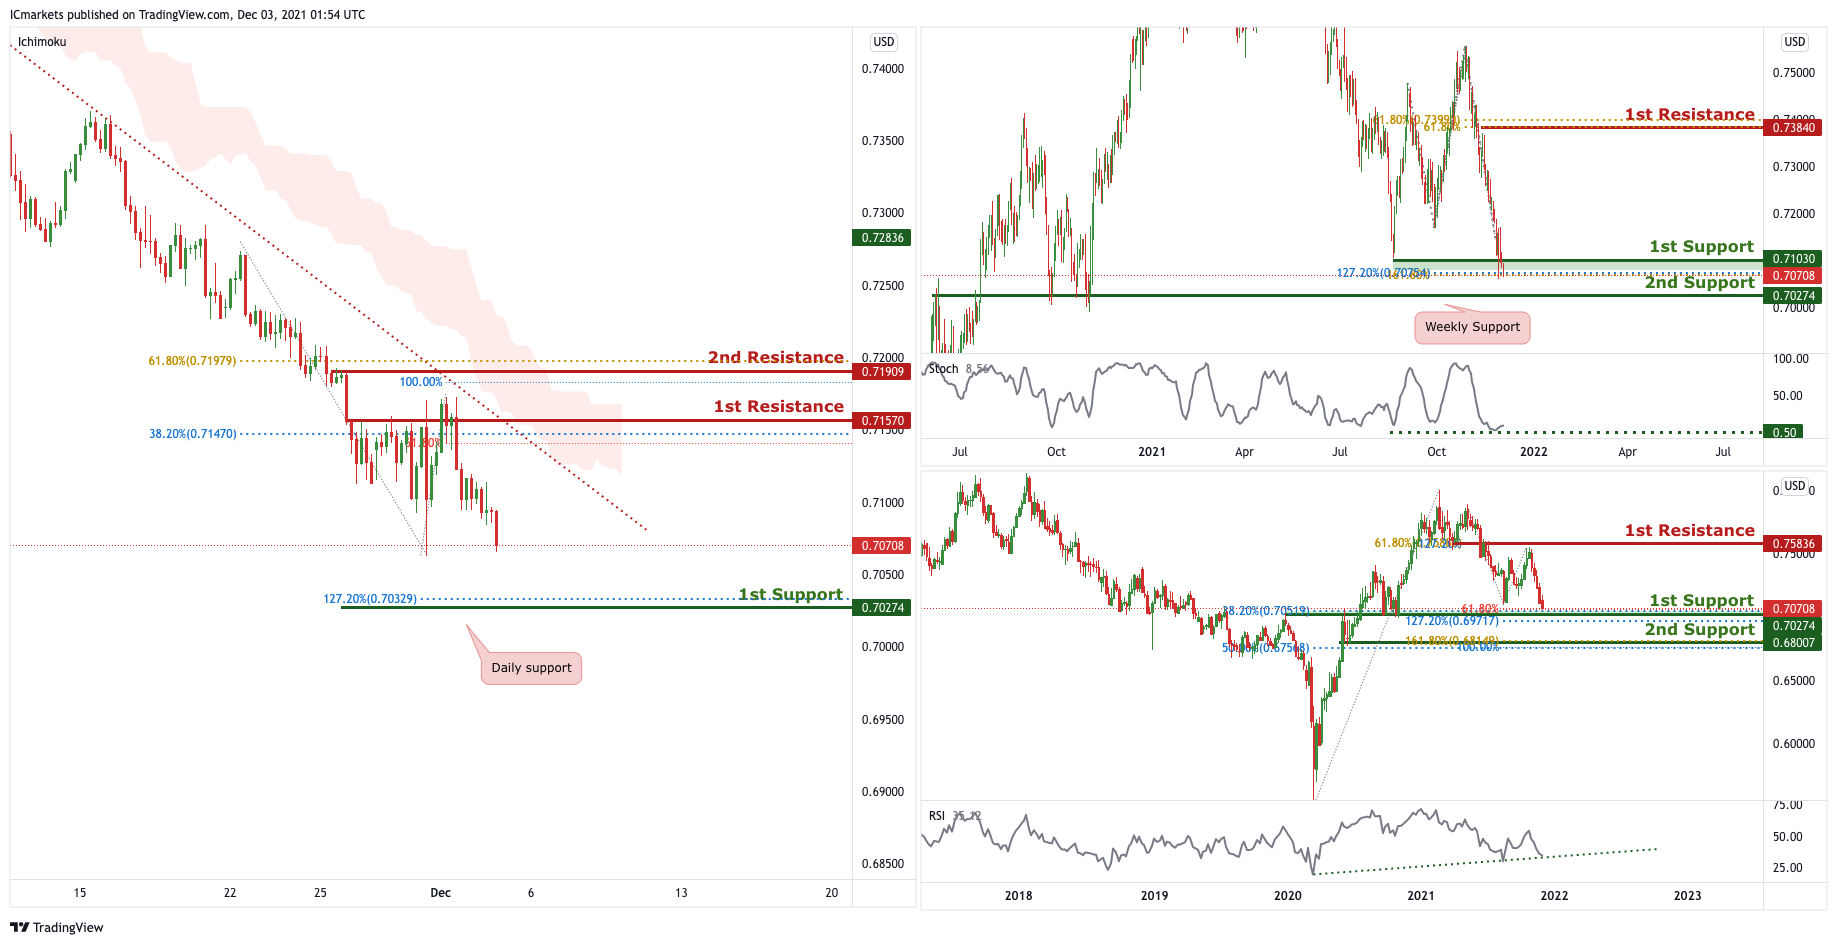
AUD/USD:
On the weekly, we can now expect the price to bounce from the 1st Support in line with 61.8% Fibonacci projection, 38.2 % FIbonacci retracement and 127.2% Fibonacci extensions. Our bullish bias is further supported by the RSI indicator abiding to an ascending trendline. On the Daily, the price is at the 1st support, we can expect price to bounce from 1st Support in line with 127.2% extension and 161.8% Fibonacci projection towards 1st Resistance in line with 61.8% FIbonacci projection and 61.8% Fibonacci retracement.
In reference to yesterday’s analysis price indeed dropped from the 1st Resistance level @ 0.71570. On the H4, price is abiding to the descending trendline resistance, signifying bearish momentum. We can expect the price to drop from 1st Resistance 38.2% Fibonacci retracement and 61.% Fibonacci projection towards 1st Support in line with 127.2% Fibonacci retracement and daily support. Our bearish bias is further supported by the Ichimoku cloud indicator where price is holding below it. Price is right now in the middle, traders should wait for the price to swing higher or lower before entering.
Areas of consideration:
- H4 1st resistance level 0.71570
- H4 1st support level 0.70274
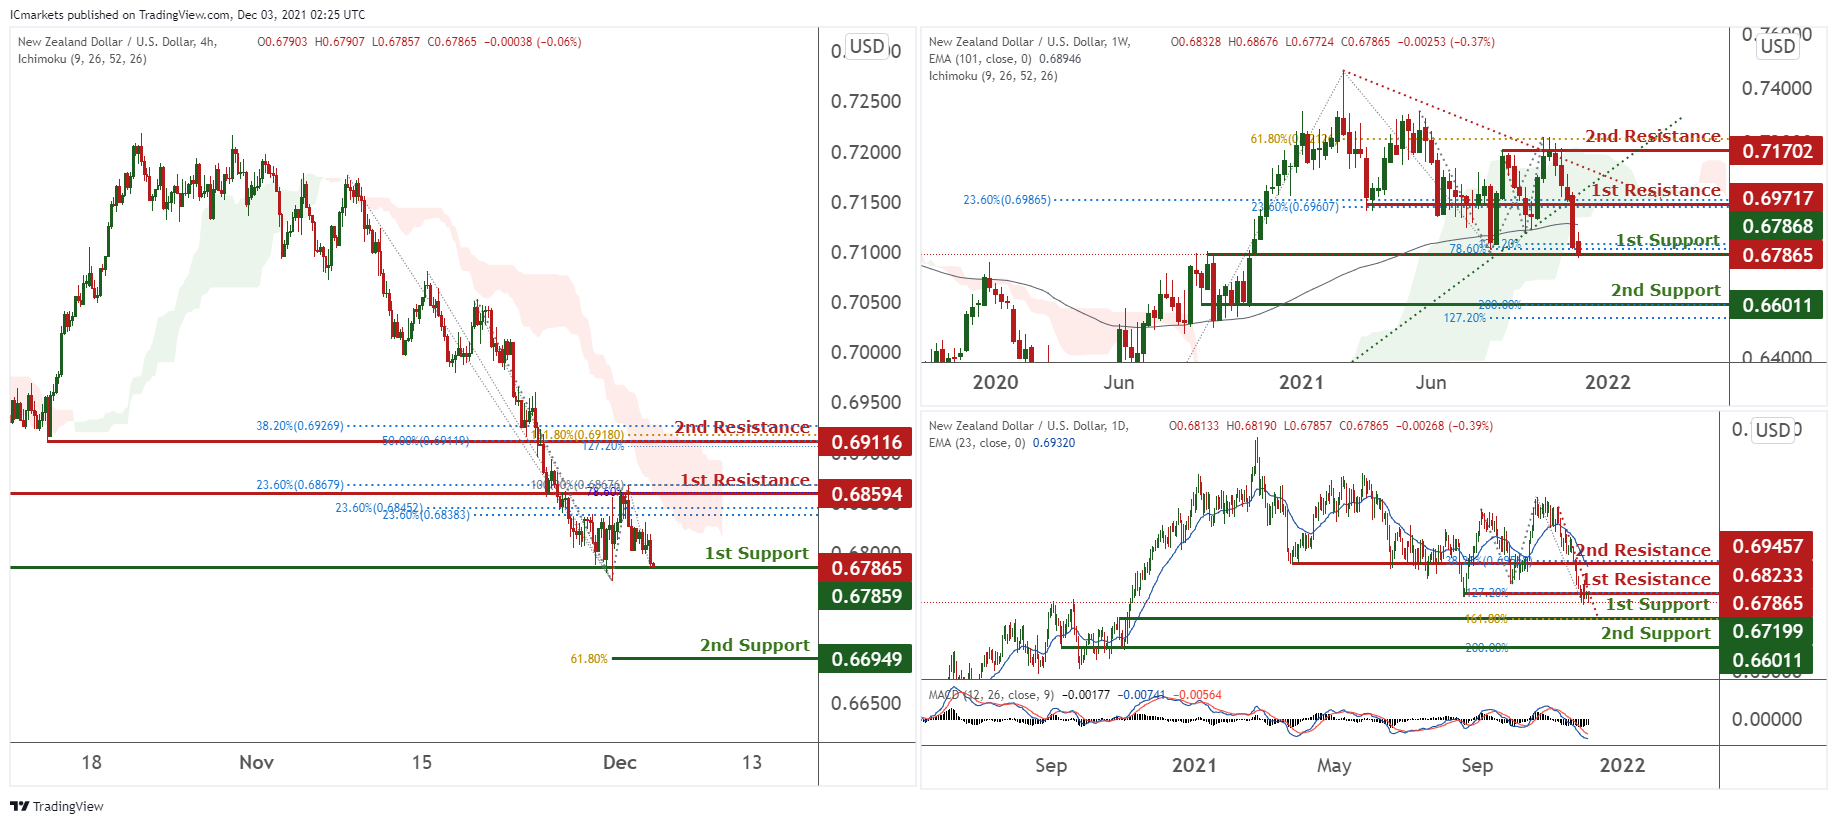
NZD/USD:
On the weekly, prices have recently broken out of our triangle and are testing our 1st support at 0.67868 which is an area of Fibonacci confluences. We see potential for a bounce towards our 1st resistance at 0.69717 in line with 23.6% Fibonacci retracement and 23.6% Fibonacci retracement. Technical indicators are showing bullish momentum. Alternatively, if prices break our 1st support, we might find it dipping towards our 2nd support at 0.66011 in line with 127.2% and 200% Fibonacci projection.
On the daily, prices are on bearish momentum and abiding to our bearish trendline. We see potential for prices to dip from our 1st resistance at 0.68233 in line with 127.2% Fibonacci extension towards our 1st support at 0.67199 in line with 161.8% Fibonacci extension. As technical indicators are bearish momentum.
On the H4 timeframe, prices are consolidating sideways. We see potential for prices to experience a small bounce towards our 1st resistance at 0.68594 which is an area of Fibonacci confluences from our 1st support at 0.67859 which is a recent swing low. If prices break our 1st support, prices can potentially dip further towards our 2nd support at 0.66949 in line with 61.8% Fibonacci extension.
Areas of consideration:
- H4 time frame, 1st resistance at 0.68594
- H4 time frame, 1st support at 0.67859
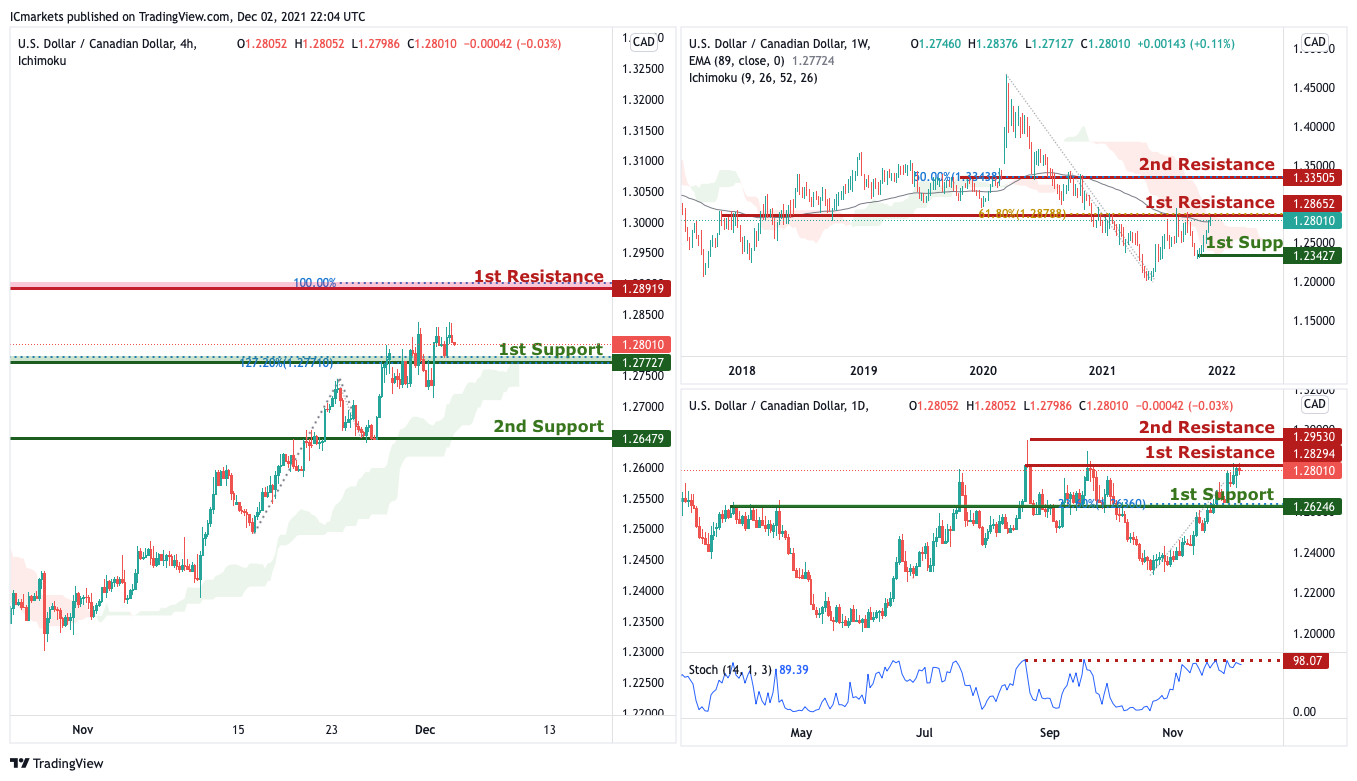
USD/CAD:
On the Weekly timeframe, price tested and reacted below long term moving average and the resistance of the ichimoku, we are expecting to see a bearish move from 1st resistance at 1.28652 in line with the horizontal overlap resistance and 61.8% Fibonacci retracement to 1st support at 1.23427 in line with the horizontal swing low support. Alternatively, price may break 1st resistance structure and head for 2nd resistance at 1.33505 in line with the 50% Fibonacci retracement
On the Daily, with price rejecting the resistance on the stochastics indicator and approaching a strong graphical horizontal resistance, we are expecting to see a bearish move from 1st resistance at 1.28009 in line with the horizontal swing high resistance to 1st support at 1.26246 in line with the 23.6% Fibonacci retracement and horizontal swing low resistance. Alternatively, price may break 1st resistance structure and head for 2nd resistance at 1.29530 in line with the horizontal swing high resistance
On the H4, with price moving above the ichimoku indicator, we have a bullish bias that price will rise from 1st support at 1.27727 in line with the graphical overlap support and 78.6% Fibonacci retracement to 1st resistance at 1.28919 in line with the graphical swing high resistance and 100% Fibonacci projection. Alternatively, we may see price break 1st support structure and head for 2nd support at 1.26479 in line with the horizontal swing low support.
Areas of consideration:
- H4 time frame, support at 27727
- H4 time frame, resistance at 1.28919
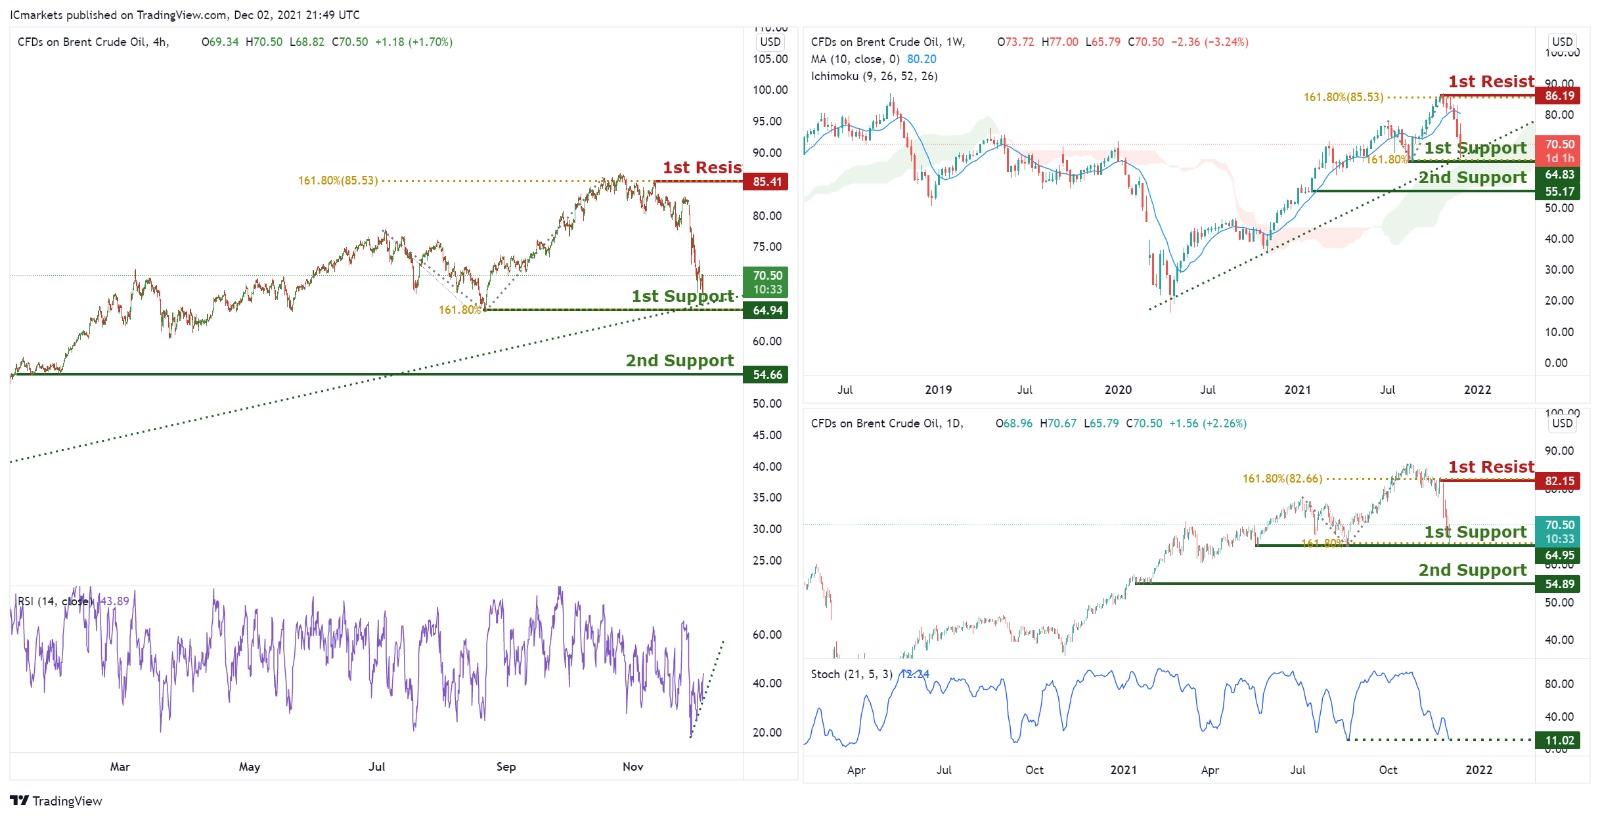
OIL:
On Weekly timeframe, with price approaching the ascending trendline and the horizontal swing low support at 64.83 in line with the 161.8% Fibonacci extension at 1st support, we expect to see a rise from 1st support to 1st resistance at 86.19 in line with the horizontal swing high resistance and the 161.8% Fibonacci extension. Alternatively, price may break 1st support and head for 2nd support at 55.17.
On the Daily, with price approaching the support on the stochastics indicator and the horizontal swing low support at 64.95 in line with the 161.8% Fibonacci extension at 1st support, we expect to see a rise from 1st support to 1st resistance at 82.15 in line with the horizontal swing high resistance and the 161.8% Fibonacci extension. Alternatively, price may break 1st support and head for 2nd support at 54.89 where the horizontal swing low resistance is.
On the H4 timeframe, with price approaching the support on the stochastics indicator and the horizontal graphical level and the ascending trendline, we have a bias that price will rise from 1st support at 70.40 in line with the 161.8% Fibonacci projection and horizontal swing low support to 1st resistance at 85.41 in line with the horizontal swing high resistance. Alternatively, price may break 1st support structure and head for 2nd support at 54.66 in line with the horizontal swing low support.
Areas of consideration:
- H4 time frame, 1st resistance of 72.85
- H4 time frame, 1st support of 07
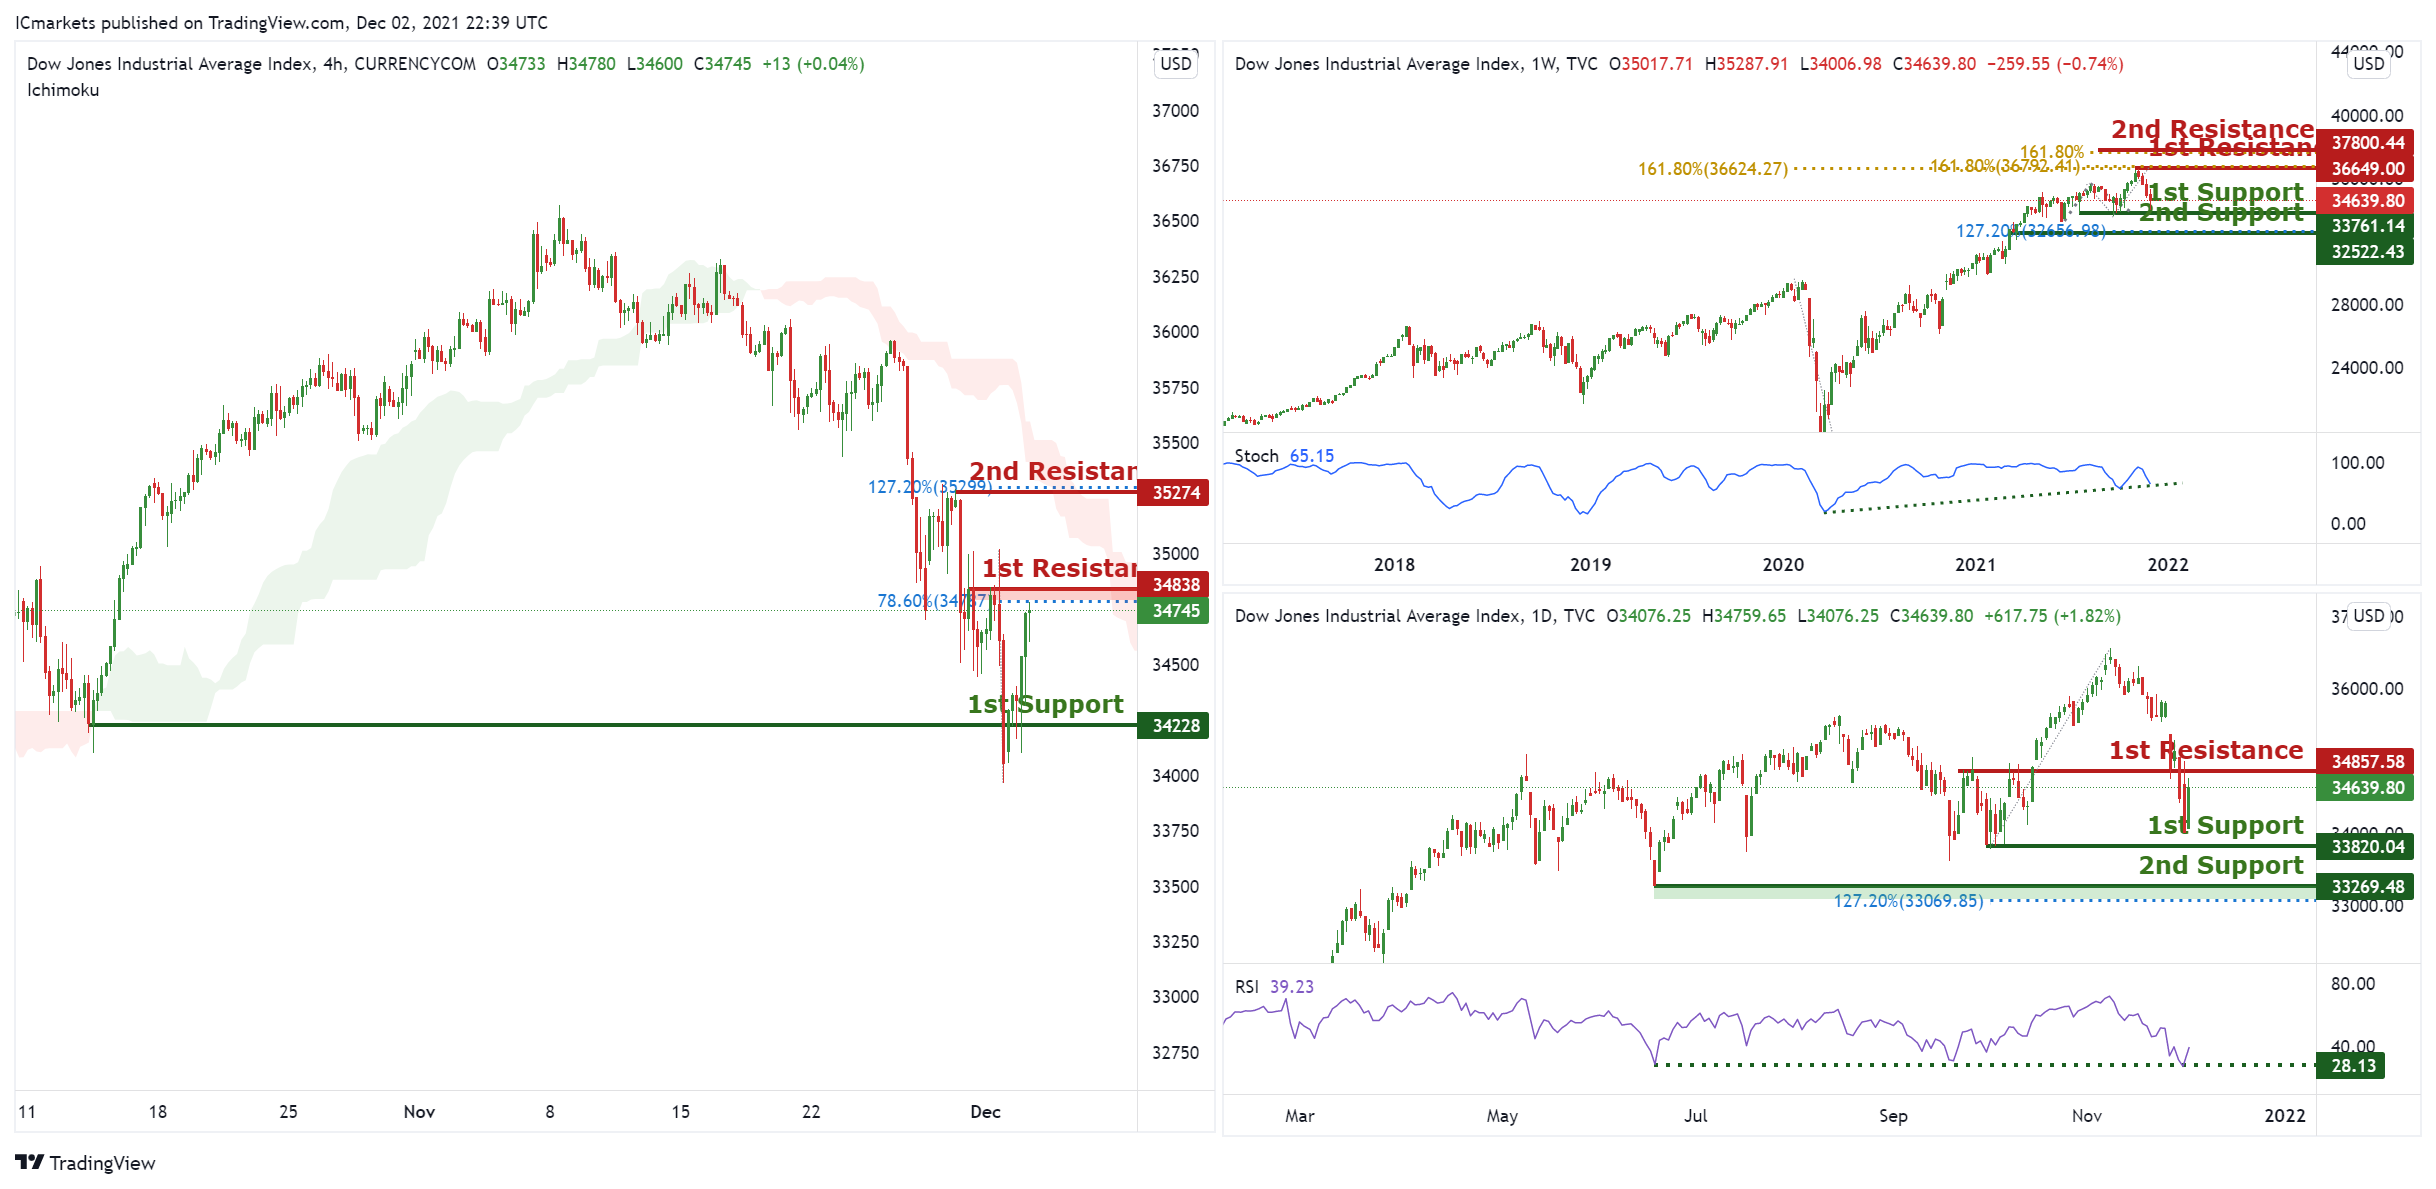
Dow Jones Industrial Average:
On Weekly timeframe, with price approaching the ascending trendline on the stochastics indicator and the horizontal swing low support at 33761 in line with the swing low support at 1st support, we expect to see a rise from 1st support to 1st resistance at 36649 in line with the horizontal swing high resistance and 161.8% Fibonacci extension and possibly to 2nd resistance at 37800 in line with the 161.8% Fibonacci extension . Alternatively, price may break 1st support and head for 32522 where the 2nd support and 127.2% Fibonacci extension is.
On the Daily, with price rejecting the support on the stochastics indicator and the horizontal swing low support at 33820 in line with the Horizontal swing low support at 1st support, we expect to see a rise from 1st support to 1st resistance at 34857 in line with the horizontal swing high resistance. Alternatively, price may break 1st support and head for 2nd support at 33269 where the horizontal swing low resistance and 127.2% Fibonacci extension is.
On the H4, with price moving below the ichimoku cloud and approaching a horizontal resistance, we are bias that price will have bearish move and drop to 1st support at 34228 in line with the horizontal swing low support from 1st resistance at 34838 in line with the 78.6% Fibonacci extension. Alternatively, price may break 1st resistance structure and head for 2nd resistance at 35274 in line with the 127.2% Fibonacci extension.
- 4H resistance at 34838
- 4H support at 34228
The accuracy, completeness and timeliness of the information contained on this site cannot be guaranteed. IC Markets does not warranty, guarantee or make any representations, or assume any liability regarding financial results based on the use of the information in the site.
News, views, opinions, recommendations and other information obtained from sources outside of www.icmarkets.com.au, used in this site are believed to be reliable, but we cannot guarantee their accuracy or completeness. All such information is subject to change at any time without notice. IC Markets assumes no responsibility for the content of any linked site.
The fact that such links may exist does not indicate approval or endorsement of any material contained on any linked site. IC Markets is not liable for any harm caused by the transmission, through accessing the services or information on this site, of a computer virus, or other computer code or programming device that might be used to access, delete, damage, disable, disrupt or otherwise impede in any manner, the operation of the site or of any user’s software, hardware, data or property.


