
EUR/USD:
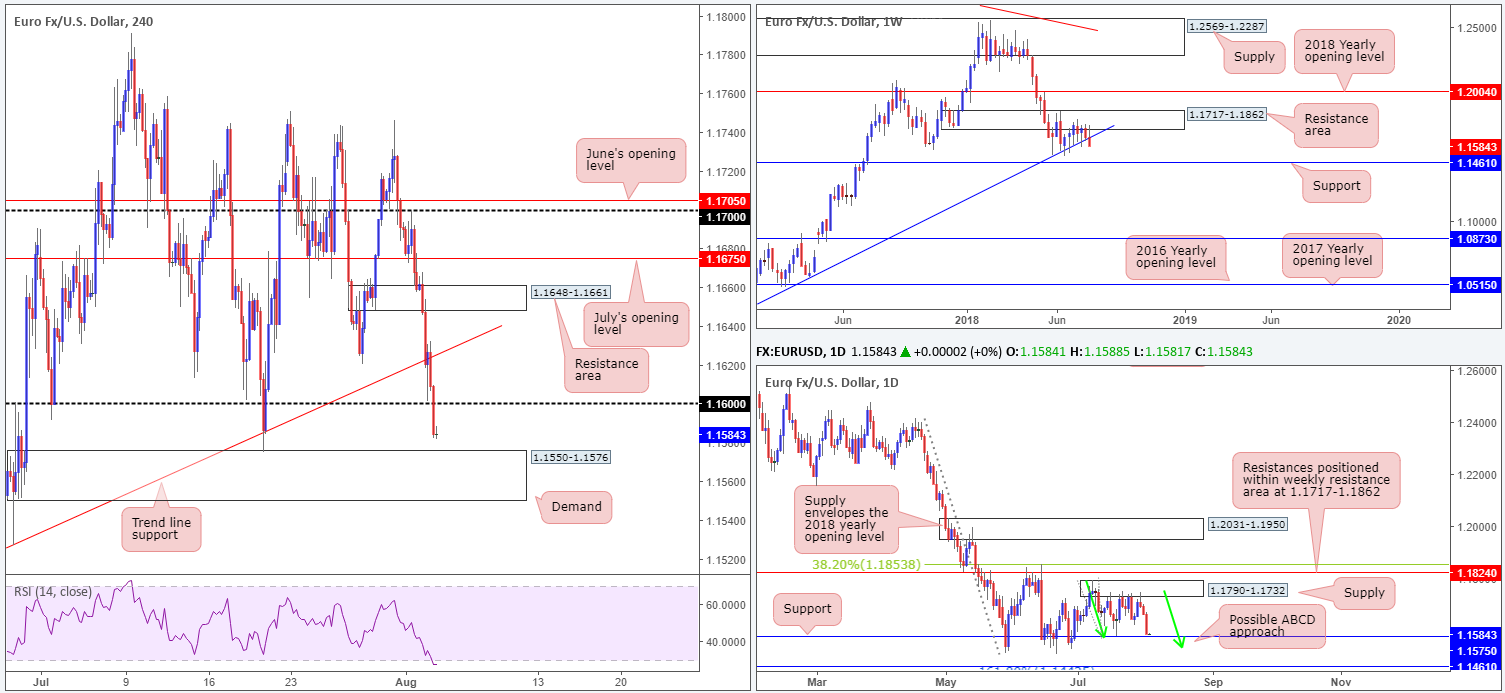
The single currency lost considerable ground against its US counterpart on Thursday, consequently breaching a H4 trend line support (etched from the low 1.1508) and the psychological number 1.16. Bolstered by a stronger USD across the board (the DXY recently reclaimed 95.00 status), H4 action is now seen hovering just north of a demand base coming in at 1.1550-1.1576. Note the strong upside momentum produced from this area and the H4 RSI currently testing oversold territory.
Higher-timeframe technicals witnessed a firm break of a weekly trend line support (taken from the low 1.0340) during yesterday’s move. A close beyond this line could set the stage for an approach towards weekly support notched in at 1.1461. Before we reach this barrier, however, sellers will need to contend with possible buying pressure from nearby daily support observed at 1.1575. Also worth noting on this scale is the possible ABCD approach, marked with green arrows. Should the market trail this formation, a break of the daily support is on the cards, with the potential to even stretch as far south as 1.1442: a 161.8% Fib ext. point (seen just beyond the weekly support mentioned above at 1.1461).
Areas of consideration:
Longer term, trading this market is a challenge right now. Weekly forces portend lower prices, while daily action shows possible support. Weekly support at 1.1461 stands out as a key level right now, owing to its convergence with the daily ABCD 161.8% Fib ext. point.
Intraday, on the other hand, traders likely have their crosshairs fixed on the underside of 1.16 for a possible retest play, targeting the top edge of H4 demand at 1.1550-1.1576. In addition to this, the H4 demand is likely a buy zone for the majority of lower-timeframe players, seeing as how daily support is seen positioned a few pips above this barrier.
Also bear in mind, the BLS will release July’s Employment Situation Report later on today. Headline payrolls is expected to slow modestly to 190k after printing north of 200k in the past two months. Markets are likely to focus on average hourly earnings as Fed seeks wage growth.
Today’s data points: US job’s data; US ISM non-manufacturing PMI.
GBP/USD:
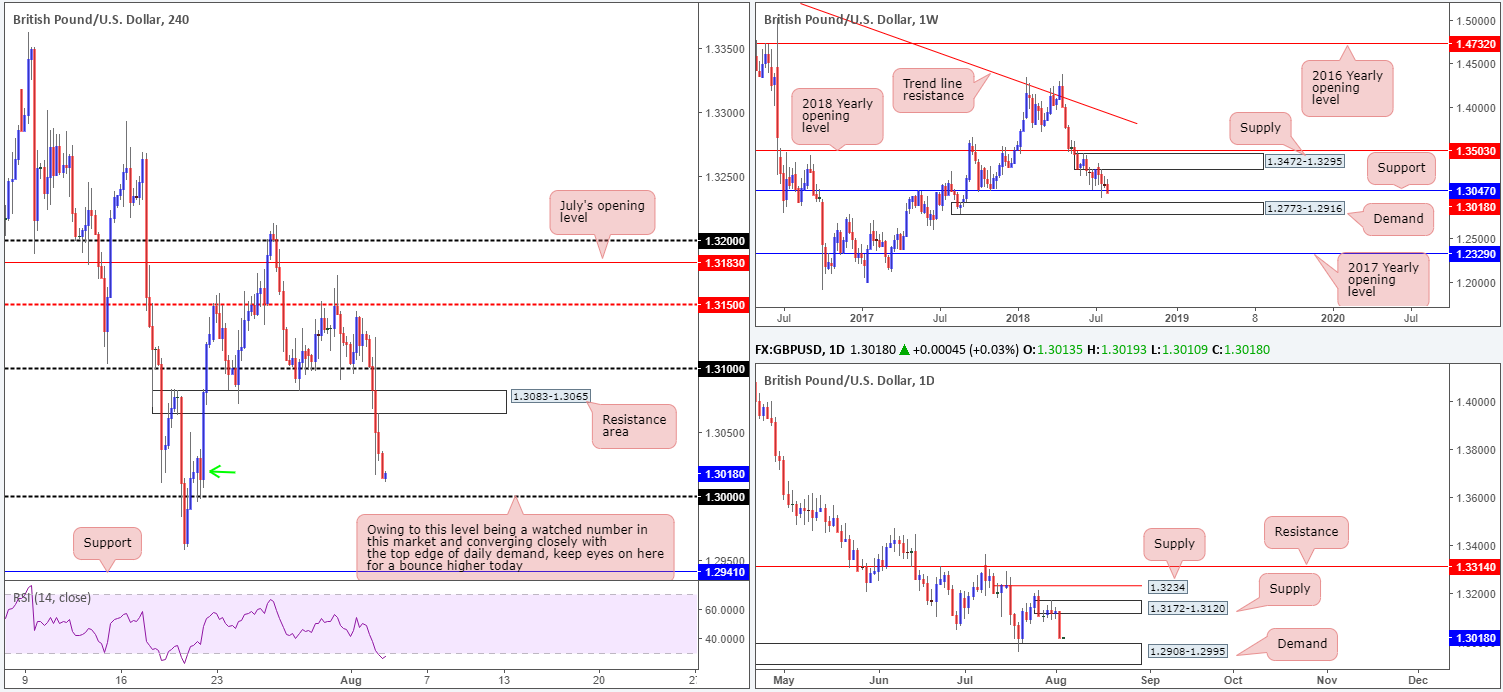
Although the Bank of England lifted interest rates by 25bps on Thursday, the pound plunged lower. Initially, sterling rose on the decision and the unanimous vote to hike rates, though during the press conference with Governor Carney, sellers emerged. Engulfing a H4 support area at 1.3083-1.3065 (now resistance zone), H4 price is now seen hovering within a H4 demand zone seen marked with a green arrow at 1.2994-1.3029, though attention is likely on the key figure 1.30.
Weekly price action probed beneath support at 1.3047 on recent selling, opening up the possibility of an approach towards nearby demand at 1.2773-1.2916. Before we reach here, however, daily demand at 1.2908-1.2995, an area actually seen glued to the top edge of the aforementioned weekly demand zone, could potentially impact this market. Note the top edge of the area (1.2995) converges nicely with the key figure 1.30 on the H4 timeframe.
Areas of consideration:
On account of 1.30 showing confluence with daily demand, this number is an area of interest today. A H4 full or near-full-bodied bull candle printed from here would, in our technical opinion, be enough evidence to validate buyer intent. With stops tucked beneath the candle’s rejection tail, targeting 1.3065 as the initial port of call (underside of a H4 resistance zone), is certainly an option.
Today’s data points: UK services PMI; US job’s data; US ISM non-manufacturing PMI.
AUD/USD:
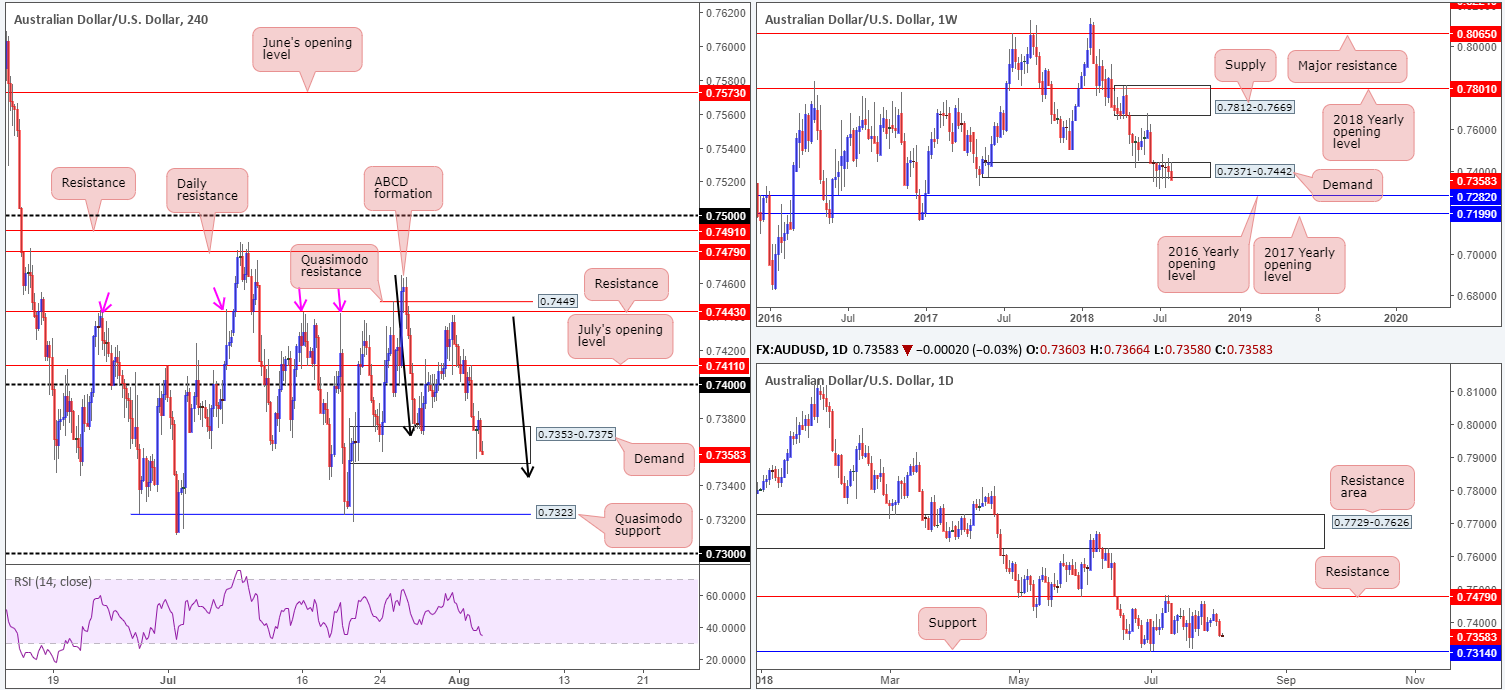
Australian trade balance figures released on Thursday showed declines in both imports and exports, triggering a selloff from the underside of July’s opening level at 0.7411 on the H4 timeframe (see M30 for a clearer view). The pair continued to explore lower levels following this on the back of a robust USD, ending the day with the H4 candles settling within the walls of a demand area at 0.7353-0.7375. On this scale, we have an ABCD completion point (black arrows) seen just beyond the demand at 0.7344, followed closely by Quasimodo support at 0.7323.
Higher up on the curve, weekly demand at 0.7371-0.7442 remains in a fragile state, opening the window to a possible test of the 2016 yearly opening level at 0.7282 sometime down the road. In the event the bulls regain consciousness, however, a retest of supply at 0.7812-0.7669 may eventually be on the cards. The reason behind the lack of movement on the weekly timeframe, technically that is, likely has something to do with the fact daily flow continues to respect its current range. Since early July, the commodity currency has fluctuated between support drawn from 0.7314 and resistance chalked up at 0.7479.
Areas of consideration:
This is a tricky market to trade at the moment, with limited space for the H4 candles to maneuver in either direction. Topside resistance falls in at the 0.74 handle, whereas below we have a number of supports to contend with as highlighted above.
Once, or indeed if, the market reaches 0.73 territory, things may start to become interesting since both weekly and daily structure enters the fold. For now, though, intraday action appears too restricted to make informed decisions.
Today’s data points: Australian retail sales m/m; US job’s data; US ISM non-manufacturing PMI.
USD/JPY:
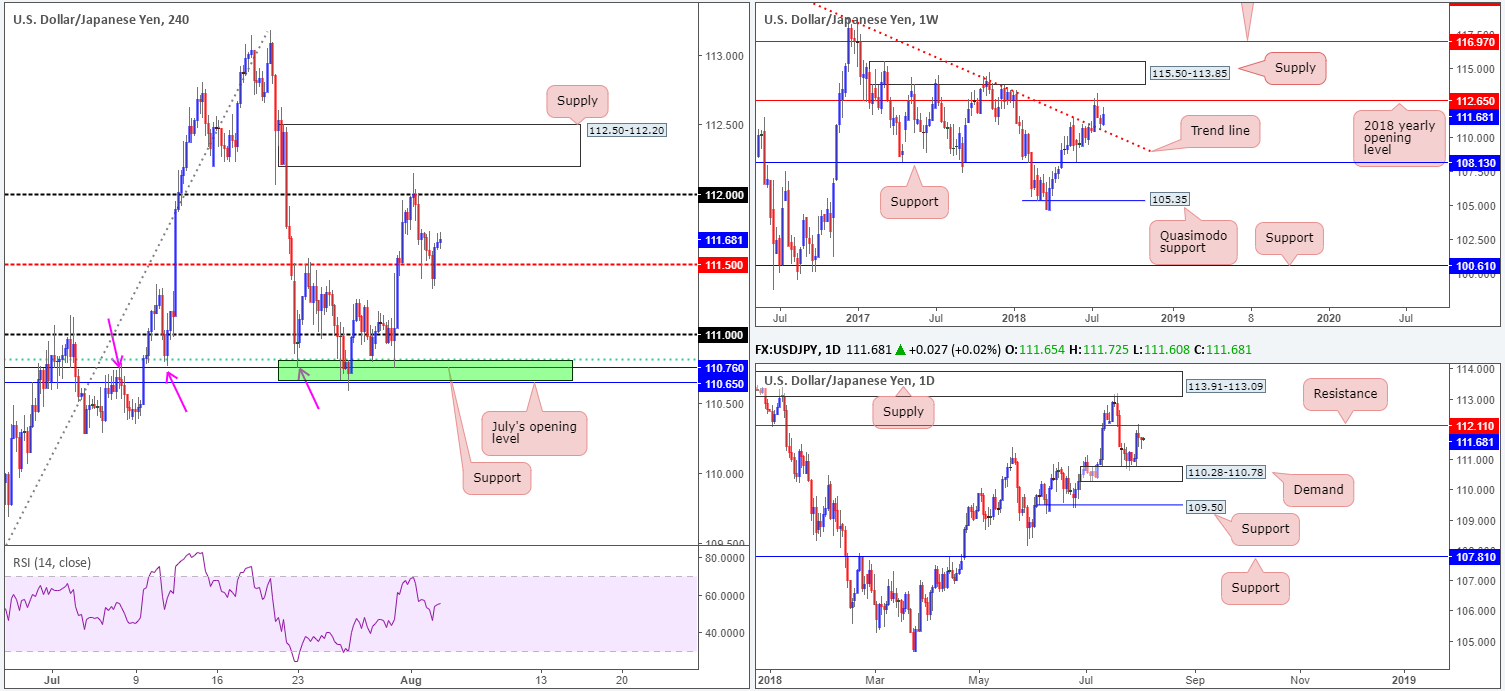
Intraday action was somewhat restricted on Thursday, finding minor support ten or so pips beneath the H4 mid-level support at 111.50. Overhead on the H4 timeframe, 112 remains a point of interest as possible resistance, as does the supply zone seen at 112.50-112.20 – just look at that momentum pushing lower from the supply!
According to weekly structure, the next upside target in this market falls in at the 2018 yearly opening level drawn from 112.65, after firmly rejecting trend line resistance-turned support (taken from the high 123.57) two weeks back. Daily movement, on the other hand, points to nearby resistance at 112.11, following a modest round of buying off demand at 110.28-110.78 seen earlier in the week.
Areas of consideration:
In similar fashion to Thursday’s report, neither a long nor short seems attractive, particularly on the higher timeframes. Weekly price proposes a push higher may be on the cards, whereas daily price portends possible selling from resistance.
Intraday, however, there are two areas to keep tabs on we believe:
- Should the market witness a break of 111.50 on the H4 timeframe, the 111 handle will likely be the next base in line for some action, shadowed closely by an interesting area of support marked in green at 110.65/110.81 (comprised of July’s opening level, a support level and a 61.8% Fib support). Also bear in mind the top edge of daily demand mentioned above at 110.78 converges nicely with this zone, therefore a bounce higher from here could be in store.
- The H4 supply zone mentioned above at 112.50-112.20 will likely offer a bounce lower, given daily resistance mentioned above at 112.11 seen sited just below.
Today’s data points: US job’s data; US ISM non-manufacturing PMI.
USD/CAD:
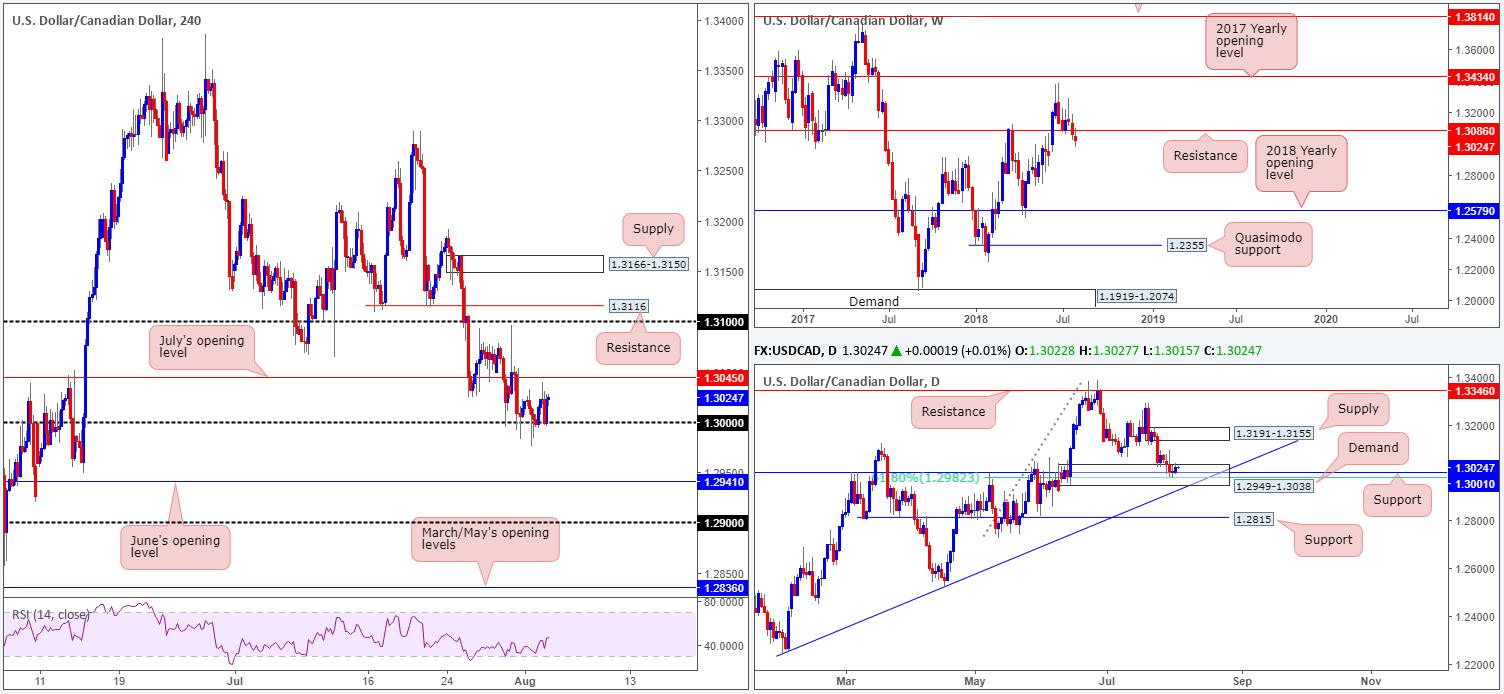
1.30, a key figure in this market, remains firm support, despite a number of attempts to push south over the past couple of days. Strong USD buying was evident across the board on Thursday, with a similar view seen in the oil market as WTI staged a decisive recovery off daily support at 67.14.
Besides 1.30 being a watched number in this market, traders may have also noticed it is positioned within the walls of a rather attractive daily demand area visible at 1.2949-1.3038. Within the current daily demand zone we also see strong support standing at 1.3001 (history dating back to Sept 2016), followed closely by a 61.8% Fib support value at 1.2982. The next upside objective from this area can be seen around daily supply fixed at 1.3191-1.3155.
While considerable support is mounting on H4 and daily timeframes, there’s one drawback: the weekly timeframe. The weekly candles are still seen lurking beneath support coming in at 1.3086 (now acting resistance). In terms of obvious support beneath 1.3086, we do not see a whole lot stopping this market from reaching as far south as 1.2579: the 2018 yearly opening level.
Areas of consideration:
Intraday longs from 1.30 has 1.3045 (H4 July’s opening level) to target as its initial port of call. A move higher from 1.30 is supported by the noted daily supports, though against weekly flow in that one is attempting to buy a market that recently broke weekly support. Technically, this could be the reason behind the lackluster response off 1.30 so far.
As you can see, irrespective of the direction one selects here, opposing structure remains evident. As such, if you’re not willing to accommodate this risk, opting to remain on the sidelines may still be the better option for the time being.
Today’s data points: US job’s data; US ISM non-manufacturing PMI; Canadian trade balance.
USD/CHF:
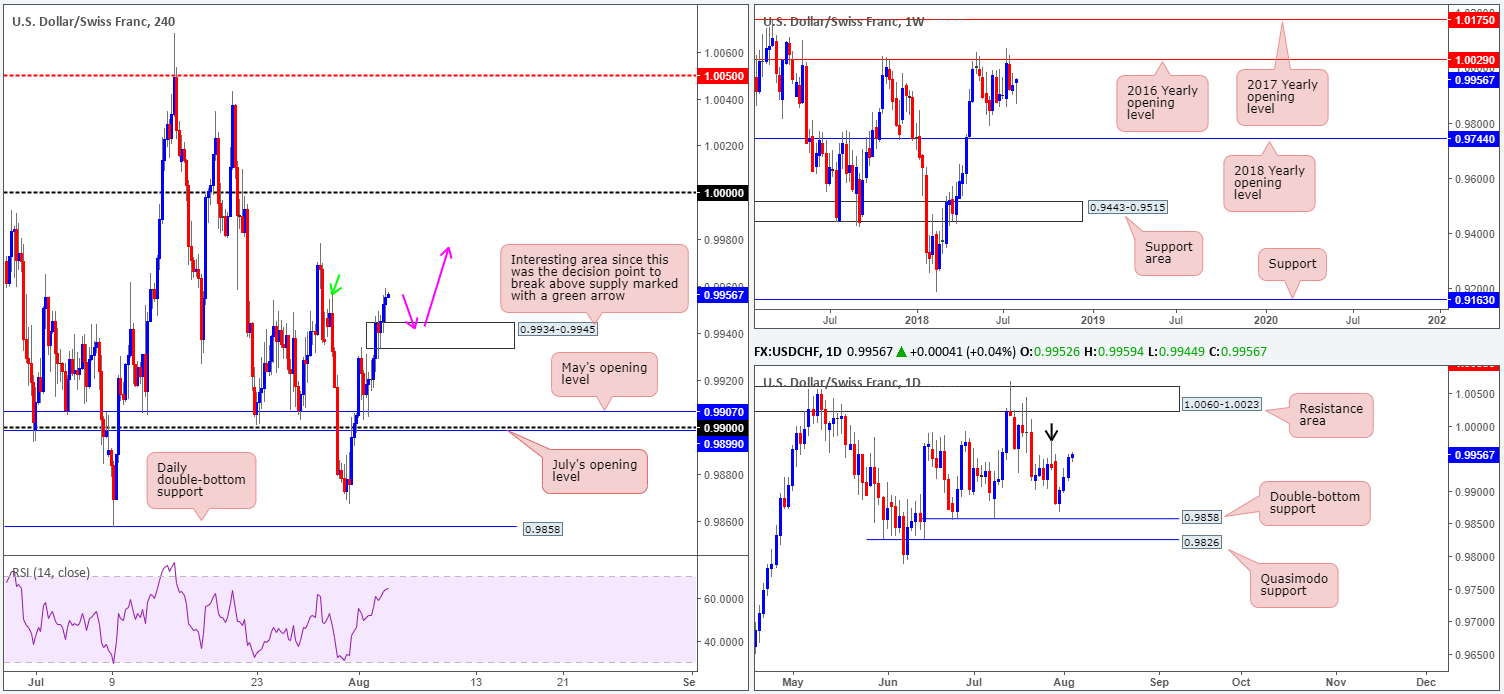
Registering its third consecutive daily gain on Thursday, USD/CHF bulls appear in fine form at the moment! In terms of H4 movement, further upside is likely as the market looks poised to challenge the July 27 highs at 0.9978. Beyond here, parity (1.0000) is seen as the next viable point of resistance. Also worth noting is the ‘decision point’ area seen at 0.9934-0.9945. We like this zone since it was potentially where the market decided to breach supply marked with a green arrow at 0.9956.
Turning the focus over to the bigger picture, weekly price, assuming further upside takes shape, could extend to towards key resistance at 1.0029. Holding price lower on two occasions in 2017, and twice already in 2018, this level commands attention! Meanwhile, daily movement is seen testing an area of possible supply, shaped in the form of a bearish pin-bar candle formation (see black arrow) between 0.9978-0.9931. A break of this base could see a run up to 1.0060-1.0023: a resistance area that encapsulates the 2016 yearly opening level mentioned above on the weekly timeframe at 1.0029.
Areas of consideration:
All the time there’s a possibility of selling from daily supply at 0.9978-0.9931, a long off the H4 ‘decision point’ area at 0.9934-0.9945 remains a challenge. Should H4 price retest this area and print a reasonably sized bullish candle (a method of confirming bullish intent), however, then a long could be an option, targeting July 27 highs at 0.9978 as the first take-profit zone.
Today’s data points: US job’s data; US ISM non-manufacturing PMI.
Dow Jones Industrial Average:
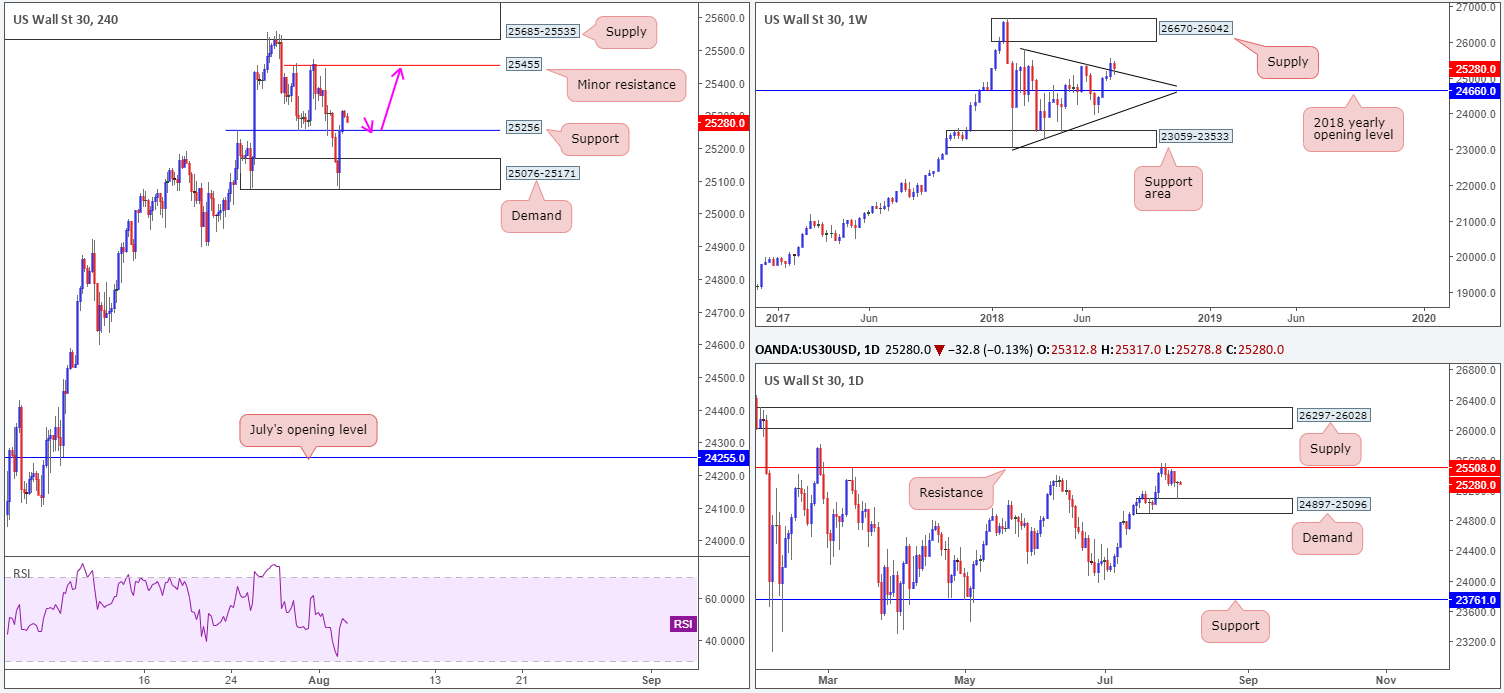
Although US equity indexes began the day on a negative note as escalating trade fears weighed on sentiment, the DJIA turned a corner deep within the limits of a H4 demand base at 25076-25171. Apple’s impressive performance continued on Thursday with a 3% gain, outperforming other major sectors.
The move higher from H4 demand pushed the index into green territory, back above H4 support coming in at 25256. The next upside target on this scale can be seen at 25455: a minor H4 resistance level that’s shadowed closely by H4 supply at 25685-25535.
Over on the higher timeframes, the market witnessed a retest of the recently broken weekly trend line resistance-turned support (etched from the high 25807). From this point, we could be looking at a run up to weekly supply coming in at 26670-26042. Supporting this weekly trend line support is a daily demand zone drawn from 24897-25096. Note the beautiful bullish daily pin-bar candle formation printed off of this zone yesterday!
Areas of consideration:
A retest play off H4 support at 25256 is likely of interest to intraday players today, targeting minor H4 resistance at 25455 as the initial take-profit level. Note buyers may find it problematic to trade beyond here, given daily resistance seen at 25508: the next upside target on the daily scale.
Today’s data points: US job’s data; US ISM non-manufacturing PMI.
XAU/USD (Gold):
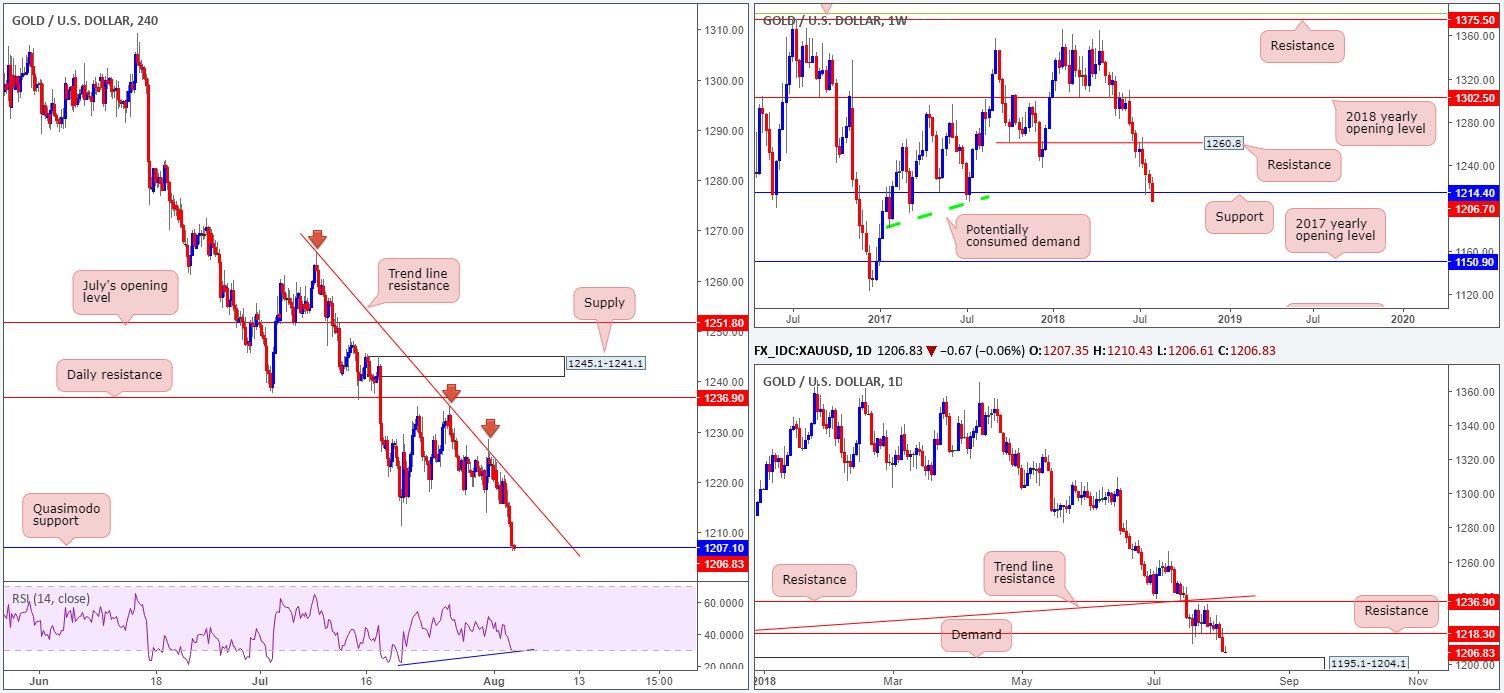
Across the board, the USD advanced higher with the DXY firmly reclaiming 95.00 status. Demand for the US dollar placed bullion under pressure on Thursday, pulling the H4 candles towards Quasimodo support sited at 1207.1. Although this level is bolstered by H4 RSI divergence (blue line) out of oversold territory, buying pressure from this base is likely weak. Our rationale behind this approach stems from the bigger picture.
Weekly price edged beneath support at 1214.4 in recent trade. On the grounds sellers remain defensive beneath this number, little support is seen until we reach 1150.9: the 2017 yearly opening level. Why we believe the path could be free this far south comes from seeing little active demand to the left of current price. Daily movement, on the other hand, is seen poised to attack demand coming in at 1195.1-1204.1, which could hinder downside today/next week.
Areas of consideration:
Entering long off the current H4 Quasimodo support has far too many opposing themes against it, in our view. The risk is just too great. Should a bounce from this level come to fruition, though, shorts off nearby H4 trend line resistance (taken from the high 1265.9) could be an option, with an overall target set around the top edge of daily demand at 1204.1.
Longs from the daily demand mentioned above at 1195.1-1204.1, nonetheless, are also something to consider. A bounce from this region may force the yellow metal to retest the recently broken weekly support as resistance at 1214.4 – an ideal take-profit level!
The use of the site is agreement that the site is for informational and educational purposes only and does not constitute advice in any form in the furtherance of any trade or trading decisions.
The accuracy, completeness and timeliness of the information contained on this site cannot be guaranteed. IC Markets does not warranty, guarantee or make any representations, or assume any liability with regard to financial results based on the use of the information in the site.
News, views, opinions, recommendations and other information obtained from sources outside of www.icmarkets.com.au, used in this site are believed to be reliable, but we cannot guarantee their accuracy or completeness. All such information is subject to change at any time without notice. IC Markets assumes no responsibility for the content of any linked site. The fact that such links may exist does not indicate approval or endorsement of any material contained on any linked site.
IC Markets is not liable for any harm caused by the transmission, through accessing the services or information on this site, of a computer virus, or other computer code or programming device that might be used to access, delete, damage, disable, disrupt or otherwise impede in any manner, the operation of the site or of any user’s software, hardware, data or property.


