
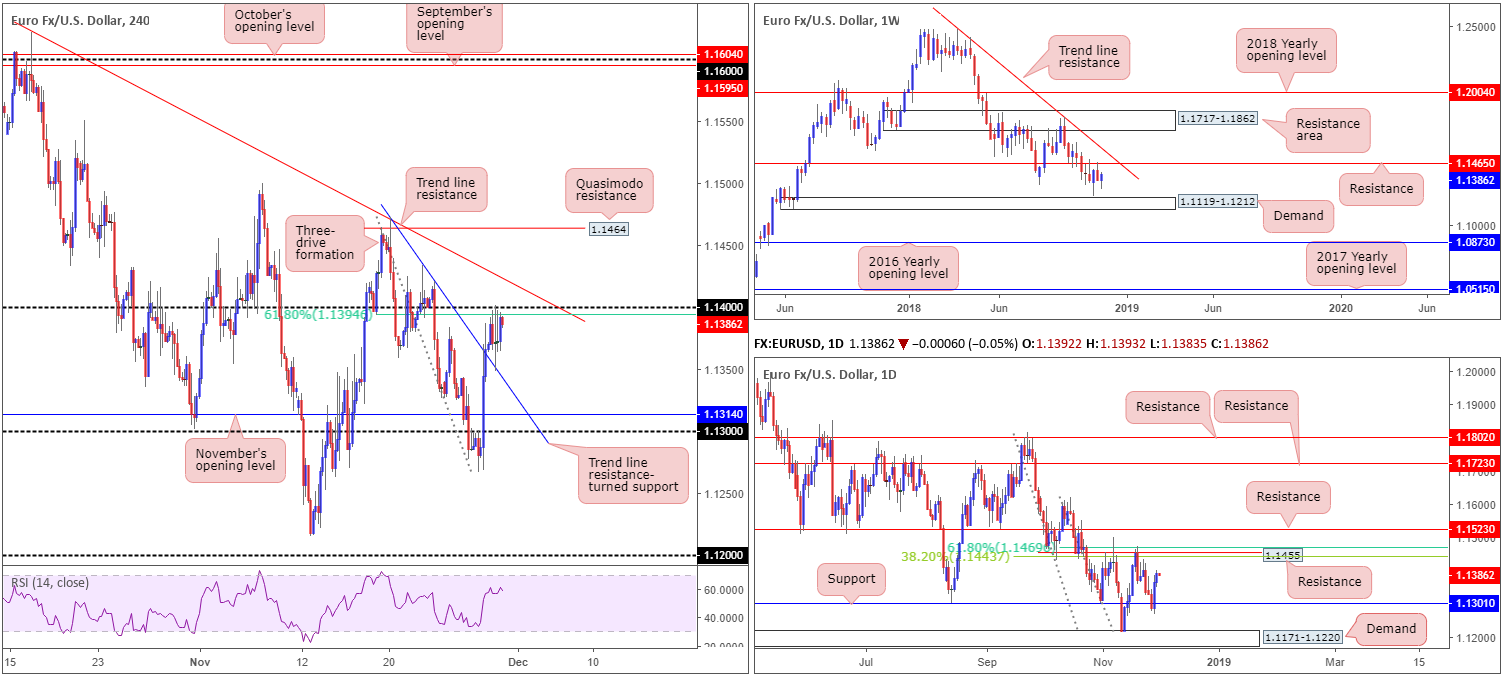
EUR/USD:
Despite a reasonably busy calendar Thursday, the EUR/USD concluded its session reporting limited movement, up 0.23% on the day. Most notable was the FOMC meeting minutes, with the majority of participants stating rate hikes were likely warranted ‘fairly soon’ if the US job and inflation data were in line with or stronger than the Fed’s current expectations, though a few expressed uncertainty around the timing of rate hikes.
From a technical perspective, the H4 candles are currently battling for position between the 1.14 handle/61.8% Fibonacci value at 1.1394 and a trend line resistance-turned support (extended from the high 1.1472). Beyond 1.14, nearby trend line resistance (taken from the high 1.1621) is in view, followed by a Quasimodo resistance plotted at 1.1464. To the downside, aside from the noted trend line resistance-turned support, November’s opening level at 1.1314/the 1.13 handle is present.
Evaluating the higher-timeframe picture reveals daily price extended gains Thursday on the back of Wednesday’s bullish engulfing pattern off support priced in at 1.1301. Further upside from this point may lead to a retest of daily resistance at 1.1455 that merges closely with two Fibonacci resistances: a 61.8% and a 38.2% at 1.1469 and 1.1443, respectively. The other key thing to note here is weekly resistance is also plotted at 1.1465.
Areas of consideration:
1.14 and the H4 trend line resistance mentioned above (1.1621) are both, according to our higher-timeframe technical studies, in a vulnerable position for shorts.
Ultimately, the research team remain drawn towards the H4 Quasimodo resistance level at 1.1464 as a higher-probability selling zone, largely due to its close connection with the aforementioned higher-timeframe resistances. As highlighted in Thursday’s briefing, this level may not come into play today, though may be of use early next week.
Aggressive entry may involve selling 1.1464 with a tight stop-loss order plotted above the H4 Quasimodo apex head (1.1472), whereas conservative traders might opt to wait for additional candlestick confirmation to form prior to pulling the trigger (entry/stop parameters can be defined according to this configuration).
Today’s data points: EUR CPI Flash Estimate y/y; EUR Core CPI Flash Estimate y/y; FOMC Member Williams Speaks; Chicago PMI.
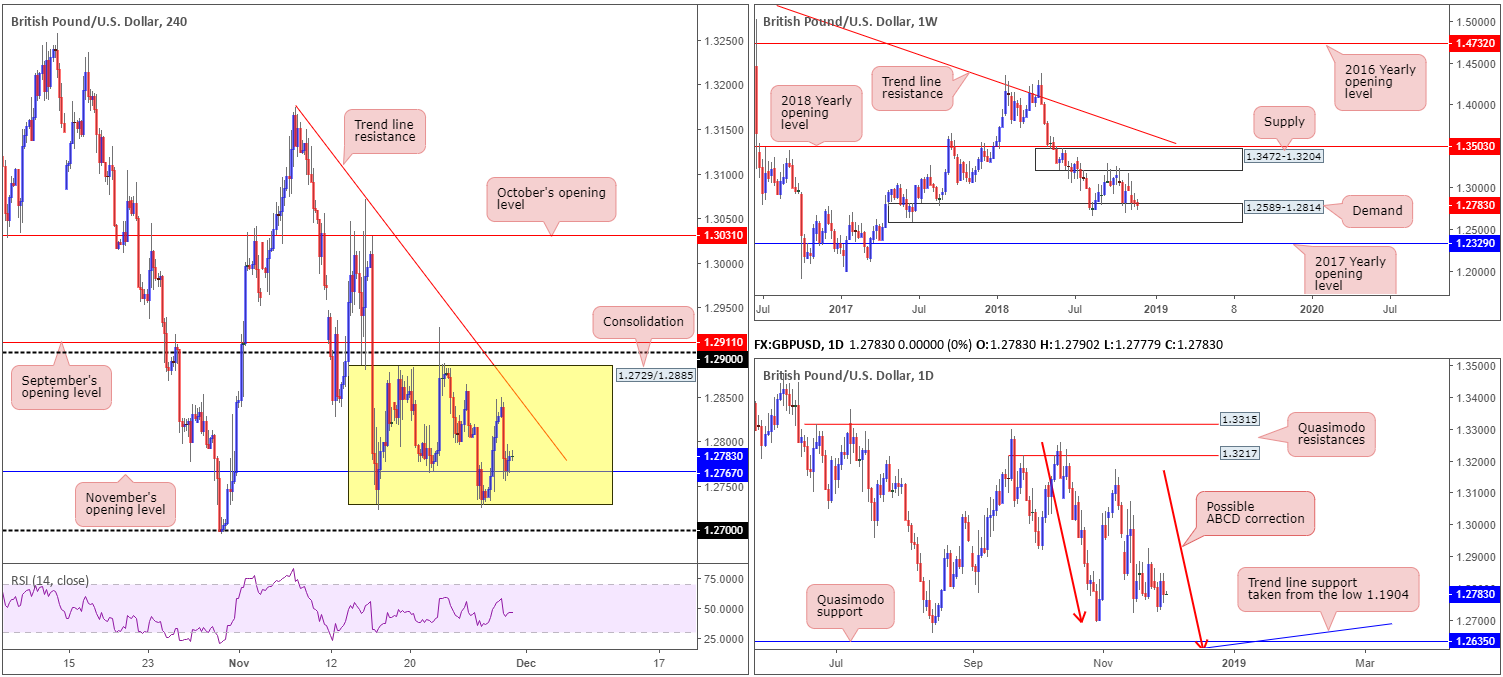
GBP/USD:
The British pound ended Thursday’s segment on the back foot amid ongoing Brexit uncertainty ahead of December’s UK Parliament vote. Cable fell sharply during early London and, as can be seen from the H4 timeframe, spent the remainder of the day nursing losses off November’s opening level at 1.2767. Continued buying from this point has trend line resistance (extended from the high 1.3174) in view. On the whole, though, H4 action remains confined to a consolidation between 1.2729/1.2885 (yellow).
The higher-timeframe technical position remains unchanged, according to our view. For that reason, we’ve brought forward a piece of the previous briefing as a reminder:
Weekly price is seen engaging with demand at 1.2589-1.2814, though as of yet has failed to produce anything meaningful to the upside. Price action on the daily timeframe, however, suggests the pair might want to explore lower ground within the walls of the said weekly demand area. The candles, as you can see, are hovering north of the 1.2695 Oct 30 low. While a response from this neighbourhood is possible, the Quasimodo support seen at 1.2635 remains a far more appealing level. Aside from 1.2635 fusing with trend line support (taken from the low 1.1904), the approach, should we push for lower levels, will form by way of an ABCD bullish pattern (red arrows) terminating just south at 1.2614.
Areas of consideration:
Medium term (H4), we may observe additional buying off November’s opening level mentioned above at 1.2767 today, targeting the nearby H4 trend line resistance. As of yet, though, the team has been unable to identify a notable H4 bullish candlestick structure off of this level (entry/stop parameters can be defined according to this configuration).
Should we reach the noted H4 trend line resistance today, a sell from here is also something worth considering. Although we say this coming from a medium-term perspective, which means we may only witness a mild bounce lower, do bear in mind both weekly and daily price are struggling to chalk up much in terms of bullish intent at the moment, so further-than-expected selling could be in store. To avoid the possibility of being whipsawed out of a position on a fakeout through the trend line, waiting for additional candlestick confirmation is recommended before pulling the trigger.
Longer term, nonetheless, focus remains drawn towards the daily Quasimodo support at 1.2635 for potential longs. The fact this level is positioned within the current weekly demand, and fuses with an ABCD correction point as well as a trend line support, marks a reasonably strong buy zone for future use.
Today’s data points: FOMC Member Williams Speaks; Chicago PMI.
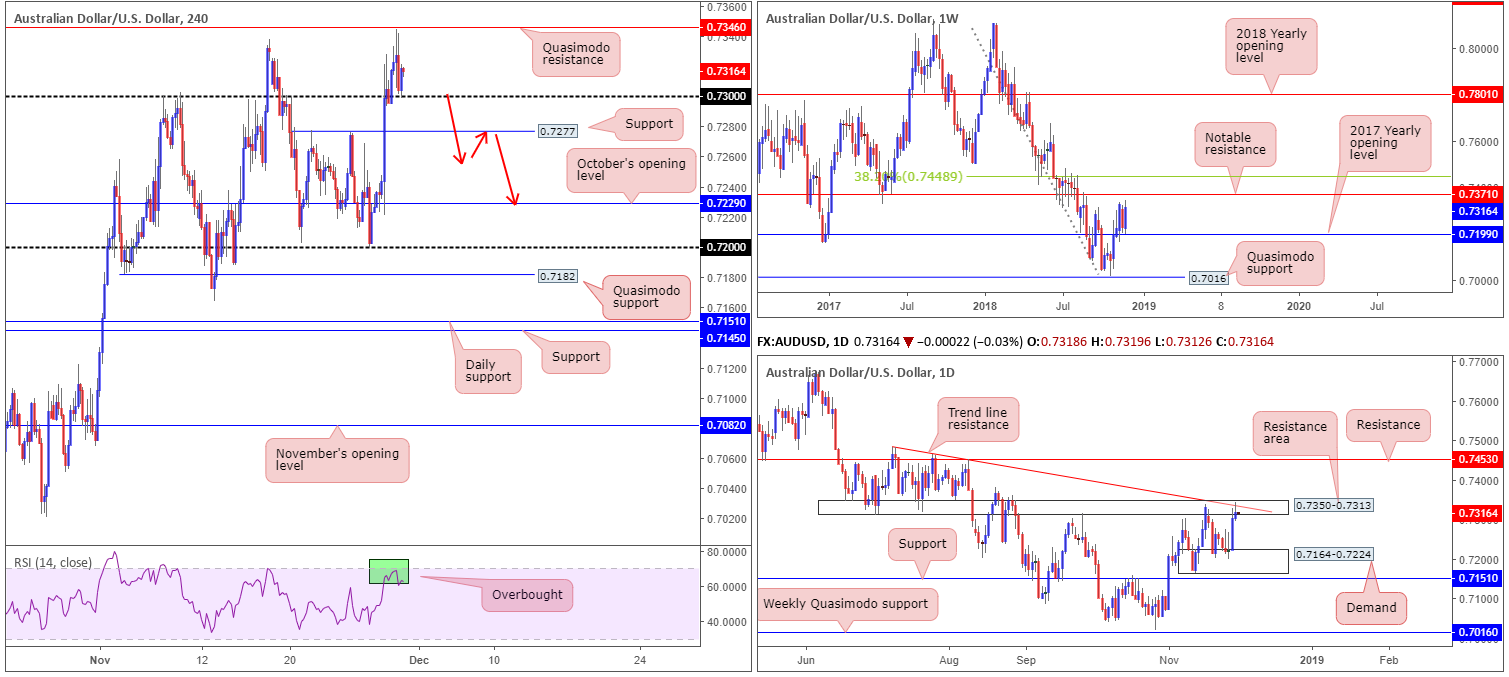
AUD/USD:
Rebelling against lower-than-expected Aussie Private Capex, the commodity currency explored higher ground Thursday, up 0.19%. Although continuing to find support after a mid-week USD crunch directed the greenback into a slide across the charts, further buying may still be a challenge.
Kicking off with the weekly timeframe, which is actually in favour of further upside. Recent play saw the current weekly candle test its 2017 yearly opening level at 0.7199, and displays room to continue pressing higher until reaching notable resistance priced in at 0.7371.
Things start to become concerning for the bulls, however, once daily structure is taken into consideration. Recent buying brought the market into a resistance area at 0.7350-0.7313, which happens to also converge with a nearby trend line resistance (drawn from the high 0.7483). The research team feels this area, although weekly price shows scope to possibly extend higher, is likely to hinder buying.
Areas of consideration:
On account of the above, our outlook remains unchanged:
Should the H4 candles close under 0.73 today, this, according to our technical studies, is a strong sign daily sellers are wanting to take things lower from here. H4 support rests nearby at 0.7277, though with overhead selling pressure from the daily timeframe, we expect this level to be taken out and price head in the direction of October’s opening level at 0.7229 (at this point the market would also be sited just north of daily demand at 0.7164-0.7224 – the next downside target on the daily scale). To be on the safe side, traders could wait for the H4 candles to consume 0.7277 and attempt to enter short on any retest of the level as resistance (red arrows – preferably in the shape of a bearish candlestick formation as this will provide entry/stop parameters).
Today’s data points: FOMC Member Williams Speaks; Chicago PMI.
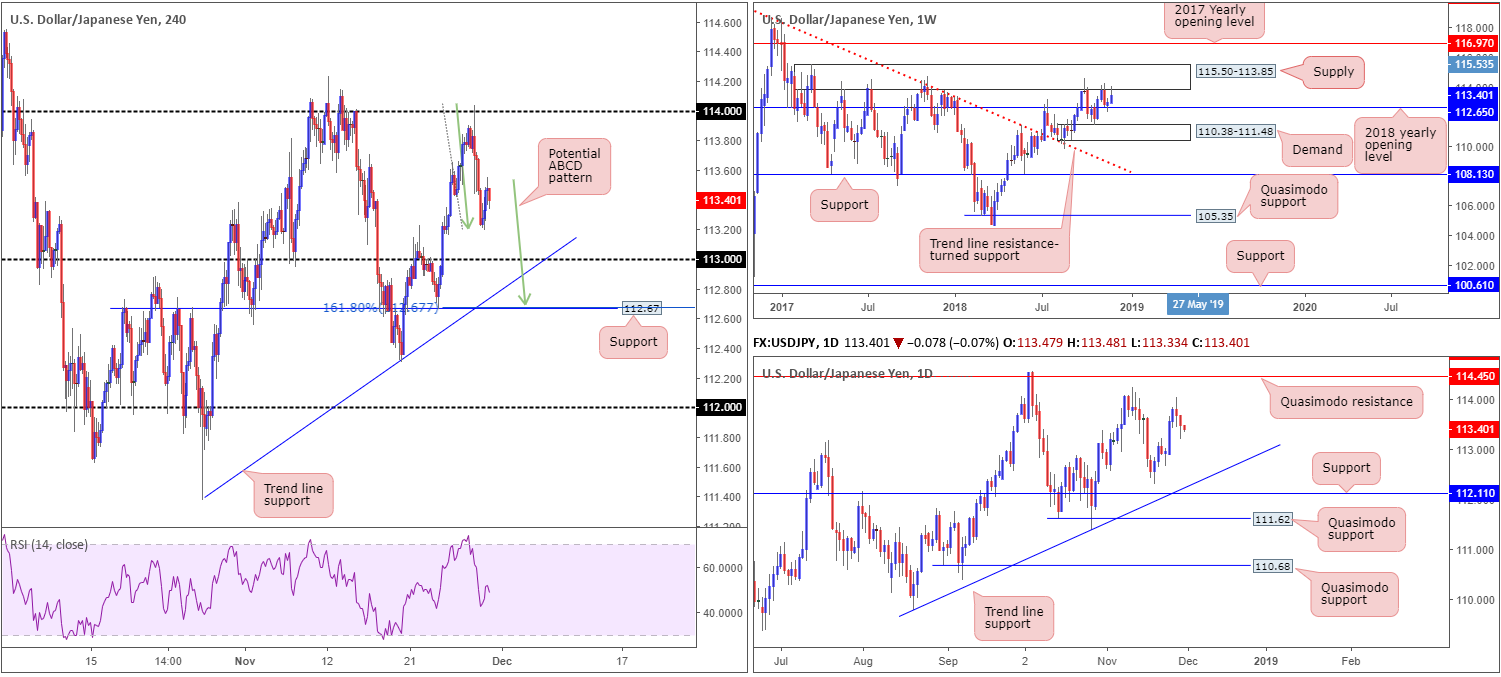
USD/JPY:
The US dollar give up further ground to the Japanese yen Thursday, largely amid Asia’s hours, down for a second consecutive day at 0.17%. Despite this, the market began bottoming around 113.21ish into European trade and mildly erased a portion of the day’s losses into the close.
Thanks to recent movement, the research team has noted a potential H4 ABCD (green arrows) bullish pattern that completes just north of H4 support at 112.67. It may also be worth noting this level merges with a 161.8% H4 Fibonacci ext. point. Should this pattern complete this would trip stops below 113, and quite possibly beneath the H4 trend line support (taken from the low 111.37) as well.
The team has pinned the H4 support mentioned above at 112.67 as a high-probability buy zone, not only because of its H4 confluence, but also due to the level representing weekly support in the shape of a 2018 yearly opening level at 112.65. In the event our analysis is incorrect, however, and price turns higher from its current spot, the 114 handle is in view on the H4 timeframe. Note this level is housed within the lower limits of major weekly supply at 115.50-113.85, therefore this level could also be considered a high-probability reaction zone, too.
Areas of consideration:
On account of the above reading, the H4 support at 112.67 is open for potential longs and the 114 handle is in position for possible short trades.
Whether one believes either level requires additional confirmation is ultimately down to the individual trader. As for take-profit targets, unfortunately it’s difficult to judge given the market has yet to complete its approach.
Today’s data points: FOMC Member Williams Speaks; Chicago PMI.
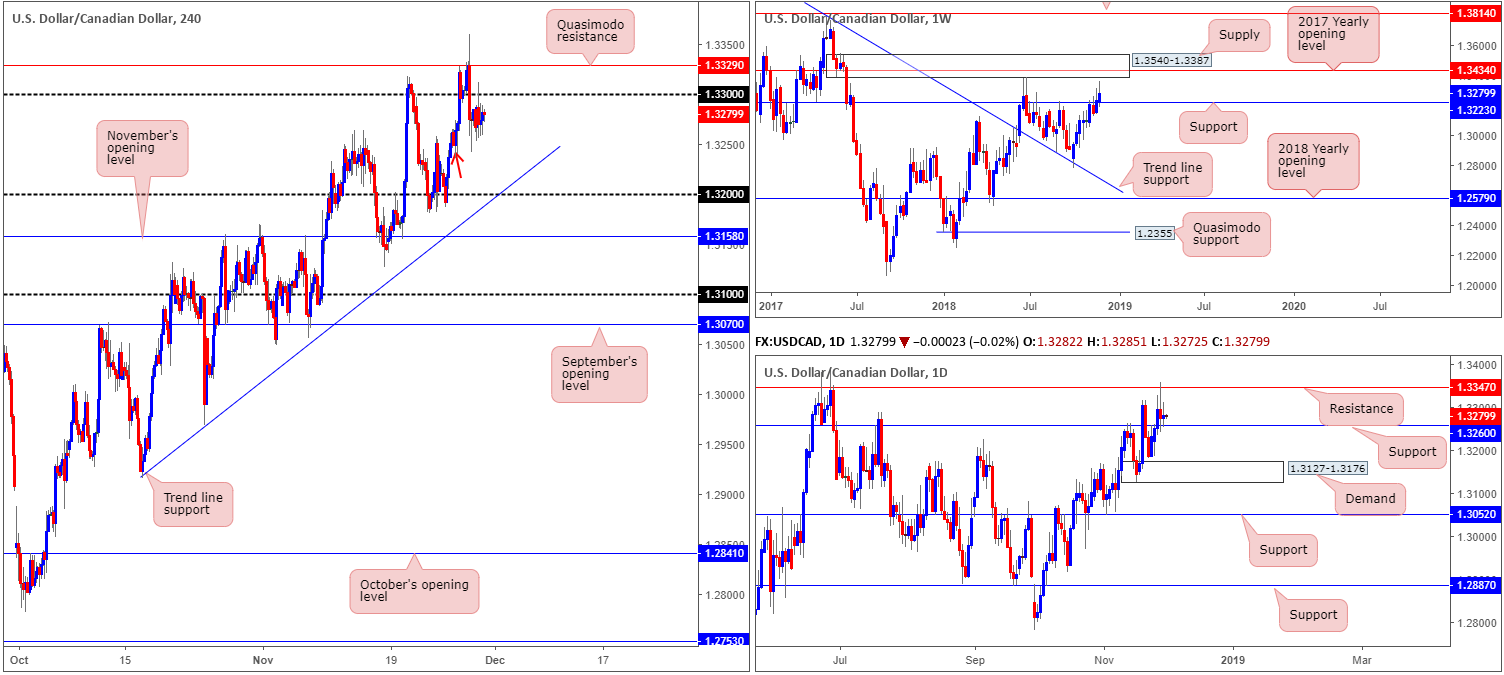
USD/CAD:
Following a Powell-led USD selloff Wednesday, Thursday’s sessions were relatively subdued as price settled/consolidated sub 1.33 on the H4 timeframe. Minor demand marked with a red arrow at 1.3235-1.3264 is currently holding ground, though was unable to provide enough impetus to close beyond 1.33. Beneath the aforementioned demand base, traders’ crosshairs likely remain fixed on 1.32, which happens to merge with a trend line support (extended from the low 1.2932).
As underlined in Thursday’s briefing, though, throwing higher-timeframe structure into the mix changes things. Daily support is visible at 1.3260, which fuses with the top edge of H4 demand mentioned above at 1.3235-1.3264. Adding to this, we can also see weekly support is present at 1.3223, positioned between the current H4 demand and round number 1.32.
Areas of consideration:
In view of our technical reading, overall structure remains restricted at the moment.
To the upside, we have the 1.33 handle and a Quasimodo resistance at 1.3329 on the H4 timeframe, and a resistance at 1.3347 on the daily timeframe. To the downside, demand at 1.3235-1.3264 is visible on the H4 scale, along with daily support at 1.3260. This is positioned just north of weekly support at 1.3223.
Given this, neither a long nor short seems attractive at the moment.
Today’s data points: FOMC Member Williams Speaks; Chicago PMI; Canadian Growth Figures m/m.
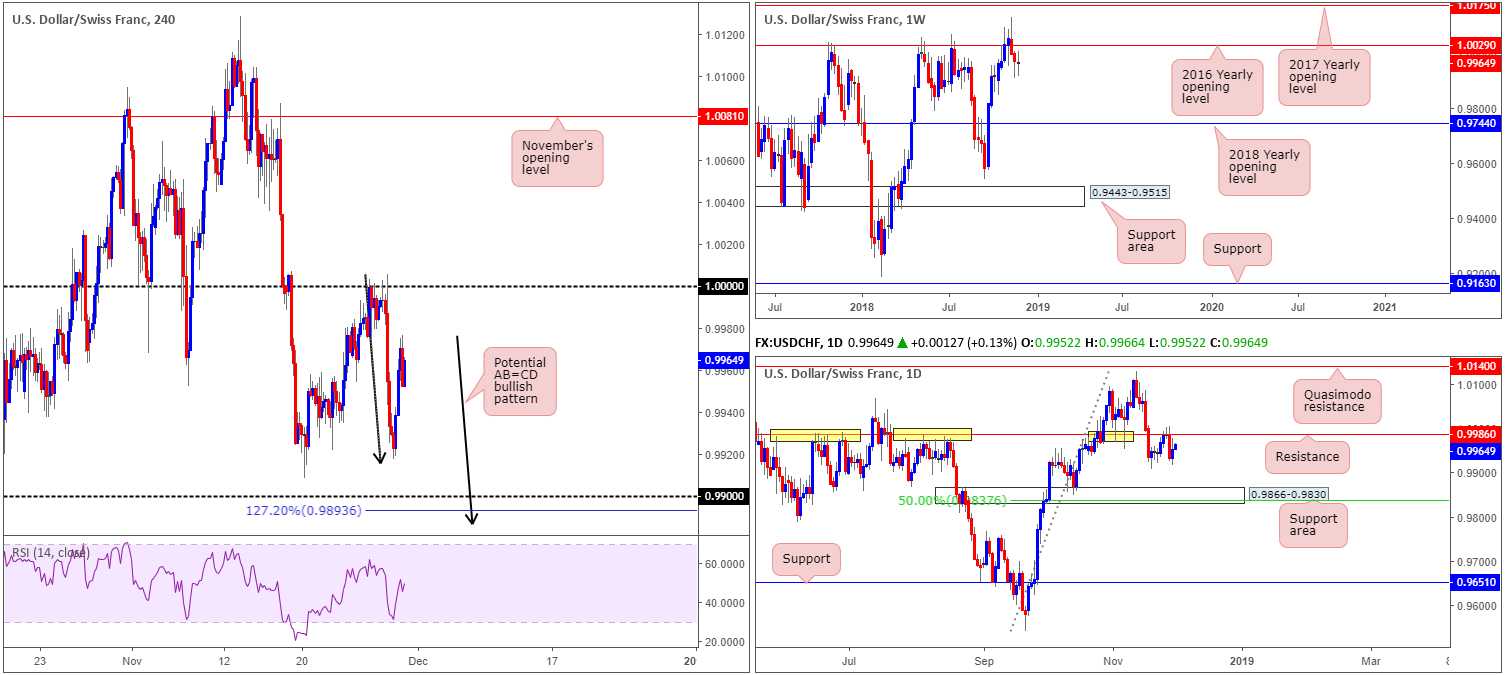
USD/CHF:
London/New York trade Thursday witnessed the USD/CHF print a modest recovery off lows 0.9917, consequently reclaiming a portion of Wednesday’s Powell-led USD slump. This, as can be seen from the H4 timeframe, has given rise to a possible AB=CD bullish pattern (black arrows) potentially forming just south of 0.99 at around the 127.2% Fib ext. point drawn from 0.9893.
Continued buying today, on the other hand, will likely bring the H4 candles towards 1.0000 (parity). For those who followed our analysis this week will likely recall 1.0000 being labelled a high-probability sell zone due to it closely converging with daily resistance at 0.9886, which itself has notable historical significance. It might also be worth noting the weekly candles remain languishing beneath resistance at 1.0029 in the shape of an indecision candle: the 2016 yearly opening level.
Areas of consideration:
Both 1.0000 and 0.99ish are both of interest today, though 1.0000 emphasizes a slightly stronger tone owing to its connection with daily structure (see above). Despite this, both, according to our research team, require additional candlestick confirmation prior to pulling the trigger (entry/stop parameters can be defined according to this configuration). This is simply because round numbers are prone to fakeouts/stop runs.
Today’s data points: FOMC Member Williams Speaks; Chicago PMI; CHF KOF Economic Barometer.
Dow Jones Industrial Average:
US equities were relatively subdued Thursday, following yesterday’s notable advance north amid Fed Chair Powell’s speech on monetary policy.
H4 price, as you can see, came within striking distance of testing resistance priced in at 25478. By and of itself, this barrier packs reasonably solid history, and is also connected closely with a 61.8% H4 Fibonacci resistance value at 25488 as well as having a confirming H4 RSI divergence/overbought reading. Having seen the ‘near-test’ of the level form a relatively nice-looking H4 bearish pin-bar formation, this may be sufficient enough to draw in additional sellers today. This is further supported by potential daily supply lurking (black arrow) around the 25492-25305 neighbourhood.
Against the backdrop of H4 and daily flow, nonetheless, traders may also want to take into account weekly price exhibits space to explore higher ground until connecting with a Quasimodo resistance plotted at 26182.
Areas of consideration:
Although weekly price suggests we could be in for higher prices, further downside from the H4 resistance at 25478, given its surrounding confluence and recent H4 bearish pin-bar pattern, is still a strong possibility.
Shorts at current price will likely be looking to position stops around 25648ish (above any H4 supply). As for downside support targets, the team has H4 support at 24882 on the radar, followed by the 2018 yearly opening level on the weekly timeframe at 24660.
Today’s data points: FOMC Member Williams Speaks; Chicago PMI.
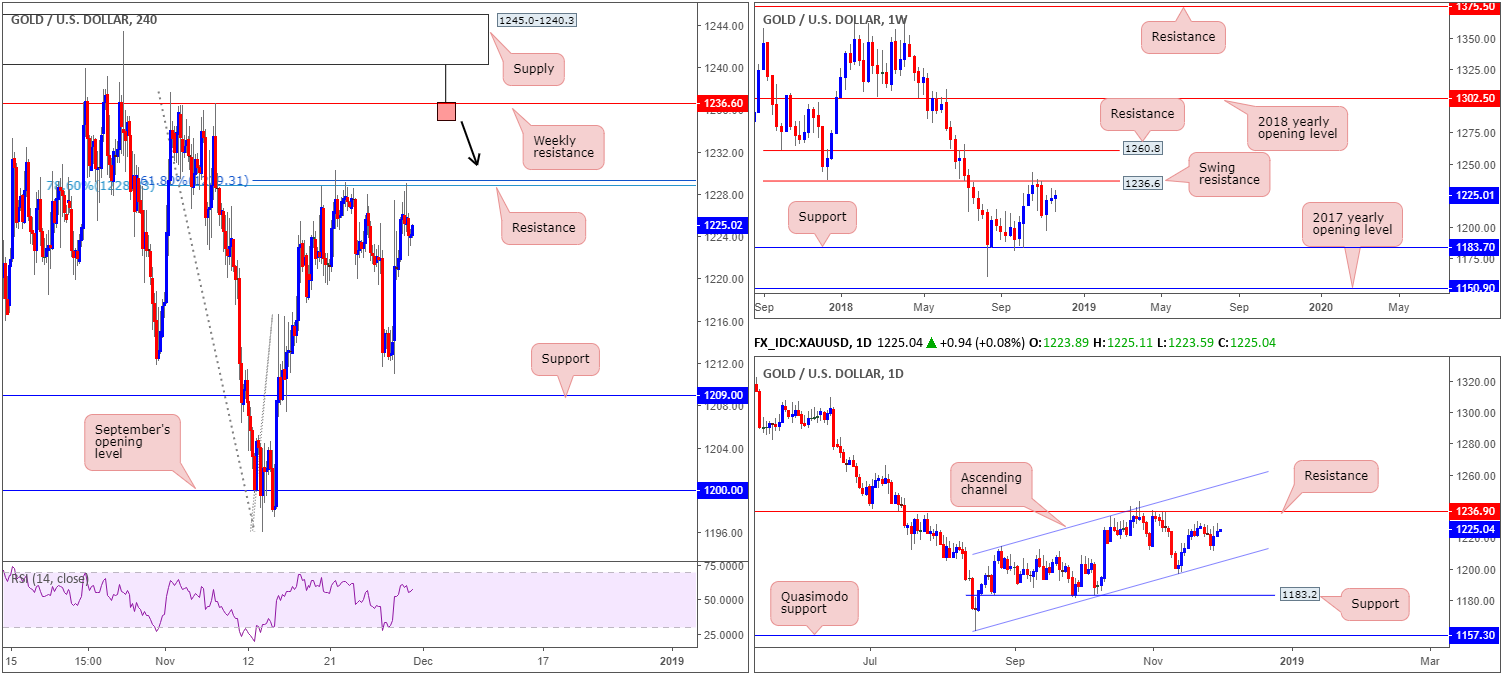
XAU/USD (GOLD):
H4 resistance by way of two nearby Fibonacci levels: a 161.8% Fibonacci ext. point at 1229.3 and a 78.6% retracement resistance at 1228.8 has played a crucial role in recent trade. As attractive as the area may be, however, a move higher is still likely on the cards, according to our technical reading.
The weekly timeframe exhibits potential to continue pushing north until reaching a swing resistance plotted at 1236.6. A similar story is seen on the daily timeframe, whereby the next upside target on this scale falls in at resistance drawn from 1236.9.
Areas of consideration:
Outlook remains unchanged.
Weekly swing resistance mentioned above at 1236.6 is of interest. This places the nearby H4 Fibonacci resistances in a vulnerable position.
With H4 supply at 1245.0-1240.3 positioned just north of the weekly resistance line, traders should prepare for the possibility of a fakeout play through the weekly level. In the event a H4 bearish pin-bar formation takes shape that pierces through the weekly resistance and tests the H4 supply (see H4 chart for a visual), this would be considered a high-probability shorting opportunity (stop-loss orders can be positioned either beyond the noted H4 supply or a few pips above the pin-bar’s wick), targeting 1229ish as an initial take-profit zone.
As for downside targets, it’s a little difficult to judge at present prices given we have yet to see an approach form.
The use of the site is agreement that the site is for informational and educational purposes only and does not constitute advice in any form in the furtherance of any trade or trading decisions.
The accuracy, completeness and timeliness of the information contained on this site cannot be guaranteed. IC Markets does not warranty, guarantee or make any representations, or assume any liability with regard to financial results based on the use of the information in the site.
News, views, opinions, recommendations and other information obtained from sources outside of www.icmarkets.com.au, used in this site are believed to be reliable, but we cannot guarantee their accuracy or completeness. All such information is subject to change at any time without notice. IC Markets assumes no responsibility for the content of any linked site. The fact that such links may exist does not indicate approval or endorsement of any material contained on any linked site.
IC Markets is not liable for any harm caused by the transmission, through accessing the services or information on this site, of a computer virus, or other computer code or programming device that might be used to access, delete, damage, disable, disrupt or otherwise impede in any manner, the operation of the site or of any user’s software, hardware, data or property.


